The Application of Social Media in Modern-Day Influence Campaigns: Personality Profiling and
Information Warfare.
Joshua Watt May 3, 2023
Thesis submitted for the degree of Master of Philosophy
in
Applied Mathematics / Statistics at The University of Adelaide
Faculty of Engineering, Computer and Mathematical Sciences
School of Mathematical Sciences
Contents
Signed Statement xv
Acknowledgements xvii
Abstract xix
1 Introduction 1
2 Background 7
2.1 Motivation . . . 7
2.2 Personality Models . . . 9
2.2.1 OCEAN Personality Model . . . 9
2.2.2 Myers-Briggs Personality Model . . . 12
2.3 Natural Language Processing Tools . . . 19
2.3.1 Linguistic Inquiry and Word Count . . . 19
2.3.2 Valence Aware Dictionary and Sentiment Reasoner . . . 19
2.3.3 Bidirectional Encoder Representations from Transformers . . . 20
2.3.4 Botometer . . . 21
2.4 Mathematical Background . . . 22
2.4.1 Binary Models . . . 22
2.4.2 Statistical Methods . . . 27
2.4.3 Data Manipulation Methods . . . 29
2.5 Literature Review . . . 30
2.5.1 OCEAN Personality Model . . . 30
2.5.2 Myers-Briggs Personality Model . . . 35
2.5.3 The Detection and Influence of Bots . . . 40
3 Modeling Personality using Online Digital Footprints 43 3.1 Data . . . 44
3.1.1 Data Collection . . . 44
3.1.2 Preprocessing . . . 47 iii
3.1.3 Exploratory Data Analysis . . . 53
3.2 Personality Profiling Models . . . 63
3.2.1 Logistic Regression Classifier . . . 63
3.2.2 Model Comparison . . . 72
3.2.3 Drawbacks of using SMOTE with Naive Bayes . . . 76
3.2.4 Feature Importance . . . 78
4 Interaction of bots and humans in discussion of Russia/Ukraine war 89 4.1 Data . . . 90
4.1.1 Data Collection . . . 90
4.1.2 Preprocessing . . . 91
4.1.3 Exploratory Data Analysis . . . 93
4.2 The Effects of Bots on the Discussion . . . 99
5 Conclusion 109 A Personality Profiling Model Results 115 A.1 Naive Bayes Classifier . . . 115
A.2 Support Vector Machine Classifier . . . 118
A.3 Random Forest Classifier . . . 121
Bibliography 125
List of Tables
2.1 Jungian model of conscious personality types. . . 13 2.2 An overview of the literature to date which has modelled the OCEAN per-
sonality type of social media users. We present the best models from each paper, as determined by the metric chosen by each of the authors. Most authors model each trait independently, however Ba¸saran and Ejimogu [12] model the traits altogether and do not assume independence. While it appears that Ba¸saran and Ejimogu [12] achieve the best accuracy, it is important to note that the dataset used in their analysis was incredibly unbalanced and the authors appear to make no attempt to deal with class imbalance in the model. Hence, it is likely that the model performance is low for this model. Note that some models have formulated a classification problem and others a regression problem, resulting in the use of different metrics. The former assumes someone either displays the trait or they do not and the latter represents the trait on a scale. . . 35 2.3 An overview of the literature to date which has modelled the Myers-Briggs
personality type of social media users. We present the best models from each paper, as determined by the metric chosen by each of the authors.
Most authors model each trait independently, however Patil et al. [111]
model the traits altogether and do not assume independence. It is difficult to compare model performance as authors utilise different metrics during assessment. However, it appears that the best accuracies were achieved by Bharadwaj et al.[15], where they considered a large number of features in three different machine/deep learning models. Gjurkovi´c and ˇSnajder [59]
were the only authors who acknowledged problems with class imbalance and still achieved good results using the F1 Metric for assessment. . . 39
v
2.4 Correlations between the OCEAN and Myers-Briggs personality traits.
Values were calculated based on a study of 267 men and 201 women who undertook both personality tests. The results for each of the OCEAN traits were correlated with the Myers-Briggs traits, where the Extroverted, In- tuitive, Thinking and Judging traits were represented negatively and their contraries were represented positively. Significant correlations are displayed in bold. These results were obtained from the paper produced by McCrae and Costa [95]. . . 39 3.1 Summary of the accounts obtained for each search query method. We
include the total number of accounts and the mislabelling rate. The mis- labelling rate is determined by manually checking the accounts. . . 46 3.2 Summary of Social Metadata (SM) features which we obtain using the
Twitter API and utilise in our machine learning models. . . 47 3.3 Inclusion-exclusion criteria for a Twitter account to be personality profiled
using our models. . . 50 3.4 Linguistic features in our model, separated by the feature type. Botometer
features are language-dependent features and include the CAP score and sub-category scores. LIWC features are included based on how they appear in the LIWC dictionary – a full description of what each of these features represents, along with examples is provided in the paper by Pennebaker et al.[113]. BERT features include the 768-dimensional embedding vectors for each user and the VADER features include those calculated on both the biography and the tweets. . . 53 3.5 Reported accuracies for the logistic regression models. For each model, we
include the accuracy of correctly predicting all four dichotomies, at least three dichotomies, at least two dichotomies and at least one dichotomy. We report the theoretical accuracies of a random classifier and we determine the accuracies of a majority class classifier using the proportion of types observed in Figure 3.1. . . 66 3.6 Comparison between the accuracies obtained from our standard logistic re-
gression model and the accuracies from models by Plank and Hovy [117]
and Bharadwaj et al. [15]. Plank and Hovy [117] trained a logistic regres- sion model on a dataset from Twitter using n-grams and SM features – their model use no weighting/sampling techniques to deal for class imbal- ances. Bharadwaj et al. [15] trained a number of machine learning/deep learning models on the Personality Cafe Data using TF-IDF and LIWC features – these authors also did not address class imbalances. Note that we display the best performing Twitter model for each dichotomy in bold. 71
List of Tables vii 3.7 Reported accuracies and AUCs for the best performing models from each
Machine Learning model. For each machine learning model, we include the results from the ‘Standard’ model (where we use no weighting/sampling) as well as the results from the best performing weighted/sampling model (ex- cluding the ‘SMOTE + Downsampled’ model). We exclude the ‘SMOTE + Downsampled’ model because it does not completely address class im- balances, and it would resultantly not be a fair comparison. Note that we determine the ‘best performing weighted/sampling model’ based on the sum of their macro-averaged and micro-averaged AUCs. For each model, we include the accuracy of correctly predicting all four dichotomies, at least three dichotomies, at least two dichotomies and at least one dichotomy. We report the theoretical accuracies of a random classifier and we determine the accuracies of the majority class classifier. . . 75 3.8 Means and Variances of the two variables on the minority class. We cal-
culate these statistics on the unbalanced and balanced data. The data is balanced using SMOTE. . . 77 3.9 The number of features and the proportion of features retained in each
feature group after performing the stepwise feature selection on all types of features. For each model, we perform the stepwise feature selection based on thep-values of the features; using an acceptance threshold of 0.05 and a removal threshold of 0.1. Moreover, we display the total number of features selection and the total number of features retained in each model. For each model, we perform a Chi-Squared Test to test the null hypothesis that each feature group is equally as informative (per feature) and display thep-value in the table captions. Note that there are a total of 866 features: 11 SM features, 74 LIWC features, 768 BERT features, seven Botometer features and six VADER features. . . 85 4.1 Hashtags which are queried to obtain our dataset (we refer to these as query
hashtags). We use these hashtags to obtain all Tweets, Retweets, Quotes and Replies over the fortnight post Russia’s invasion of Ukraine, predating the invasion by one day. . . 91 4.2 The top ten most frequently occurring languages of content in our dataset.
The total dataset is comprised of 5,203,746 posts and was obtained using the query hashtags given in Table 4.1. . . 92 4.3 Proportion of Accounts labelled with each national lean label. This shows
that most accounts fell into the ‘ProUkraine’ category and a surprising number had most of their tweets containing a balanced number of ‘ProUkraine’
and ‘ProRussia’ hashtags. . . 93
A.1 Reported accuracies for the naive bayes models. For each model, we include the accuracy of correctly predicting all four dichotomies, at least three dichotomies, at least two dichotomies and at least one dichotomy. We report the theoretical accuracies of a random classifier and we determine the accuracies of a majority class classifier using the proportion of types observed in Figure 3.1. . . 118 A.2 Reported accuracies for the support vector machine models. For each
model, we include the accuracy of correctly predicting all four dichotomies, at least three dichotomies, at least two dichotomies and at least one di- chotomy. We report the theoretical accuracies of a random classifier and we determine the accuracies of a majority class classifier using the propor- tion of types observed in Figure 3.1. . . 121 A.3 Reported accuracies for the random forests models. For each model, we
include the accuracy of correctly predicting all four dichotomies, at least three dichotomies, at least two dichotomies and at least one dichotomy. We report the theoretical accuracies of a random classifier and we determine the accuracies of a majority class classifier using the proportion of types observed in Figure 3.1. . . 124
List of Figures
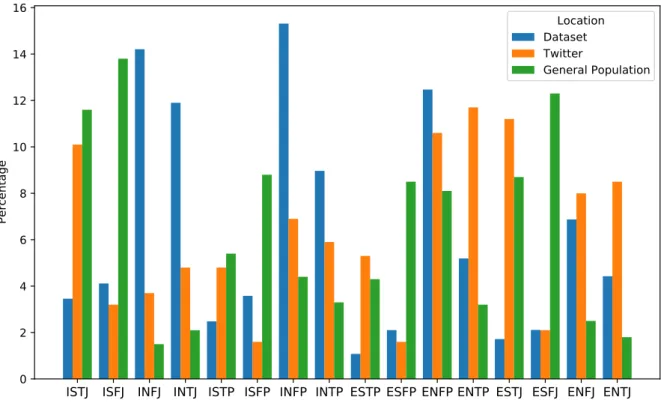
2.1 Personality types in the OCEAN personality model [64]. . . 10 2.2 Personality types in the Myers-Briggs Type Indicator [128]. . . 15 3.1 Proportions of the 16 MBTI types in our dataset, on Twitter and in the
general population. We obtain the personality types on Twitter from a study by Schaubhut et al. [136] on 1,784 Americans. This study involved these participants sitting a MBTI questionnaire and answering whether they have an active Twitter account. Moreover, we determine the propor- tion of personality types in the general population from results by Robinson [129] which are obtained from the official Myers-Briggs website. . . 54 3.2 Proportion of accounts displaying each dichotomous trait in our dataset,
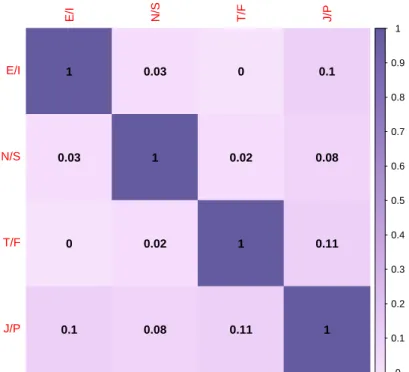
on Twitter and in the general population. . . 55 3.3 Pairwise results of the Cram´er’s V Statistic between each of the Myers-
Briggs dichotomies for our dataset. Each panel displays and is coloured by the value of the Cram´er’s V Statistic. Note we use the bias corrected version of the statistic which is discussed in Section 2.4.2. . . 57 3.4 Correlations between the SM, LIWC, VADER and Botometer features.
The axis labels are coloured based on the feature group they belong to, as described in the legend at the top of the figure. Each panel is coloured based on the pairwise Pearson Correlation between the two features, as described by the colour bar on the right hand side of the figure. Note that we exclude BERT features because they do not provide any labelled information about a user and there is simply just too many of them to meaningfully display. . . 59 3.5 Average absolute Pearson correlations within and between different groups
of features, calculated using Equation 3.1. In our calculations, we do not include correlations between the same individual features because it will always be one. We take the absolute value of pairwise correlations between the features to avoid them negating in the sum. Each panel displays the average absolute correlation value and can be interpreted as the average correlation strength within and between different groups of features. . . 61
ix
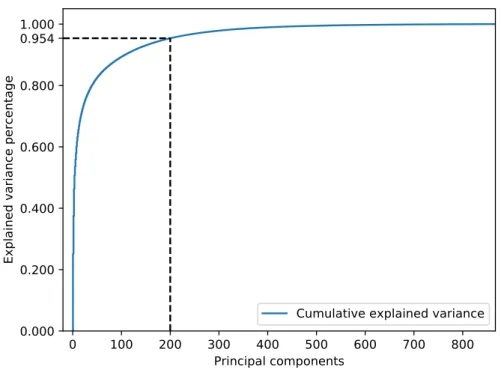
3.6 Cumulative explained variance of the principal components calculated on the features in our dataset. The explained variance of each principal com- ponent is calculated based on their eigenvalues - as discussed in Section 2.4.3. We include the horizontal and vertical black dotted lines to indicate the explained variance of the first 200 principal components – this is also the number of principal components we include in our subsequent models.
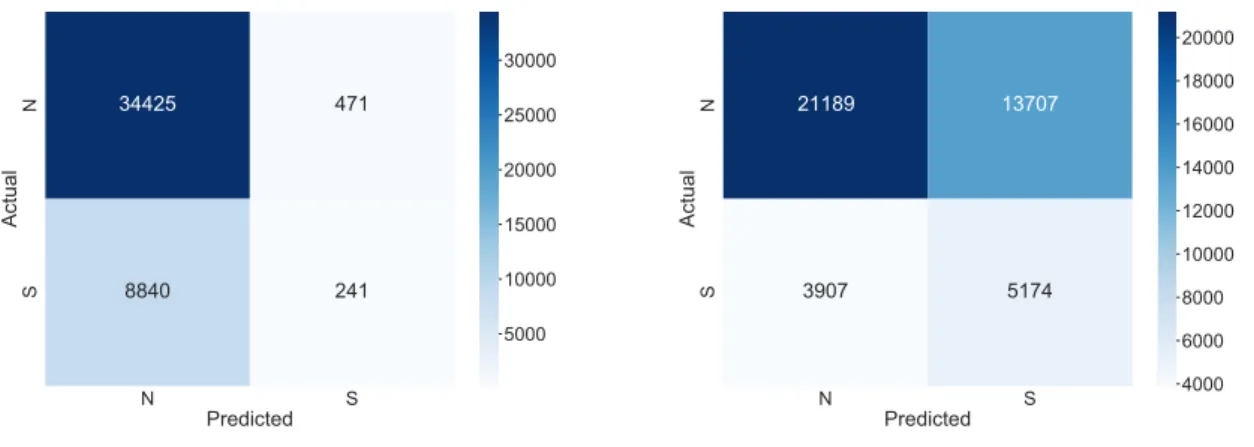
Note that the features were standardized prior to performing the PCA. . . 62 3.7 Confusion matrices when applying the standard logistic regression model
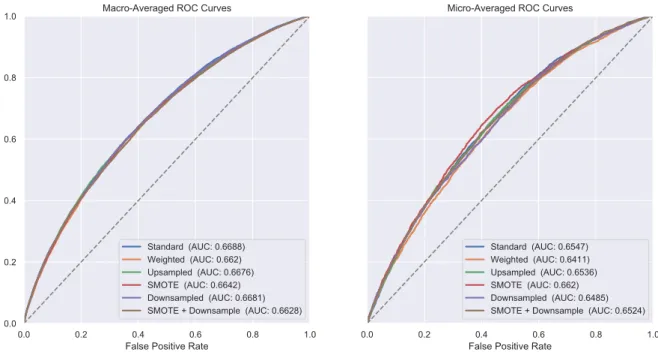
(left) and the upsampled logistic regression model (right) to the Intu- itive/Sensory dichotomy. We include the results from the Intuitive/Sensory dichotomy because it is the most unbalanced dichotomy and best demon- strates how a sampling technique impacts the predictions from a model. . . 65 3.8 Macro-averaged (left) and Micro-averaged (right) Receiver Operating Char-
acteristic (ROC) curves for each logistic regression model. Note that we macro-average and micro-average the results from the independent models for each dichotomy using Equations 3.2 and 3.3, respectively. We include the Area Under the Curve (AUC) metric for each of the ROC curves as well. 68 3.9 Summary of metrics from the logistic regression models of the four inde-
pendent Myers-Briggs dichotomies. These metrics include the Accuracy, Area Under the Curve (AUC), F1, Precision and Recall Scores. For each model, these metrics were calculated based on a ten-fold cross validation . 70 3.10 Two-dimensional example of a scatterplot of the training data before (left)
and after (right) utilising SMOTE. In this case, we use SMOTE to com- pletely balance the two classes. Prior to using SMOTE there were 2000 samples in the majority class and 50 samples in the minority class. An overview of SMOTE is provided in Section 2.4.3. . . 77 3.11 The decision boundary from utilising naive Bayes on the unbalanced (left)
and balanced (right) training data. In each case, we include the unbal- anced training data in the plot for reference to the decision boundary. An overview of naive Bayes is provided in Section 2.4.1. . . 78 3.12 Variable Importance Plots (VIPs) based on an upsampled logistic regres-
sion model for each dichotomy. We determine the variable importance using the t-statistic for the parameters associated with each feature. Vari- ables are sorted by the absolute value of the variable importance (from top to bottom). We colour the bar based on the features preference for each dichotomous class. Note that we do not include BERT features in the VIPs because they’re meaning cannot be inferred. . . 80
List of Figures xi 3.13 Variable Importance Plots (VIPs) based on an upsampled logistic regres-
sion model for each dichotomy – we include only EMOJI counts in the model. We determine the variable importance using the t-statistic for the parameters associated with each feature. Variables are sorted by the abso- lute value of the variable importance (from top to bottom). We colour the bar based on the features preference for each dichotomous class. . . 82 3.14 Word clouds based on the most frequently occurring words in tweets from
our dataset. Larger words appeared more frequently in the tweets - we present results for the rocket ship emoji (left) and the red heart emoji (right). Note that we remove stopwords as they do not provide much context for the tweets. . . 83 3.15 95% Wilson Score Binomial Confidence Intervals for the proportion of re-
tained features in each feature group. We display the confidence intervals for each model and use the Wilson Score version to correct for having zero successes in some cases. The confidence intervals are based on the results in Table 3.9 and we observe they align with the p-values observed in this table. . . 86 4.1 Average hourly probabilities of bots tweeting query hashtags (top). Hourly
frequency of the query hashtags (middle). Hourly frequency of content (bottom). The time period we consider is the first fortnight after Russia’s invasion of Ukraine. Both plots also include five significant events over this time period. Note that the query hashtags can be found in Section 4.1.1. We can observe a significant spike in the bot activity of several bot types on the 2nd and 4th of March. The spike in bot activity on the 2nd of March aligns with Russia’s capture of Kherson, and also aligns with a significant increase in pro-Russia hashtags. This spike in activity was due to an increase in activity of pro-Russian bots – likely used by Russian authorities. The spike in bot activity on the 4th of March aligns with when the use of pro-Russia hashtags diminished, but also when Russia captured the Zaporizhzhia nuclear power plant. This spike was due to an increase in activity of pro-Russian bots (before being removed) and an increase in activity of pro-Ukrainian bots – likely by pro-Ukrainian authorities in response to Russian bots. . . 95 4.2 Average hourly Botometer results showing the daily cycle. The time series
observed in Figure 4.1 (top) is averaged based on the hour of the day (UTC time). Note that the coloured range for each of the bot types represents the 95% confidence interval for the data at each coordinate. . . 96 4.3 Probabilities of bot types based on national lean and bot type. Establishing
the national lean is described in Section 4.1.2. . . 97
4.4 The distribution of Overall bot probabilities based on the National Lean of accounts. Both distributions appear bimodal, signifying there are very few accounts exhibiting both bot-like and human-like behaviour. . . 98 4.5 The correlation between different bot types and each of the LIWC cate-
gories. The panel of each square represents the correlation strength between the two variables. This figure can be used to understand whether we ob- serve different conversations among the bots, compared to human accounts.
We observe fairly low correlations in each case, with all being no greater than 0.1 and no less than −0.1. . . 99 4.6 A series of pairwise Granger Causality Tests are performed to examine
whether the activity of bot types is Granger-causing changes in discus- sions of the LIWC categories. The heat maps colour describes the bot effect strength and direction from the Granger Causality Test (over 12 hours/lags) between the time series of hourly bot proportions and the time series of hourly LIWC category proportions. The number in the centre describes the most prolific lag in the Granger Causality Test. We calculate the bot effect strength using the F-score from an F-test on the Granger Causality linear models. Moreover, we calculate the bot effect direction and most prolific lag using the sign and lag (respectively) of the largest β coefficient from Eq. 2.2 in Section 2.4.2. We perform a Bonferroni Adjust- ment on the p-values from the Granger Causality Tests and only show the Bot Types and LIWC Categories with a significant adjusted p-value (<0.05).101 4.7 Word Clouds which demonstrate the frequency of words in particular LIWC
categories. Larger words appear more frequently, relative to smaller words in the word cloud. . . 102 4.8 Lagged cross correlations between the hourly Self Declared bot proportions
and the significant hourly LIWC Category proportions (significance is de- termined from the results in Figure 4.6). We consider 48 hours/lags for each of these plots and represent the significance threshold using a hori- zontal dotted line. This plot can be used to examine the extent to which the bots drive changes in online discussion and how long these effects can persist for. . . 104 4.9 Time series plots of the self-declared bot activity as well as six different
LIWC categories. We choose these six LIWC categories because they are significantly effected by the activity of the self-declared bots (see Figure 4.6). We include several significant events on the figure, as we have done with previous time-series plots. . . 105
List of Figures xiii A.1 Summary of metrics from the naive bayes models of the four independent
Myers-Briggs dichotomies. These metrics include the Accuracy, Area Un- der the Curve (AUC), F1, Precision and Recall Scores. For each model, these metrics were calculated based on a ten-fold cross validation . . . 116 A.2 Macro-averaged (left) and Micro-averaged (right) Receiver Operating Char-
acteristic (ROC) curves for each naive bayes model. Note that we macro- average and micro-average the results from the independent models for each dichotomy using Equations 3.2 and 3.3, respectively. We include the Area Under the Curve (AUC) metric for each of the ROC curves as well. . . 117 A.3 Summary of metrics from the support vector machine models of the four
independent Myers-Briggs dichotomies. These metrics include the Accu- racy, Area Under the Curve (AUC), F1, Precision and Recall Scores. For each model, these metrics were calculated based on a ten-fold cross validation119 A.4 Macro-averaged (left) and Micro-averaged (right) Receiver Operating Char-
acteristic (ROC) curves for each support vector machine model. Note that we macro-average and micro-average the results from the independent mod- els for each dichotomy using Equations 3.2 and 3.3, respectively. We include the Area Under the Curve (AUC) metric for each of the ROC curves as well.120 A.5 Summary of metrics from the random forests models of the four indepen-
dent Myers-Briggs dichotomies. These metrics include the Accuracy, Area Under the Curve (AUC), F1, Precision and Recall Scores. For each model, these metrics were calculated based on a ten-fold cross validation . . . 122 A.6 Macro-averaged (left) and Micro-averaged (right) Receiver Operating Char-
acteristic (ROC) curves for each random forests model. Note that we macro-average and micro-average the results from the independent models for each dichotomy using Equations 3.2 and 3.3, respectively. We include the Area Under the Curve (AUC) metric for each of the ROC curves as well.123
Signed Statement
Icertifythatthis workcontainsnomaterialwhichhasbeenacceptedfortheawardofany otherdegreeordiplomainmynameinanyuniversityorothertertiaryinstitutionand,to thebestofmyknowledgeand belief,containsnomaterial previouslypublishedorwritten byanotherperson, except wheredue referencehas beenmade in the text. In addition, I certifythat no part of this work will, in the future, be used in a submission in my name foranyotherdegreeordiplomainanyuniversityorothertertiaryinstitutionwithoutthe priorapprovaloftheUniversityofAdelaideandwhereapplicable,anypartnerinstitution responsiblefor the joint awardof this degree.
Ialso givepermission forthedigitalversion ofmythesistobemadeavailableonthe web, via the University’s digital researchrepository, the Library Search and also through web searchengines,unlesspermission hasbeen grantedbythe Universitytorestrictaccessfor aperiod of time.
I acknowledge the support I have received for my research through the provision of an AustralianGovernment ResearchTraining ProgramScholarship.
Signed: . . . Date: . . . .
xv
03/05/2023
Acknowledgements
I would firstly like to acknowledge my parents (Vicky Watt and Stuart Watt) as well as my brother (Hamish Watt) who have all been very supportive of me throughout my education. They have always encouraged me to pursue my desired career pathways and have provided me with the necessary guidance over these years, enabling me to obtain Bachelor’s and Master’s Degrees.
I would also like to acknowledge both my supervisors (Lewis Mitchell and Jonathan Tuke) who have assisted me over the past two years – I couldn’t have asked for a better super- vision team. They have edited my work, supported me to go to conferences and provided me with general career guidance. I look forward to maintaining a great relationship with them both and I thank them for their constant support.
Finally, I would like to thank two of my teachers: Angela MacDonald (Year 10 Maths) and Philip Moore (Year 12 Specialist Maths) who both helped me realise I was good at mathematics and encouraged me to pursue it at the tertiary level.
xvii
Abstract
Social media has become a repository of peoples’ information, where nearly 60% of the worlds population share ideas and exchange opinions. While this enables humans to be more connected than ever, it also creates an environment where peoples’ data can be used to manipulate opinions at large scales. Our work extends existing techniques which aim to quantify the extent to which public opinion and online discourse can be influenced by companies/governments. Firstly, we explore how an individuals online digital footprint can be used to understand personal attributes about them, such as their personality type.
We then consider how this sort of information can be utilised for influence operations in modern-day conflicts, such as the 2022 Russia/Ukraine war.
Personality profiling has been utilised by companies for targeted advertising, polit- ical campaigns and vaccine campaigns. However the accuracy and versatility of such models still remains relatively unknown. Consequently, we aim to explore the extent to which peoples’ online digital footprints can be used to profile their Myers-Briggs person- ality type. We analyse and compare the results of four models: logistic regression, naive Bayes, support vector machines and random forests. We discover that a support vector machine model achieves the best accuracy of 20.95% for predicting someones complete personality type. However, logistic regression models perform marginally worse and are significantly faster to train and predict, highlighting that relatively simple models can out- perform complex machine learning models. We acknowledge the presence of substantial class imbalance in our dataset and compare a number of methods for fixing the problems encountered with this. Moreover, we develop a statistical framework for assessing the importance of different sets of features in our models. We discover some features to be more informative than others in the Intuitive/Sensory (p= 0.032) and Thinking/Feeling (p = 0.019) models. While we apply these methods and models to Myers-Briggs person- ality profiling, they could be more generally used for any labelling of individuals on social media.
The 2022 Russian invasion of Ukraine emphasises the role social media plays in modern-day conflicts, with both sides fighting in the physical and information environ- ments. There is a large body of work on identifying malicious cyber-activity, but less focusing on the effect this activity has on the overall conversation, especially with regards to the Russia/Ukraine Conflict. Here, we employ a variety of techniques including senti-
xix
ment/linguistic analysis and time series analysis to understand how certain bot activity influences wider online discourse. In our results we observe that self declared bots most strongly increase discussions of work/governance (p= 3.803×10⁻¹⁸) with the most promi- nent effects after five hours. Moreover, we observe that self declared bots increase angst in the online discourse (p= 2.450×10⁻⁴) and discussions of motion (p= 7.93×10⁻¹⁰) with the most prominent effects after seven hours and three hours, respectively. Discussions of motion were most often involved with staying/fleeing a country and hence self-declared bots were likely influencing peoples’ decision to flee their country or not. Our work ex- tends and combines existing techniques to quantify how bots are influencing people in the online conversation around the Russia/Ukraine invasion. It provides a statistical frame- work which can be applied more generally to any influence campaign on social media and enables researchers to quantitatively understand what makes these campaigns impactful.
Chapter 1 Introduction
Social media is an interactive technology that facilitates the creation and sharing of in- formation through virtual communities and networks. Social media is believed to have existed since the 1960s where the Programmed Logic for Automatic Teaching Operations (PLATO) System was launched, the first online chat room [77]. However, it wasn’t until after the launch of Facebook in 2004 that media became available to everyone with inter- net access, and its usage consequently soared. When combined with the introduction of smart phones and high speed internet, social media has enabled humans to be more con- nected than ever. Contacting overseas friends or relatives is now possible from anywhere in the world, all with the touch of a button.
Nowadays there are thousands of social media applications and over 4.59 billion peo- ple use social media worldwide, constituting approximately 60% of the world’s population [46]. While this enables most of the world to be connected, it also creates an environment of mass data, defining what we refer to as the information environment. There are two important aspects of social media which are unique to this type of information environ- ment. Firstly, there are huge amounts of individual-level data that each user provides, and secondly, there is an underlying dialogic transmission system; with many sources of information and many receivers. Consequently, it is crucial for scholars to understand how these two aspects of social media impact society. In what follows, we discuss how these two aspects of social media create a climate which can be weaponised by governments and other organisations.
Every time a user enters a social media application, they leave a unique trace of data – this includes information they have posted, liked, shared, commented and even how long they have spent viewing different material on the application. We refer to this unique trace of data as a user’s online digital footprint. It has been suggested that someone’s online digital footprint can be used to expose a lot of information about them;
including their personality profile, relationship status, political opinions and even their propensity to adopt a particular opinion [162, 111, 143, 144]. One example of this is the British political consulting company, Cambridge Analytica, which were suggested to
1
use peoples’ online digital footprints to impact the result of the 2016 US election and the 2016 Brexit referendum by former employee and whistleblower, Christopher Wylie.
However, the extent to which companies like Cambridge Analytica can determine this information from social media data is still questioned by many scholars [111, 143, 144].
As a result, it is of interest for many individuals to understand the extent of information that is attainable from their online digital footprint. If companies with access to this data can accurately predict personal information about people, then it is possible for it to be misused and potentially weaponised. This is of key concern for governments, who seek to maintain democracies and the ethical use of such data, both of which can be abused by understanding such personal information.
The dialogic transmission system which underlies social media means there are many sources and receivers of information. This differs greatly from traditional media, such as newspapers, TV and radio, where there are few sources of information but many re- ceivers. Because of this, it is very hard to distinguish between information that is accurate and information that is not, such as misinformation/disinformation. This makes social media a critical tool in information warfare, playing a considerable role in the 2022 Rus- sian/Ukraine war [29, 119], for example disinformation and more generallyreflexive control [148] have been used by Russia and other countries against their enemies and internally for many years [49]. A relative newcomer in this space – Twitter – has already been extensively used for such purposes during military conflicts, for instance in Donbass [49], but its role in conflicts is evolving and not fully understood. Both sides in the Ukrainian conflict use the online information environment to influence geopolitical dynamics and sway public opinion. Russian social media advances narratives around their motivation, and Ukrainian social media aims to foster and maintain external support from Western countries, and promote their military efforts while attempting to undermine perceptions of the Russian military. Examples of these narratives include allegations: that Ukraine was developing biological weapons [161], that President Volodymyr Zelenskyy had sur- rendered [28, 85], and that there is a sustained campaign showing the apparent success of
‘The Ghost of Kiev’ – a mythical MiG-29 Fulcrum flying ace credited with shooting down six Russian planes over Kyiv [89]. Some of the information being pushed is genuine, and some is malicious. It is not easy to discriminate which is which.
As a result, it is important to understand and measure the extent to which the huge amounts of individual-level data and the dialogic transmission system can be utilised by individuals and groups of individuals. We explore this by developing statistical frame- works which underpin the vulnerabilities in these unique aspects of social media. Our analysis is separated into two parts which address: (i) what personal information can be learnt about individual accounts, and (ii) whether groups of automated online accounts can influence many human accounts. We perform an analysis of Twitter data in each case. Firstly, we seek to determine how informative someones’ online digital footprint is in predicting their personality type. The Myers-Briggs personality model is a theoretical
3 model comprised of four traits/dichotomies – this model was developed by American per- sonality researchers and based on the theory of Carl Jung [18, 79]. Modelling personal information about individuals using their online information has previously enabled re- searchers to understand the accuracy of such models. In our research, we extend this work by creating a new labelled dataset of Myers-Briggs personality types on Twitter and a statistical modelling framework which can be generally applied to any labelled character- istic of online accounts. In essence, our work aims to reconsider the personality profiling and political microtargetting performed by companies like Cambridge Analytica – we do this by validating the performance of these types of models and we quantify the impor- tance of their features. Secondly, we seek to discover how influential automated online accounts (bots) are in the online discussion of the Russia/Ukraine war. Measuring and interpreting various language features has previously allowed researchers to understand community dynamics and identify inauthentic accounts and content [140, 120, 9]. Here we apply and extend these techniques to understand and quantify the influence of bot-like accounts on online discussions, using Twitter data focussed on the Russian invasion of Ukraine. In essence we seek to determine whether the malicious influence campaigns work as intended.
In Chapter 2, we provide a background of our work which provides the context and purpose of the research. Firstly, we motivate our analysis by discussing how social media creates an environment that can be exploited by various governments and companies.
We then provide an overview of two different personality models: the OCEAN person- ality model and the Myers-Briggs personality model. The former was created using a statistical approach and the latter was formulated using a theory-based approach. In our analysis, we use the Myers-Briggs personality model. We then provide an overview of the Natural Language Processing (NLP) tools used throughout our research. This in- cludes Linguistic Inquiry and Word Count (LIWC; pronounced “Luke”) [113], Valence Aware Dictionary for Sentiment Reasoning (VADER) [74], Bidirectional Encoder Repre- sentations from Transformers (BERT) [41], and Botometer [163], a supervised machine learning classifiers which distinguishes bot-like and human-like accounts. We then provide a mathematical background which consists of: the binary models used in to profile the personalities of Twitter users, the statistical methods for hypothesis testing, and data manipulation methods used throughout our analysis. Finally, we perform a literature review of personality profiling work to date as well as work on the detection/influence of bots. As part of this, we provide a detailed overview of the performance of the personality profiling models which utilise the OCEAN and Myers-Briggs frameworks. We find that most of the work in this field focuses on obtaining models of high accuracy and often doesn’t acknowledge class imbalances in the data. Hence, we argue for more research focusing on more interpretable models and dealing with class imbalances in data of this type – both of which we explore in this analysis. On the topic of bot influence/detection, we find that a lot of the work focuses on the detection of automated accounts, with very
little work focusing on their influence and no work (to our knowledge) focusing on their influence during the 2022 Russia/Ukraine war. This highlights the importance of our research objectives and emphasises the relevance of our results.
In Chapter 3, we aim to determine how informative someones’ online digital footprint is in predicting their Myers-Briggs personality type. We do this by first collecting a labelled dataset of accounts with their Myers-Briggs personality types. We observe that people self-report their personality types on Twitter and exploit this by querying for profiles which have done so – these accounts then form our labelled dataset. We collect a number of different features for these accounts including social metadata features and linguistic features. Linguistic features include LIWC, VADER, BERT and Botometer features. A number of preprocessing steps are then performed on the data to ensure it is appropri- ate for modelling. We then perform an exploratory data analysis (EDA) on the dataset, where we firstly consider any potential biases that may arise as well as the balance of the dichotomies. We find that some of the dichotomies are very unbalanced, which leads us to consider five weighting/sampling techniques in our models. As part of the EDA, we then consider the independence of the dichotomies as well as the various features in our models. We find that the dichotomies are fairly independent, so we will consequently per- form independent models on each of the four dichotomies. Moreover, we find that some of the features have high correlations with one another, leading us to perform a princi- pal component analysis, which both reduces the dimension of the feature space and the multicollinearity of the features. Using these features, we then perform four independent logistic regression models on each dichotomy to model the the Myers-Briggs personality type of the accounts. As part of this, we also consider five different weighting/sampling techniques to adjust for class imbalances. We compare the results of the logistic regression models with naive Bayes classifiers, support vector machines and random forest models, and discover that synthetic minority oversampling technique (SMOTE) performs poorly with naive Bayes. Hence, we perform a low-dimensional example of SMOTE with naive Bayes which outlines a discrepancy with combining both these techniques. Lastly, we provide a statistical framework for analysing the importance of different features in these models. We consider the importance of features at an individual level and across groups of features for each dichotomy. As a whole, this chapter outlines how an environment of mass data, like social media, can be used to profile personal characteristics about individuals at large scale.
In Chapter 4, we seek to discover how influential automated online accounts (bots) are in the online discussion of the 2022 Russia/Ukraine war. We do this by first col- lecting a dataset of Twitter content related to the Russia/Ukraine war over the first two weeks since Russia invaded Ukraine. We queried hashtags in support of Russia/Putin and Ukraine/Zelenskyy to obtain the relevant content. We then performed preprocess- ing on the dataset which consisted of calculating the Botometer results for a portion of these accounts sharing these hashtags. Moreover, we use these hashtags to calculate a
5 national ‘lean’ for the accounts, which outlines whether the accounts were in support of Russia/Putin, Ukraine/Zelenskyy or a combination of both. We then consider a time series of the bot activity and observe how this aligns with the hashtag activity as well as a number of significant events which occurred over the first two weeks of the war. Next we analyse the distribution of bot probabilities based on the national ‘lean’ of the accounts to examine how each side of the conflict utilise bots. We then consider the effects of bots on the overall discussion surrounding the conflict. We do this by formulating a statistical framework which allows us to observe the effects of bot activity on the linguistic content of the discussion. We consider linguistic features of the discussion such as conversations of angst, friends and motion. As part of this, we discover the types of words which are most frequently occurring for each linguistic category. Altogether, this chapter allows us to discover how the dialogic transmission system underpinning social media can be weaponised by governments in a modern day conflict to influence public discussion at a large scale.
Our work aims to extend existing techniques to understand how companies and gov- ernments can utilise social media to profile personal characteristics about individuals and influence public discussion on a large scale. The main contributions are:
• A labelled dataset of approximately 44,000 Twitter users along with their Myers- Briggs personality types, this dataset is the largest available dataset (to our knowl- edge) of labelled Myers-Briggs personality types on Twitter.
• A statistical framework which combines NLP tools and mathematical models to model/predict the personality type of users online – this same framework can be more broadly utilised to model any labelled characteristics about online accounts.
• A comparison of different machine learning models on NLP features as well as a comparison of various weighting/sampling techniques to address problems with class imbalance.
• A visual low-dimensional demonstration of why SMOTE performs poorly when com- bined with naive Bayes.
• Statistical methods which compare the importance of different features in NLP- based models at an individual level and across groups of features.
• A dataset1 of approximately 5.2 million posts created by Twitter users who partic- ipated in discussions around the Russian Invasion of Ukraine [158].
• An analysis of the effect which bot activity has on emotions in online discussions around the Russia/Ukraine conflict.
1Dataset available at https://figshare.com/articles/dataset/Tweet_IDs_Botometer_results/
20486910.
• A statistical framework which can be applied to measure how people get influenced in online networks. This framework can be more generally utilised in political cam- paigns, dis/misinformation campaigns or any online advertisement campaign.
Chapter 2 Background
2.1 Motivation
Social media is a rich information environment1 where users share experiences, opinions and ideas in virtual communities and networks. As a result, social media has fundamen- tally changed the way humans consume their information. Online networks like these provide a climate where any sort of information can exist, and the difference between the truth and falsehood is more blurry than ever [108]. While social media allows the world to be more connected than ever, it also has the potential to be misused and abused by a number of different entities. In particular, several companies and governments utilise the rich information environment to manipulate and influence the opinions of people [142, 33, 138, 124, 98]. These entities are motivated by several factors and any form of advertising is always intended to influence opinions [142]. Social media serves as a plat- form for them to manipulate human opinion at large scale, giving them enormous power.
Just imagine if you could convince people that the earth is flat or that your favourite politician should be elected. Social media is an environment where entities can push nar- ratives like these, as misinformation2 and disinformation3 is often more attractive than the truth [162]. We explore the extent to which these companies can influence individuals through two different methods. First, we consider the extent to which users’ personalities can be profiled through their online digital footprint. Then we consider the extent to which bots influenced the online discussion during the Russian invasion of Ukraine.
Personality profiling has been utilised for decades, as humans often want to better un- derstand themselves and how they interact with their environment. Since the introduction of Social Media, personality profiling has played an important role in political campaigns,
1The aggregate of individuals, organizations, and systems that collect, process, disseminate, or act on information.
2Incorrect or misleading information which is not deliberately deceptive.
3False information that is spread deliberately to deceive people.
7
digital marketing and employment [111]. In the past, people have obtained their person- ality profile through undertaking a questionnaire. However, social media has enabled data scientists to model peoples’ personality profiles, giving them the ability to profile users without them even knowing it. Cambridge Analytica (CA) was a British political con- sulting company who utilised personality profiling for what they described as ‘behavioral micro-targeting’ [68]. Former CA employee and now whistleblower, Christopher Wylie, claimed the company was responsible for using personality profiling to influence the re- sult of the 2016 US Election, the 2016 Brexit referendum and many other political events [162]. He said that CA determined users who were neurotic and more subject to being influenced, they then targeted these users with campaigns specific to their personality.
Other authors have questioned and criticised the extent to how accurate CA’s models were [142]. While CA’s operations were closed in 2018, there are still a number of ac- tive entities who are believed to misuse social media data in the same way that CA did [162]. A number of academics have explored the accuracy of predicting peoples’ OCEAN4 personality types, however there has been limited research utilising the Myers-Briggs per- sonality model [12, 144, 143]. Moreover, a majority of these academics have just explored the accuracy of these models, with very limited research which quantitatively evaluates how personality types utilise language differently. As a result, we explore how accurately peoples personality profiles can be modelled through their online digital footprint. We produce a labelled dataset of 43,977 Twitter users, the largest personality labelled Twitter dataset which we know of.
Much of the research concerning bots on social media has involved their detection, with little research measuring their influence [109, 38]. However, with the war in Ukraine being labelled as the ‘first to introduce a new front line – the internet’ by the BBC, the presence and influence of malicious online campaigns has been of interest for many de- fence organisations and governments [155, 83]. The use of bots by Russian authorities has been widely observed: e.g., Collins [33] found 5,000 bots were pushing protests against Russiagate haux, a political event concerning relations between politicians from US and Russia; and Shane [138] suggested Russia created ‘Fake Americans’ to influence the 2016 US election. Moreover, Purtill [124] found that Russia had a massive bot army in spread- ing disinformation about the Russia/Ukraine conflict, and Muscat and Siebert [98] have suggested that both Ukraine and Russia are utilising bot armies in their cyber warfare.
However, the extent to which these bots drive particular discussions and influence the behavior of humans on social media during the Russia/Ukraine conflict is relatively un- explored. We aim to address this question through analysing how bots influence topical discussion during the first two weeks of the Russian invasion of Ukraine. We create our own dataset of 5,203,746 tweets and provide a statistical framework for how the influence of bots can be measured – this is generalisable to any bot campaigns on Twitter.
4A personality model which measures peoples Openness, Conscientiousness, Extroversion, Agreeable- ness and Neuroticism, forming the OCEAN acronym.
2.2. Personality Models 9
2.2 Personality Models
In this section, we discuss two popular personality models; the OCEAN Personality Model and the Myers-Briggs Personality Model. While we primarily utilise the Myers-Briggs personality model in our results, we also overview the OCEAN personality model as it is used in a majority of the past literature. The OCEAN personality model also has considerable links with the Myers-Briggs model (see Table 2.4) and serves as a good introduction to the Myers-Briggs model. In this Section, we present the psychological framework of both models and consider their development/history. Moreover, we discuss their application and consider their limitations.
2.2.1 OCEAN Personality Model
The OCEAN personality model (sometimes referred to as the Big 5 personality model) is a taxonomy/grouping for personality traits which was created in 1949 by Donald Fiske.
The initial model was not popular among academics and was consequently expanded upon by a number of independent researchers including Norman (1967), Smith (1967), Goldberg (1981), McCrae/Costa (1987) and Digman (1990) [150, 43]. The model then began gaining popularity in the 1980’s due to the advances by Goldberg and Digman [61]. This model is fundamentally based upon a dataset created by Gordon Allport and Henry Odbert in 1936, where they connected around 4,500 verbal descriptors to certain personality traits [154]. The data was created by scrupulously examining words from the 1925 edition of Webster’s New International Dictionary and categorizing all words that appear to refer to human traits [75]. The relationship between the verbal descriptors and the personality traits in the dataset was significantly reduced through utilising factor analysis. In the 1940’s, Raymond Cattell and his colleagues narrowed down Allport and Odbert’s dataset down to sixteen personality traits. However, numerous independent psychologists including Norman, Smith, Goldberg and McCrae/Costa all found these psychological traits could be further reduced to five main traits [31]. These five main traits then formed a basis for what we know refer to as the OCEAN (or Big 5) personality model. As a result, the OCEAN personality model is a five factor model of personality.
While Norman, Smith, Goldberg and McCrae/Costa all found there to be five dom- inant traits, they did not necessarily agree on the definitions or names for these traits.
However, all traits associated with each of these five dimensions of personality have been found to be factor-analytically aligned and highly inter-correlated [27, 2]. The most accepted labels for these five personality traits are: Openness, Conscientiousness, Ex- traversion, Agreeableness and Neuroticism. The model gets its name by taking the first letter of each of these traits to form the acronym OCEAN. Firstly, Openness (or openness to experience) is a general appreciation for adventure, art, unusual ideas, curiosity and variety of experience. People with high openness are more open new new experiences, are more creative and are more aware of their feelings [5]. Conscientiousness is the preference
to act dutifully, display self-discipline and strive for achievement. People with high con- scientiousness are often prepared, pay attention to details and like order in their lives [35].
Extroversion is classified as a pronounced engagement with the external world. People who are more extroverted are more likely to be the life of the party, feel more comfortable around people and like being the centre of attention [35]. The agreeableness trait aims to reflect differences in general concerns for social harmony. People who are more agreeable are more interested in people, sympathize with others’ feelings and take time out for oth- ers [131]. Finally, Neuroticism is the tendency to experience negative emotions such as anxiety, depression or anger. People who are more neurotic are more likely to be emotion- ally unstable, get irritated more easily and frequently worry about things [35]. Each of these five traits are represented on a numerical scale with scores usually being normalized between zero and one hundred [154]. Figure 2.1 describes the OCEAN personality model and gives an overview of what cognitive processes each of these traits encapsulate.
Figure 2.1: Personality types in the OCEAN personality model [64].
A method which would target each of these personality traits was subsequently re- quired once researchers in this area had discovered the presence of the five personality traits. Measuring the five OCEAN personality traits is predominately done through the
2.2. Personality Models 11 use of self-report questionnaires [47]. The most frequently used measures of these per- sonality traits utilise self-descriptive sentences, however some short forms of the test have been developed when respondent times are limited [149]. While self-report questionnaires are the primary tool used in most personality models, they are always subject to confir- mation bias and the Barnom Effect. Note that the Barnom Effect is where people give a high rating to a positive description that supposedly apply specifically to them [116].
Some examples of websites providing the Big 5 Personality Test are: www.truity.com, www.openpsychometrics.org and www.bigfive-test.com. These tests use a combina- tion of questions which are positively correlated with the targeted trait and negatively correlated with the targeted trait. For example, in the case of extroversion, some of the self-descriptive sentences would target the extroverted trait and some self-descriptive sentences would target the introverted trait (we call these reversed statements). The self- descriptive sentences which are present in most OCEAN personality tests can be viewed in [97].
The OCEAN personality model has numerous applications in education, employment, romantic relationships, political identification and religiosity. One major study showed that GPA/exam performance are highly correlated with conscientiousness and academic success is negatively correlated with neuroticism [86]. Another study found that the open- ness personality trait had a positive relationship with academic achievement in a distant setting – something that would have played a crucial role during the Covid-19 pandemic [152]. In regards to an employment setting, one study found that: openness is positively correlated with higher proactivity at individual and organizational levels, agreeableness is negatively correlated with individual task proactivity, extroversion is negatively corre- lated to individual task proficiency, conscientiousness is positively correlated to all forms of work performance and neuroticism is negatively correlated with all forms of work per- formance [78]. Another study aimed to understand how each of the OCEAN personality traits impacted relationship quality in dating, engaged and married couples. The authors found that openness, agreeableness and conscientiousness were all positively correlated with relationship quality in engaged couples. In dating couples, neurotic characteristics were negatively correlated with relationship quality, whereas neuroticism was positively correlated with relationship quality in married couples [69]. In a political setting, a study found that individuals who score higher in neuroticism are more likely to have right-wing political affiliations [56]. As a result, it is apparent that the OCEAN personality model has applications in a wide variety of settings and can give a variety of insights about a person.
While the OCEAN personality model has had considerable impact in academia, the model has still been subject to a large amount of scrutiny from published studies. Some authors have used the terms ‘psychology of the stranger’ or a ‘cloudy measurement’ to describe the OCEAN model [94, 51]. The first of which is referring to the suggestions that the model only discovers traits that are easy to observe in a stranger [94]. Further to this,
other authors have suggested the OCEAN personality inventory only accounts for 56% of the normal personality trait sphere (without considering the abnormal personality trait sphere) [21]. Another criticism of the OCEAN model is that it has limited scope; some researchers have suggested that it neglects other aspects of personality such as honesty, religiosity, thriftiness and others [112]. It has further been shown that the five factors in the model are not completely independent and rather measure human aspects which are inter-related [99]. Arguably the biggest criticism of the OCEAN personality model is that it’s not based on any underlying psychological theory. It is merely an empirical finding which came from using factor analysis as a dimension reduction on a large dataset [17]. Block (2010) suggested the model uses factor analysis as an exclusive paradigm for conceptualising personality and reinforces that there is limited psychological theory which backs these findings [17, 21]. In Section 2.2.2 we discuss the Myers-Briggs Personality Model which is a theory driven model, rather than a statistically driven model.
2.2.2 Myers-Briggs Personality Model
The Myers-Briggs personality model was constructed by an American personality re- searcher, Katharine Cook Briggs and her daughter Isabel Briggs Myers [18]. It is recog- nised as the most well-known personality model due to its application to hiring processes, social dynamics, education and relationships [40, 156, 88]. However, the model has re- ceived a large amount of scrutiny, particularly from psychologists who question its validity and reliability [116, 63]. We discuss a number of these limitations in the latter parts of this section and provide evidence of why the model is useful in the context of social media research.
Briggs began researching personality in 1917 as she noticed clear differences in the per- sonalities of individuals in her family [147]. As a result, Briggs and Myers both thoroughly studied the work of famous psychiatrist and psychoanalyst, Carl Jung. In particular, his English translated publication of ‘Psychological Types’ in 1923 [101]. Briggs and Myers endeavored to create practical use from the theory of personality types and consequently began formulating and testing the Myers-Briggs Type Indicator (MBTI) during the second world war [146]. Their aim was to identify the most comfortable and effective war-time jobs for women entering the industrial workforce for the first time [101]. The MBTI Handbook was then published in 1956 with second and third editions of the handbook being published in 1985 and 1998, respectively [100].
A majority of the MBTI handbook is based upon the theory proposed by Carl Jung;
who speculated that humans experience the world through two dichotomous pairs of cogni- tive functions. Firstly, the rational/judging functions (thinking and feeling) and secondly the irrational/perceiving functions (sensation and intuition) [79, 73]. Jung proposed that humans use one of these four functions more primarily and dominantly than the other three; however, all four functions can be used at different times depending on the cir- cumstances [101]. Moreover, Jung believed that each of these functions are expressed
2.2. Personality Models 13 primarily in either an extroverted or introverted form [101]. Jung also suggested there was a conscious and unconscious combination of these functions [52]. In Jung’s theory of psychological types, he used the terms dominant, auxiliary and inferior, where there is one dominant function, two auxiliary functions and one inferior function. The primary func- tion is the most developed, differentiated and conscious function. Whereas the auxiliary functions are capable of more significant development or differentiation and help support the primary function [79]. The inferior function behaves more unconsciously and is al- ways the opposite of the dominant function [101]. Additionally, Jung also introduces the concepts of a general attitude and a rationality. The general attitude categorises whether someone is extroverted/introverted and the rationality describes the preference for the pri- mary functions, where thinking/feeling has a judging rationality and sensation/intuition has a perceiving rationality. Table 2.1 represents a summary of Jung’s conception of the conscious personality types based on someones general attitude, rationality and their two dichotomous pairs of cognitive functions. Note that the unconscious combinations of the cognitive functions are omitted from Table 2.1 for brevity.
General Attitude Rationality Primary Auxiliary Inferior
Extroverted
Judging
Thinking Sensation Intuition Feeling Thinking Intuition Sensation Feeling Feeling Sensation Intuition Thinking Feeling Intuition Sensation Thinking Perceiving
Sensation Thinking Feeling Intuition Sensation Feeling Thinking Intuition Intuition Thinking Feeling Sensation Intuition Feeling Thinking Sensation
Introverted
Judging
Thinking Sensation Intuition Feeling Thinking Intuition Sensation Feeling Feeling Sensation Intuition Thinking Feeling Intuition Sensation Thinking Perceiving
Sensation Thinking Feeling Intuition Sensation Feeling Thinking Intuition Intuition Thinking Feeling Sensation Intuition Feeling Thinking Sensation Table 2.1: Jungian model of conscious personality types.
The MBTI handbook utilises the general attitude function, the rationality function, the primary function and the first auxiliary function in Table 2.1 to form 16 unique per- sonality types. The MBTI handbook represents these four cognitive functions through four dichotomous attitudes or functioning styles: Extroversion/Introversion (E/I), Intu-
itive/Sensory (N/S), Thinking/Feeling (T/F) and Judging/Perceiving (J/P). The first of which aims to describe how we interact with our environment; the preference to focus on the outer-world (extroverted) or your own inner-world (introverted). The second di- chotomy aims to describe how people interpret information; the preference to interpret basic information and add meaning (intuitive) or to just focus on observed basic informa- tion (sensory). The third dichotomy aims to describe how people make decisions; to first consider logic and consistency (thinking) or to first consider people and special circum- stances (feeling). Finally, the last dichotomy aims to describe structure; the preference to get things decided when dealing with the outside world (judging) or to stay open to new information and options (perceiving) [102]. As a result, the MBTI handbook illustrates a four factor model of personality where people attain one attribute from each of the four dichotomies; forming their ‘personality type’. This results in 16 different personality types where a letter from each dichotomy is taken to produce a four letter acronym such as ‘ENTJ’ or ‘ISFP’. Each of the 16 different personality types are provided in Figure 2.2 where the same background colour denotes mutual primary functions, the same text for the four letter acronyms denotes mutual auxiliary functions and the same black/white text denotes mutual general attitude functions. When designing the MBTI handbook, Briggs and Myers aimed to address two related goals: the identification of basic preferences of each of the four dichotomies which are implicit in Jung’s theory and the identification and description of the 16 distinctive personality types that result from the interactions among the preferences [145].
Formulating a relevant and robust personality test was a large and important aspect of the MBTI handbook. Briggs and Myers designed an introspective self-report questionnaire where the responses to the questionnaire are used to determine someones personality type [101, 145, 103]. The questions which form the basis of the MBTI can be found in [146].
There are several websites providing online Myers-Briggs personality tests includingwww.
16personalities.com, www.mbtionline.com and www.truity.com. It is also possible to find a certified MBTI professional to administer the test for you via the official Myers- Briggs website: www.myersbriggs.org. When undertaking the test, participants earn point scores for each dichotomy based on their responses to the questionnaire and the leaning of their final score determines their preference for that dichotomy. For instance, a user who scores higher for extroverted compared with introverted would be classified as an extrovert. Some websites providing a Myers-Briggs personality test also add a degree to how strong the preference is for each dichotomy. However, Briggs and Myers always considered the direction of the preference to be more important than the degree/strength of the preference. This is because a higher degree does not necessarily mean someone displays stronger characteristics for that attribute; rather they simply have a clearer preference for it [123].
While Briggs and Myers did utilise much of Jung’s theory, there are some clear dif- ferences between the MBTI and the Jungian model. The most notable difference from
2.2. Personality Models 15
Figure 2.2: Personality types in the Myers-Briggs Type Indicator [128].
Jung’s original thoughts is the concept that people only exhibit the conscious personality types, reducing the number of unique personality types from 32 to 16. Some researchers suggest that admitting the unconscious personality types is careless and “hardly fair to Jung” [52]. However, Briggs and Myers suggest that everyone has a conscious personality type, with some being more conscious than others. It is also apparent that the latter part of Jung’s theory did not involve questionnaire measurement [25]. Moreover, Briggs and Myers introduce a fourth aspect to their model which is not present in the Jungian model:
that people also have a preference for using either the judging function or the perceiv- ing function. According to Myers, the judging/perceiving dimension aims to capitulate peoples preference to “have matters settled” (judging) or consider new options (perceiv- ing) [101]. Another clear distinction from Jung’s theory is that Briggs and Myers saw
the dichotomies as dualistic: people have a clear preference for each category. Whereas, Jung saw the dichotomies as tendencies: humans have both and people can be balanced [10, 79]. This is consistent with why Jung’s theory was surrounding personality types and not personality tests; Jung’s theory was not designed to be applied in the ways it has now [80]. In any case, it is important to note that both models remain hypothetical, with no controlled scientific studies supporting Jung’s original concept of personality types or the Myers-Briggs variation of this [25].
Many psychologists have scrutinised personality tests since their more frequent usage in the hiring processes of a number of workplaces. These practitioners question whether personality tests ‘really capture who you are’ and there is growing suspicions that humans may be growing tendencies to enjoy dividing people into categories [159, 13]. Nonetheless, it is apparent that the use of self-report questionnaires rest on several assumptions. The underlying assumption of the MBTI is that we all have specific preferences in the way we construe our experiences, and these preferences underlie our interests, needs, values, and motivation [115]. We also assume that there are general cognitive systems which can be expressed in terms of numerical scores on a measured scale. We assume these systems can be quantitatively evaluated by totaling the responses which lie in the same personality dimension. If there is a correlation between someones response on a questionnaire and that personality dimension, then we assume these attributions must be linked; introducing the potential of confirmation bias [153]. Smit (1983) proposed a number of requirements for these self-report questionnaires to be practical. These requirements are: the test must be comprehensive without being too time consuming, the test needs to be standardized for a specific population, test instructions should be clear, and the psychometric qualities of the test should yield reliable and valid results [122].
The MBTI instrument’s validity has been subject to much criticism since its pub- lication in 1956. Some sources have called the test ‘pretty much meaningless’ and the
‘fad that won’t die’ [91, 63]. One primary concern of many researchers is the very little evidence for the dichotomies. As it was previously mentioned, Briggs and Myers always considered the direction of the preference to be more important than the degree/strength of the preference [123]. Hence, scores on each of the four MBTI dimensions should follow a bimodal distribution with a higher proportion of people scoring towards the end of each tail. However, a majority of studies have shown that the distribution of scores for each dimension is fairly bell shaped [14]. This indicates that a majority of people portray more balanced characteristics for each of the four dimensions, a result consistent with Jung’s theory: that the dichotomies are more like tendencies: humans have both and people can be balanced [10, 79]. Hence, researchers believe it may be more appropriate to report scales along each of the four distributions rather than using a cutoff value to form the dichotomies [116, 95].
Other research has found that the validity and utility of the MBTI is problematic. In 1991, The United States National Academy of Sciences committee reviewed data from the
2.2. Personality Models 17 MBTI and found that on the extrovert/introvert dichotomy had high correlations with comparable scales of other personality inventories. Moreover, the intuitive/sensory and thinking/feeling dichotomies showed weak correlations with comparable scales and as a result, the committee concluded there was “not sufficient, well-designed research to justify the use of the MBTI in career counseling programs”. Note that the study formulated its measurement of validity based on “whether the MBTI predicts specific outcomes related to interpersonal relations or career success/job performance” [107].
The accuracy of the MBTI fundamentally depends on the honesty of participants self-reporting. While this may seem like an issue in most self-reporting personality ques- tionnaires, it is possible to reduce these effects by utilising validity scales to assess if exaggerated or socially desirable responses are present [7]. This also significantly reduces the likelihood of confirmation bias in the results. Personality tests such as the 16PF Ques- tionnaire and the Minnesota Multiphasic Personality Inventory make use of these validity scales. However, the MBTI does not use validity scales and as a result, fundamentally relies on honest self-reporting. One study used the Eysenck Personality Questionnaire lie scale to determine how socially desirable people were being in their responses to the ques- tionnaire. The study found there to be a weak correlation between the judging/perceiving dichotomy and the lie scale; indicating a small proportion of people are likely to be lying in their responses relating to the judging/perceiving category [54].
The reliability of the MBTI tends to be questioned by some researchers. According to Briggs and Myers, your personality type is inborn and doesn’t change. However, a considerable number of people have obtained different personality types when retaking the questionnaire within months [116, 63]. One study found that about 50% of people obtain the same overall type when retested within 9 months and around 36% of people obtain the same overall type when retested after 9 months [24]. As a result, researchers have q
![Figure 2.1: Personality types in the OCEAN personality model [64].](https://thumb-ap.123doks.com/thumbv2/5docco/11925409.0/30.892.211.638.451.900/figure-2-personality-types-ocean-personality-model-64.webp)
![Figure 2.2: Personality types in the Myers-Briggs Type Indicator [128].](https://thumb-ap.123doks.com/thumbv2/5docco/11925409.0/35.892.201.736.164.691/figure-personality-types-myers-briggs-type-indicator-128.webp)