The three South Island council leaders (Tasman District Council, Nelson City Council and Marlborough District Council) need an overview of available information on the state of the marine environment in both the Tasman and Golden Bays. Most of the available information was not collected for the purposes of the state of.
INTRODUCTION
Report scope and objectives
The purpose of this report is to provide a summary of the conditions in the bays based on the available information relevant to the assessment of the state of the environment. Accordingly, we want to assess the extent to which information about the state of the environment can be obtained from datasets collected for other purposes.
MEASURING THE STATE OF THE MARINE ENVIRONMENT
Information needs
The Regional Council (WRC) (Forrest & Cornelisen 2015 and related reports) also contains information relevant to the development of SoE monitoring targets. The WRC project targets the place of aquaculture within an SoE framework; nevertheless, much information about the development of indicators is relevant for coastal management nationally.
Council obligations
- New Zealand Coastal Policy Statement
- Environmental Reporting Bill
Some general considerations on how surveillance can be integrated between consent and state of the environment (SoE) are considered in Newcombe & Cornelisen (2014). 8 Māori knowledge — the body of knowledge derived from Māori ancestors, including Māori worldviews and perspectives, Māori creativity and cultural practices.
COASTAL CATCHMENTS AND ESTUARIES
Land cover
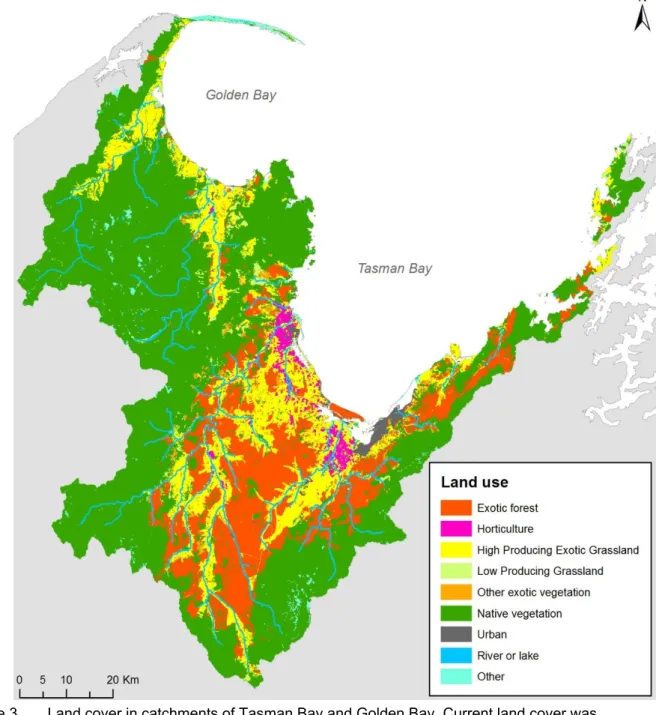
Land cover in the Tasman Bay and Golden Bay catchments is dominated by natural vegetation in the upper catchments with significant grasslands (high and low producing grasslands) near the coast and bordering the rivers in the central catchment (Figure 3). Current land cover was mapped within the study area using the New Zealand Land Cover Database (LCDB) version 4, which provides an estimate of land cover derived from satellite imagery.
Freshwater
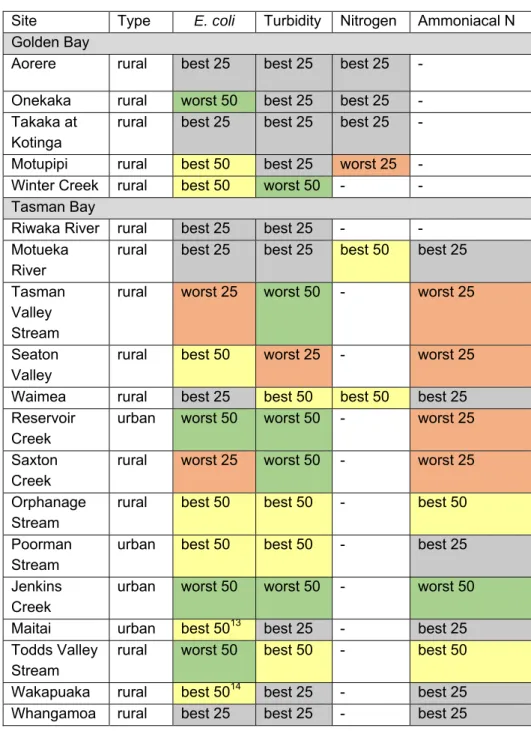
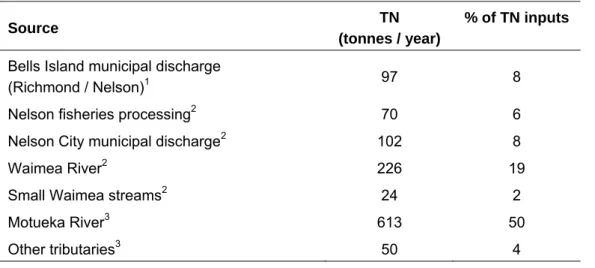
As presented on the Land and Water Aotearoa (LAWA) website, streams in the Tasman Bay and Golden Bay catchments show a wide range of water quality values for all these parameters (Table 1). The site closest to the coast in each catchment was chosen from the Land and Water Aotearoa (LAWA) website (www.lawa.org.nz).
Estuaries
- Issues confronting estuaries in Tasman Bay and Golden Bay
- State of estuarine environmental monitoring
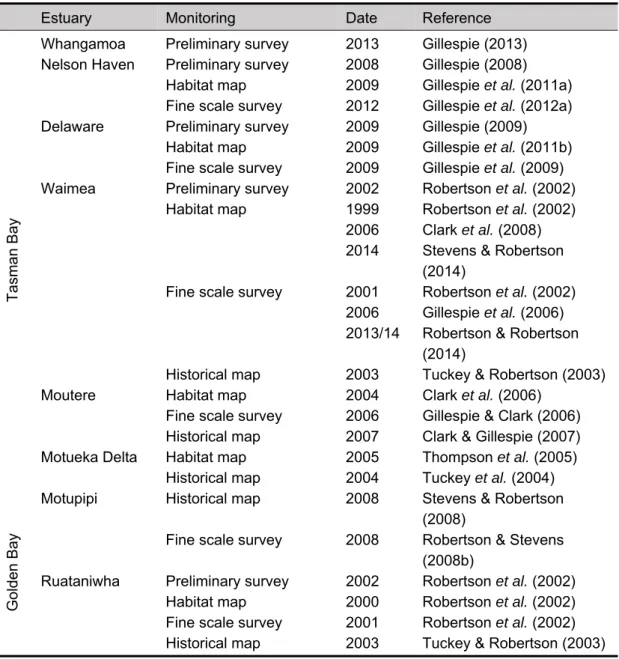
The main issues for Tasman Bay and Golden Bay estuaries arise from increased erosional inputs of fine-grained suspended sediments from surrounding catchments. The accompanying monitoring reports (Table 2) show that Tasman Bay and Gold Bay estuaries have been modified to varying degrees by human activities.
COASTAL ACTIVITIES AND DATA COLLECTION IN TASMAN BAY AND GOLDEN
- Fishing
- Port-related activity
- Port Nelson channel dredging
- Biosecurity surveys
- Outfalls
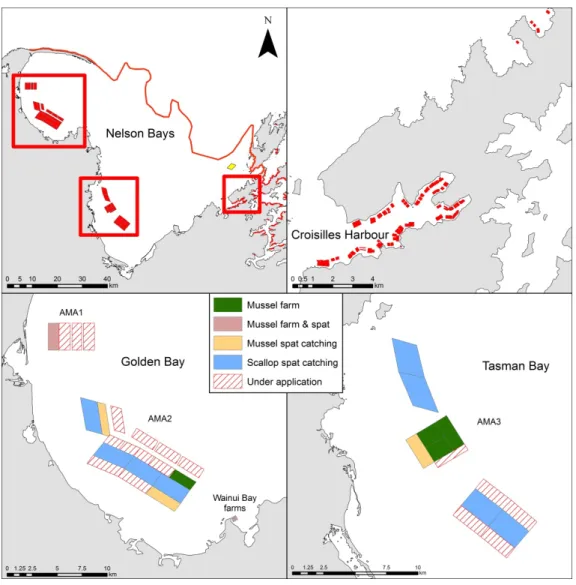
- Aquaculture
- Other environmental data
- TASCAM
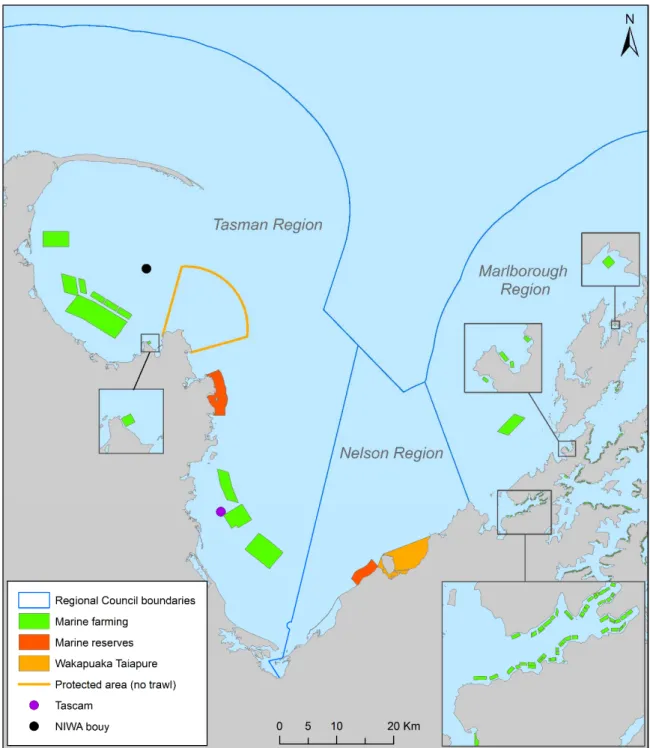
- Protected areas
- Other research activity
- Cultural monitoring
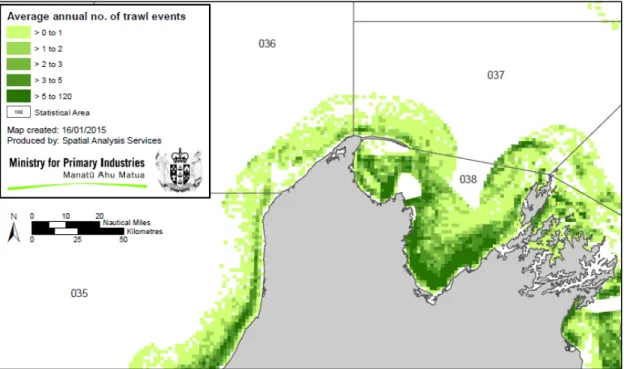
The physical effects of dredging and trawling have been shown to reduce the density of general macrofauna populations (Thrush et al. 1995) and to reduce populations of important bioturbators, with implications for the ability of the seabed to absorb and release nutrients. Dredging for oysters has also continued in recent years, although the fishery has produced less than 1% of the biomass of the scallop fishery. The Marlborough Shellfish Quality Program (MSQP) program makes weekly measurements of phytoplankton composition / biomass and shellfish toxicity, related to shellfish growing areas in the top of the south.
The red line shows the sea boundary for the case study region of the Marine Ecosystem Services research project, which is the 50 m isobath. Here we limit consideration to topics where information collection can contribute to environmental state information. Other protected area research has also occurred, such as habitat mapping of soft sediment areas in the Tonga Island reserve (Thrush et al. 2003) and a study of the bryozoan communities at Separation Point (Grange et al. 2003).
One of the first studies of the benthic environment was a national study that classified benthic communities (McKnight 1969). Existing ecological knowledge about the environment is combined and evaluated in relation to the ecosystem services provided.
REVIEW OF ENVIRONMENTAL CONDITIONS BASED ON EXISTING DATA SETS
Water column
- Water column primary productivity
- Sediment in the water column
- Watercolumn faecal contamination
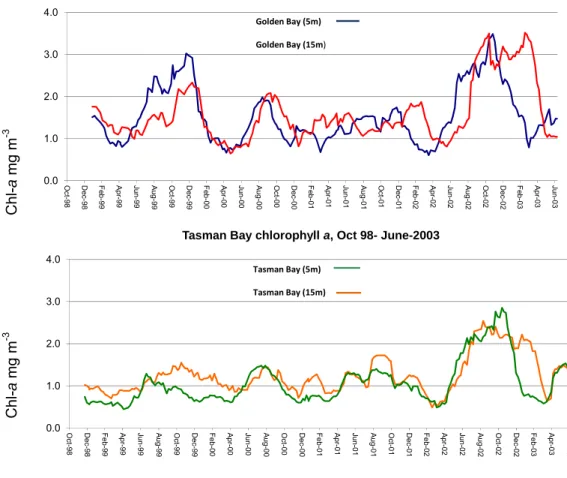
The vast majority of work on the water column in Tasman Bay and Gold Bay has taken place as part of research projects. The most important limiting nutrient (ie the nutrient that limits plant growth) in Tasman Bay and Golden Bay is nitrogen, in the form of dissolved inorganic nitrogen (DIN). An unknown but possibly significant proportion of inorganic nitrogen is lost from Tasman Bay and Golden Bay via denitrification in the water column (Zeldis 2008;.
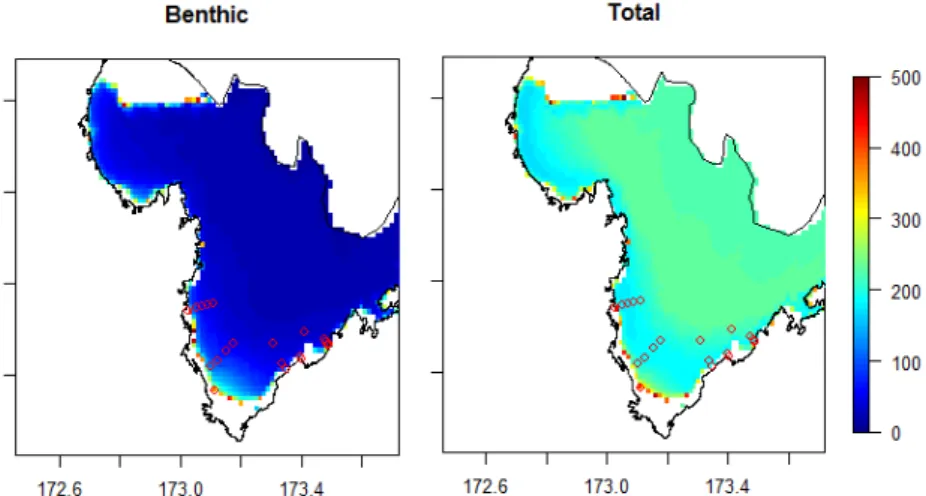
Phytoplankton are the most important primary producers within the Tasman Bay and Golden Bay ecosystem. Phytoplankton productivity in the nearshore (< 30m) regions of the Tasman Bay and Golden Bay is profoundly influenced by river inflows that provide essential inorganic nutrients. Primary productivity has been estimated over Tasman Bay and Golden Bay (Gillespie et al. in press).
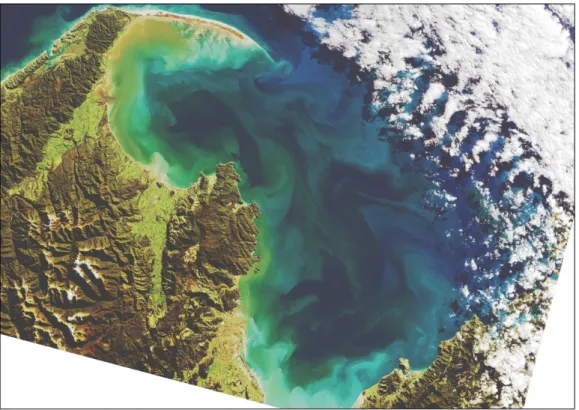
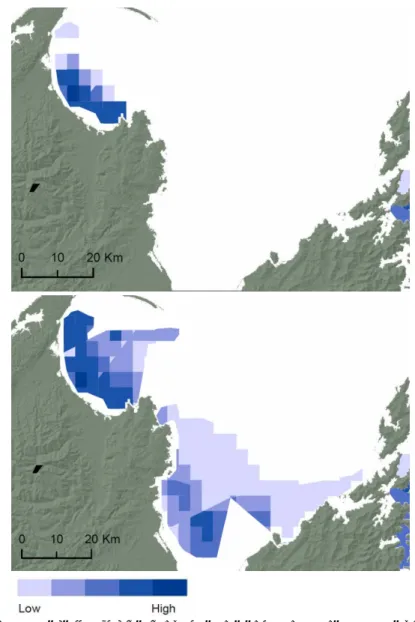
Spatial distribution of estimated planktonic and total primary production in Tasman Bay and Golden Bay (averaged using light intensities derived for 2009–2012 from the MODIS dataset). Observations, satellite imagery, consent monitoring data and TASCAM data show highly variable turbidity in Tasman Bay and Golden Bay.
Seabed
- Benthic primary productivity
- Soft sediment habitat and communities
- Biogenic habitat
- Rocky reefs
- Chemical contamination in the seabed
Therefore, the phytoplankton in the water column and benthic microalgae on the seafloor make up the majority of primary productivity in Tasman and Golden Bays. Sediment deposition (sedimentation) and disturbance of existing sediment structure (degradation of habitat integrity) are both important factors in the functioning of soft sediment communities. The significant reduction in biogenic habitats that has occurred in Tasman Bay and Golden Bay over the last century or more (Handley 2006) is recognized as a significant reduction in the habitat integrity of the benthic marine environment.
Large banks or reefs of oysters and clams were historically present in Tasman Bay and Golden Bay, but these were largely destroyed by bottom trawling in the last century. Separation Point has one of the most representative horse mussel beds in the Nelson/Marlborough region (Davidson 1992). A large (22 ha) bed is found near D'Urville Island (Coppermine and Ponganui Bays) (Davidson et al. 2011b). This is the largest known rhodolite bed in the United States.
The deepest and most extensive rocky reefs in the region occur in the northeast of Tasman Bay in the MDC CMA (Davidson et al. 2011b). A 50 km2 footprint associated with the Motueka River plume has been documented by monitoring the levels of chromium and nickel in the marine sediments (Forrest et al. 2007).
Fisheries
- Shellfish
- Snapper
- Marine reserves
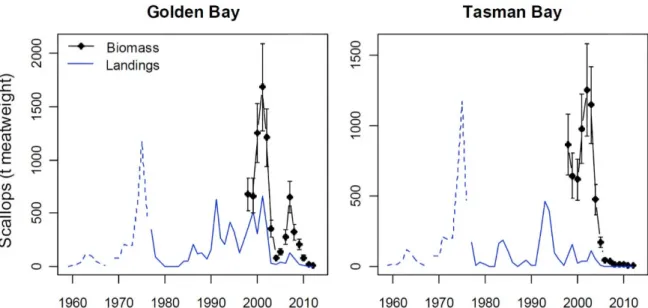
Landings have only been reported separately for Tasman Bay and Golden Bay since 1977; earlier landing data is represented by a dashed line. Research has also shown that the genetic diversity of snapper has changed over time as snapper numbers have declined in Tasman Bay (Smith et al. 2003). The fish and invertebrate species highly valued by recreational and commercial fishermen are the focus of marine reserve monitoring in the Tasman Bay reserves.
In the Tonga Island Marine Reserve (established in 1993), after 13 years of monitoring, there was an increase in the number of large blue cod visible in the reserve. Fish were 40 times more abundant in the reserve than at control sites, although no change was seen in sublegal size cod. In the Hororoirangi Marine Reserve (established in 2006), sublegal size blue cod increased in reserve and non-reserve areas, while larger cod only increased in the reserve.
An increase in kina density was seen outside the Tonga Island reserve while density decreased within the reserve (Davidson & Richards 2013). Marine reserve monitoring data similarly indicate that fishing pressure significantly affects some species, and some suggestions of food web impacts have also been identified.
Biosecurity/invasive species
These data provide good evidence that protection from fishing pressure has significantly improved these valuable species. Scallop abundance was quite variable within the Hororoirangi Marine Reserve, but relatively stable outside; there was no clear difference in overall abundance (Davidson & Richards 2013). This indicates that some food web effects are also occurring; the increase in predatory fish is likely to reduce the abundance of herbivores, which in turn may lead to an increase in habitat-forming seaweeds.
The population appears to be small (maximum of one or two individuals detected per survey) and confined to the marina and slipways. There is a continuing threat of the introduction of new NIS into Tasman and Golden Bays from abroad and from other parts of New Zealand. Management of NIS threats to the economic, cultural and environmental well-being of the region is now coordinated between local councils, MPI and other stakeholders through the Top of the South Marine Biosecurity Partnership36.
The partnership is a collaborative approach to biosecurity management in the CMAs of TDC, NCC and MDC. As well as the councils, the partnership includes MPI, DOC, the aquaculture industry, port companies, tangata whenua and other stakeholders.
STATE OF THE ENVIRONMENT IN TASMAN AND GOLDEN BAYS
SoE assessment from available information
Gaps analysis for assessment of the state of the marine environment
Most of the available information on the outer coastal environment of Tasman Bay and Golden Bay has not been collected to measure the state of the environment. Many of the issues outlined above (Section 6.1) are interrelated, and interactions between different components of the ecosystem must be taken into account when assessing the state of the environment. For example, changes in temperature will affect the stratification dynamics of the water column, affecting primary productivity.
Ocean acidification is also expected to affect the production of calcified structures such as bivalve shells, thereby contributing to impacts on biogenic habitat formation, as well as other impacts on commercially and ecologically important species. Alignment (or an eye on future alignment) with other councils, and national strategies such as MfE reporting requirements. In the current version, the bay is divided into 25 areas defined by factors such as substrate type, water temperature and fishing intensity.
The model is still under development and more data types, such as details of fishing activity and gear, could be added to improve the relevance and predictive power of the model. In theory, the Atlantis model could be used to assess the effects of management changes, such as protection from fishing activity across different areas of the bays, or to predict the effects of climate change.
Spatial determination of the depositional footprint of the Motueka River plume in Tasman Bay, New Zealand. Sustainable aquaculture in New Zealand: Review of the ecological effects of shellfish and other non-finfish farming. River inputs, re-mineralization and spatial and temporal distribution of inorganic nutrients in Tasman Bay, New Zealand.
Working draft prepared for iwi and stakeholders for the Rebuild Shellfish Fisheries Workshop, 15 August, Nelson.