J. Compos. Sci. 2022, 6, x. https://doi.org/10.3390/xxxxx www.mdpi.com/journal/jcs
Type of the Paper (Article, Review, Communication, etc.) 1
Assessment of the Potential of Waste Copper Chromium and
2Arsenic Treated Timber Fibre Reinforced Polypropylene Com-
3posites for Construction
4Jacob Nelson 1, Kim. L Pickering 2 and M.D.H Beg 3* 5
1 School of Engineering, University of Waikato, Private Bag-3105, Hamilton, New Zealand 6
2 School of Engineering, University of Waikato, Private Bag-3105, Hamilton, New Zealand 7
3 School of Engineering, University of Waikato, Private Bag-3105, Hamilton, New Zealand 8
*Correspondence: [email protected] 9
Abstract: This paper investigates the potential of recycling waste copper chromium and arsenic 10 (CCA) treated timber for use as a reinforcement material in wood-plastic composites (WPCs) pro- 11 duced for use in construction including an assessment of mechanical properties and leaching of 12 heavy metals. Wood flour was obtained through mechanical grinding, and fibres were obtained 13 through alkaline digestion followed by bleaching. Composites produced with 40 wt.% bleached fi- 14 bres showed increased tensile strength from 18.5 MPa for the polypropylene used as the matrix to 15 27.6 MPa. Likewise, the Young's modulus was increased from 0.84 GPa to 2.33 GPa. The treatment 16 of fibres was found to reduce arsenic concentration up to 99.9 %. Furthermore, the arsenic in the 17 leachate from composites was found to decrease from 41.29 to 0.07 ppb when comparing CCA 18 treated wood flour composites to bleached fibre composites. The composites material properties 19 indicate that the use of end-of-life CCA treated timber could be used to produce a composite mate- 20 rial that could be used in New Zealand’s building sector to meet the requirements of semi-structural 21
applications. 22
Keywords: CCA treated timber, Wood plastic composites, Creep, Leaching 23 24
1. Introduction 25
The construction sector is expected to contribute 40 – 50 % of the waste produced in 26 New Zealand [1]. Transitioning to a circular economy could see the use of waste materials 27 from the construction sector as raw materials for new construction. This would help re- 28 duce reliance on virgin materials, eliminate waste streams, and reduce emissions emanat- 29 ing from extraction and processing of new materials for construction [2]. 30 Copper, chromium, and arsenic (CCA) treated timbers are used extensively in the 31 construction sector in New Zealand due to its high resistance to insects, fungi and water 32 damage caused by the addition of preservatives [3]. In 2006 it was reported that CCA- 33 treated timber was the most produced treated timber in New Zealand, making up an es- 34 timated 69 % (by volume) of the treated timber in New Zealand [4]. However, in the cur- 35 rent state of the construction sector in New Zealand, CCA-treated timber is typically sent 36 to landfill due to issues with leaching in clean fill, and the potential for emissions of toxic 37 vapours to the atmosphere during incineration [5, 6]. The use of CCA-treated timber as a 38 raw material for wood-plastic composite (WPC) would allow for a product to be created 39 directly from waste material from construction, to be used back in the construction sector. 40 Furthermore, WPC has shown the potential to be reprocessed with minimal loss in me- 41 chanical properties [7]. This indicates that it could be recycled and kept within the indus- 42 try for long periods of time and providing the potential to shift the current waste of CCA- 43
treated timber to being reused circularly. 44
Citation: To be added by editorial staff during production.
Academic Editor: Firstname Last- name
Received: date Accepted: date Published: date
Publisher’s Note: MDPI stays neu- tral with regard to jurisdictional claims in published maps and institu- tional affiliations.
Copyright: © 2022 by the authors.
Submitted for possible open access publication under the terms and con- ditions of the Creative Commons At- tribution (CC BY) license (https://cre- ativecommons.org/licenses/by/4.0/).
Previous studies on waste CCA treated timber as a reinforcement material for WPC 45 have found limitations, primarily due to the environmental and health concerns of the 46 heavy metals within the timber and corresponding composites [8-10]. However, these 47 studies have primarily focused on using wood flour. This necessitated the use of chemical 48 methods, rather than mechanical processing, to reduce heavy metal content and possibly 49 obtain better reinforcement that would allow the material to be used in high value appli- 50
cations. 51
Earlier work has supported that the mechanical performance of WPC produced with 52 CCA treated timber can be better than that of WPC produced with virgin pine. Further- 53 more, heavy metals were found to increase the hydrophobicity of the timber and increase 54 thermal dispersion during processing. This increases the flow of the thermoplastic, 55 thereby providing better encapsulation, which results in improved interfacial strength 56 and mechanical performance. Resistance to biological decay was also found to increase 57 when compared to using virgin timber as a reinforcement material in WPC. However, 58 leaching of arsenic from the WPC was found to be substantially higher than the maximum 59 allowable value (MAV) of 10 ppb in drinking water [9, 10]. Kamdem et al. found that the 60 leaching became stable after 400 hours and was negligible after 1000 hours, and the con- 61 centration of As in the leachate reached 12 ppm. The use of Polypropylene Maleic Anhy- 62 dride Copolymer (MAPP) as a coupling agent in composites was found to reduce the con- 63 centration of As leached from 1.5 to 0.5 ppm; however, leachate levels were still much 64
higher than the MAV in drinking water [10]. 65
More recently, researchers have investigated the reinforcement of polypropylene 66 with fibres obtained from CCA treated timber through alkali chemical treatments. Their 67 study found that tensile strength of 29 MPa and Young's modulus of 2.5 GPa were attain- 68 able with 30 wt% fibre. The research suggested that the fibres obtained from the treated 69 timber resulted in less moisture absorption of corresponding composites than virgin tim- 70 ber fibre composites [8]. However, the study did not investigate the effects of the chemical 71 treatment on the fibres' heavy metal content or the composites' leaching potential. 72 Alkali processes are commonly used in the pulp and paper industry to extract fibres 73 from timber. Alkali treatments are also commonly performed to remove lignin, hemicel- 74 lulose, and extractives and increase surface area and roughness to improve interfacial 75 strength. For natural fibre composites, the use of alkali treatments has been widely re- 76 ported to improve interfacial strength, tensile strength, Young's modulus, failure strain, 77 impact strength, fracture toughness, and flexural properties of natural fibre compo- 78 sites [11]. Literature on the alkaline treatment of CCA treated timber for use in composites 79 is minimal and optimising the process would likely further improve the mechanical per- 80 formance of composites [8]. The literature also failed to evaluate the effects of treatment 81 on the heavy metals within the timber, and the possibility of leaching from the composites. 82 Hydrogen peroxide bleaching is a commonly used step in the bleaching of pulp and 83 is considered an environmentally friendly solution as it reduces the number of chlorine- 84 based chemical bleaching processes used [12]. Hydrogen peroxide bleaching of fibre has 85 also been shown to improve composite performance. A recent study found an increase in 86 kenaf fibre and Poly(lactic acid) (PLA) composite tensile strength from 38.5 to 42.9 MPa 87 (with 10 wt% fibre) when the fibres were treated using hydrogen peroxide. The study 88 suggested that increased properties were likely due to increased fibre roughness, resulting 89 in increased interfacial strength within the composites [13]. Interestingly, the use of hy- 90 drogen peroxide as a pulping chemical for CCA treated timber has also been investigated 91 and it has been found that the use of hydrogen peroxide in a pulping process could re- 92
move 100% Cr and As and 95 % of Cu in some cases [14]. 93
The environmental impact of fibre treatments is of concern due to the high chemical 94 and energy consumption of common processes. Ultrasonic treatment of lignocellulosic bi- 95 omass has shown the potential to assist with commonly used mechanical and chemical 96 treatment processes, reducing the time of treatments and chemical consumption, there- 97 fore, potentially reducing the environmental impact [15]. However, the treatment does 98
consume a lot of energy [15]. In simple terms, ultrasonic treatment creates large localised 99 pressure differences within a solution to enhance mechanical or chemical treatment pro- 100 cesses [15]. Ultrasonic treatment of wood flour has been investigated as a treatment 101 method for wood-plastic composites, and authors reported that the use of ultrasonic treat- 102 ment increased lignin removal from the wood flour and increased the tensile strength and 103 modulus of composites. The study indicated that the improvement in properties was due 104 to the reduction of lignin and increased exposure of cellulose, which improves its bonding 105 ability with a MAPP coupling agent. The report also indicated some reduction in tensile 106 strength in composites treated with higher concentrations of NaOH, most likely due to 107 the degradation of cellulose [16]. Ultrasonic treatment also has the potential to induce fi- 108 brillation on natural fibre surfaces [17]. The potential to generate fibrillation of the fibre 109 surface can increase the surface area of fibres and therefore increase interfacial strength 110 within composites. This phenomenon has been shown using fibre beating to induce fibril- 111 lation. Fibre beating was found to cause fibrillation of the primary cell wall, increasing 112 surface area, and therefore increasing interfacial strength. The study found an increase of 113 up to 10% in tensile strength, although with increased fibre beating, the tensile strength 114 was reduced, likely due to a reduction in fibre length [18]. 115 Generally, there have been studies on alkali digestion, bleaching or ultrasonication 116 for some common fibres. However, there are no studies on the combination of alkaline, 117 bleaching, and ultrasonication and the removal efficiency on Cu, Cr and As from recycled 118 CCA treated timber. Therefore, the aim of this study was to investigate the use of alkali 119 digestion, hydrogen peroxide bleaching, and ultrasonic treatment to obtain fibre from 120 waste CCA treated timber and wood flour in wood-plastic composite materials to assess 121 the potential of such recycled materials in the construction sector. 122
2. Materials and Methods 123
2.1. Materials 124
CCA treated timber was supplied as Radiata pine treated to an H 3.2 hazard class, 125 supplied as approximately 1-metre offcuts of 2x4" and 2x2" planks by ITM, Hamilton, 126 New Zealand Yuplene RX 3600 Polypropylene (PP) Random Copolymer produced by SK 127 Global Chemical, was used as the matrix. AC 950P Propylene Maleic Anhydride Copoly- 128 mer (MAPP) produced by Honeywell International Inc, was used as a coupling agent. 129 Bulk grade solid NaOH was used for the alkali digestion. Hydrogen Peroxide (30%) was 130 obtained from Perhydrol™, and Sodium Silicate solution obtained from Sigma-Aldrich 131 was used in bleaching Emsure, Nitric acid (65%), Emsure Hydrochloric acid fuming (37%) 132
were used for preparing samples for ICP-MS analysis. 133
134
2.2 Methods 135
2.2.1. Production of Reinforcement Materials: 136
The timber was initially chipped using a Ryobi RSH 2455G Garden Shredder and 137 then granulated with a Moretto GR granulator with an 8 mm grate. It was then dried for 138 at least 12 hours in an 80 °C oven before further processing. Wood flour was produced via 139 grinding granules of timber using a Sunbeam Multigrinder to make fine wood particles. 140 About 10 g batches of dried timber granules were ground for 1-minute periods and then 141
screened through an 850 µm sieve. 142
Digestion of timber to obtain fibres was done using 10 wt% NaOH aqueous solution 143 in a custom laboratory-scale batch digester. The system was heated from 25 °C (room tem- 144 perature) to 160 °C over 2 hours and then held at 160 °C for 2 hours. Digestion took place 145 with a 1:8 ratio of timber to solution (by weight). The system was then quenched to ap- 146 proximately 50 °C, and the fibres were washed until a pH of 7 was attained. 147 Bleaching of the digested fibres was undertaken using a solution of hydrogen perox- 148 ide and sodium silicate. About 25 g of oven-dry fibres and 2 L of tap water were added 149 and mixed in a beaker creating a 1:80 ratio (by weight). A Silverson L4RT homogeniser 150
was used to mix the fibre into the water and ensure the fibres were saturated. The mixture 151 was then heated on a heating plate until a temperature of 70 °C was reached. 100 ml of 152 hydrogen peroxide and 50 ml of sodium silicate were then added to start the bleaching 153 reaction. The bleaching process was undertaken for 10 minutes on the heating plate, while 154 stirring continuously. The fibres were washed until a pH of 7 was attained. 155 Before being used in fibre testing or for compounding, all reinforcement was dried 156 at 80 °C in an oven for at least 12 hours. The fibres were also prone to 'clumping' together 157 upon drying and required separating before composite production. A Sunbeam Multi- 158 grinder was used to shear the fibres apart with blunt blades at a high rotational speed. 159 Fibres were separated using 3 g of fibre for 10 second periods. Any clumps of fibre that 160 failed to separate was subjected to repeated processing, as many times as required, until 161
separation occurred. 162
2.2.2 Analysis of Fibre: 163
Scanning electron microscopy (SEM) was used to visually investigate the fibre sur- 164 faces. Fibres were mounted on aluminium stubs with carbon tape before being coated 165 with a thin layer of platinum to make them conductive using a Hitachi E-1030 Ion Sputter. 166 The fibres were examined using a Hitachi S 4700 Field Emission Gun Scanning Electron 167
Microscope operating at 5 kV. 168
Fibre quality analysis was undertaken using a Fibre Quality Analyser - 360 (FQA- 169 360). The analysis was performed to provide data on fibre length, width, aspect ratio, 170 number of bundles, and percentage of fines present. Fibre length was measured following 171 ISO 16065-1: 2014 Determination of fibre length by automated optical analysis [19]. 172 The thermal properties of fibres and wood flour were assessed using a Netzsch® 173 STA449 F5 Jupiter thermogravimetric analyser (TGA). A dynamic analysis was carried 174 out from 30 to 600 °C at a heating rate of 10 °C /min under argon flow of 40 mL/min 175 Inductively Coupled Plasma – Mass Spectrometry (ICP-MS) analysis was performed 176 to measure the heavy metal content in wood flour and fibres to assess the changes in cop- 177 per, chromium, and arsenic content, after chemical and mechanical treatments. Wood fi- 178 bre and flour samples were prepared for ICP-MS analysis following a full sediment diges- 179 tion method. A blank sample was also produced as a reference for the analysis. Roughly 180 0.2 g of the sample was weighed, recorded to 4 d.p., and placed in a clean 50 mL falcon 181 tube. 1 mL of HNO3 and 0.33 ml of HCl were added to the falcon tube. Type 1 water was 182 added to ensure submersion of the samples and left to predigest in a fume hood overnight. 183 A digestion block was then heated to 80 °C, and the samples were heated for 1 hour. Type 184 1 water was added to each falcon tube to top up the sample to 50 ml. The samples were 185 centrifuged for 10 minutes at 3000 rpm and the supernatant was filtered using a 0.45 µm 186 cellulose acetate, Minisart Syringe filter. 10 ml of the sample was then added to a 15 ml 187 falcon tube for ICP-MS analysis. The analysis was performed using an Agilent 8900 (Ag- 188 ilent Technologies, Santa Clara, California, USA) controlled by MassHunter Workstation 189 (version 4.5). Triplicates of each sample were assessed to ensure accuracy in the measure- 190
ment. 191
2.2.3 Production of Composites: 192
Composites were compounded using a Labtech LTE-20-44 twin-screw extruder. The 193 extruder was purged before extrusion and between different samples of composites. Ex- 194 trusion was done using a screw speed of 40 rpm and barrel temperatures ranging from 195 150 °C - 170 °C. After compounding, the composite was granulated using a Moretto GR 196
granulator with an 8 mm grate. 197
The WPC granules were injection moulded using a BOY 35A Injection moulding ma- 198 chine and a mould for a standardised Type 1 (ASTM 638 [20]) Dog-Bone, and a beam for 199
3-point testing (ISO 178 [21]). 200
2.2.4 Characterisation of Composites: 201
Tensile testing was carried out based on ASTM 638-03: Standard Test Method for 202 Tensile Properties of Plastics [20]. Test specimens were placed in a Binder GmbH Model 203 KMF 115 conditioning chamber at 23 °C ± 3 °C and 50 % ± 5 % relative humidity for at 204 least 40 h before any material testing was undertaken. The specimens were then tested 205 using an Instron 5982 Tensile Testing machine, using a 5 kN load cell operated at 206 5 mm/min. An Instron 2630-107 extensometer was used to measure the strain. Five speci- 207
mens were tested per condition for composites. 208
A basic creep test was undertaken to investigate the time dependent mechanical 209 properties of composites and polypropylene. Test specimens were placed in a condition- 210 ing chamber at 23 °C ± 3 °C and 50 % ± 5 % relative humidity for at least 40 h. The speci- 211 mens were tested in 3-point bending using an Instron 5982 Tensile Testing machine, using 212 a 5 kN load cell. Creep properties were tested for polypropylene and composites at 15 and 213 30 % of the maximum flexural strength (Measured based on ASTM D790-17: Standard 214 Test for Flexural Properties of Unreinforced and Reinforced Plastics and Electrical Insu- 215 lating Materials [22] using the ISO 178 [21] beams) of the corresponding material. The test 216 was undertaken in two steps; the specimen was initially loaded to the desired stress at a 217 rate of 20 MPa/min and then held at the set stress for 12 hours. 218 Scanning electron microscopy (SEM) was used to observe the composite’s fracture 219 surfaces. Composites that had undergone tensile testing were mounted on aluminum 220 stubs with carbon tape before being coated with a thin layer of platinum to make them 221 conductive using a Hitachi E-1030 Ion Sputter. The fractured surfaces were examined us- 222 ing a Hitachi S 4700 Field Emission Gun Scanning Electron Microscope operating at 5 kV. 223 Leaching analysis was completed based on AWPA E11-16 Standard Method for Ac- 224 celerated Evaluation of Preservative Leaching [23]. The leaching of heavy metals was com- 225 pleted by submerging three material beams (approximately 80x10x4 mm) in 300 ml of 226 distilled water. Leachate was collected, and the water was replaced at set time intervals 227 including 6, 12, 24, 48 hours and thereafter at 48-hour time intervals until 14 days was 228 reached. The leachate samples were then acidified by adding 0.2 ml of nitric acid to 9.8 ml 229 of leachate and measured for heavy metal content using ICP-MS with the methods de- 230 scribed in the ICP-MS analysis section above. Only one sample was tested for each rein- 231
forcement type. 232
2.2.5 Statistical Analysis 233
A statistical analysis was performed for some of the testing where a number of sam- 234 ples were tested. The averages of each test are displayed for the material properties. The 235 coefficient of variance (COV) was calculated as the standard deviation divided by the av- 236 erage value and displayed as a percentage. Differences in fibre and composite results were 237 tested using a statistical analysis performed using a Tukey test and analysis of variance 238 (ANOVA) for significant (p < 0.05) differences. All analyses were performed using 239
MINITAB Statistical Software. 240
3. Results and Discussion 241
3.1. Characterisation of Fibre 242
The wood fibre and flour samples used throughout the analysis were given coded 243 names and acronyms such as wood flour (F), digested fibre (D), digested and ultrasonic 244 treated fibre (DU), digested and bleached fibre (DB), and digested bleached and ultrasonic 245
treated fibre (DBU). 246
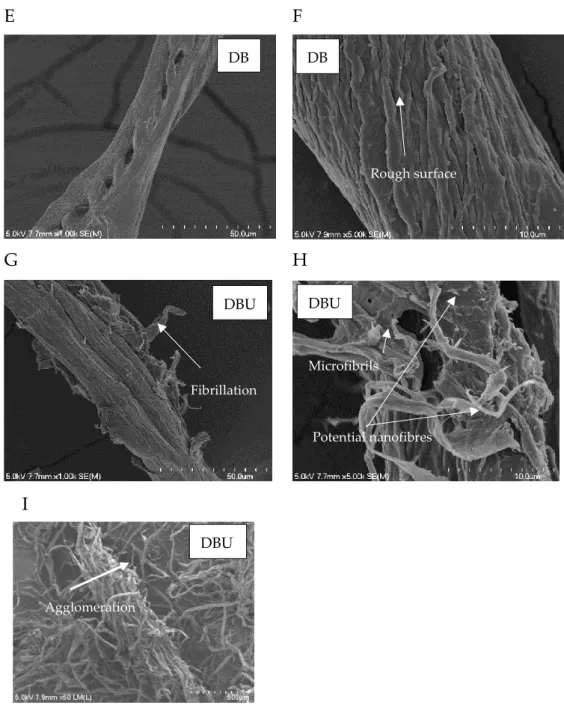
SEM was used to investigate the fibre surfaces after all processing steps and varia- 247 bles. The images of digested fibre show that the separation of fibres from the wood chips 248 has started to occur (Figure 1a), and some single fibres are present. However, fibre bun- 249 dles are still present, and further processing could improve separation. The texture of the 250 fibre surface (Figure 1b) suggests that localized lignin and extractives remain on the sur- 251 face [24]. The presence of fibre bundles further suggests lignin and extractives are present 252 on the fibre surfaces acting to bind the cellulosic fibres together in fibre bundles [7]. 253
Figures 1c and 1d shows the surface of the digested and ultrasonic treated fibres. The 254 surfaces are visually smoother than those of the alkali pulped fibres, signifying that ultra- 255 sonic treatment has removed some of the lignin and extractives from the surface of the 256 fibres. The images indicate that further fibre separation has occurred during the ultrasonic 257 treatment, and fibrillation is starting to occur as small fibrils can be seen on the surface. 258 Both fibres and cellulose fibrils within the fibres are held in place by lignin and extractives. 259 Therefore, the potential fibre separation and fibrillation of the fibre surface indicate fur- 260 ther removal of lignin and extractives holding the fibres and microfibrils together [7]. The 261 potential reduction of lignin and extractives agrees with the literature where ultrasonic 262 treatment has been found to remove lignin and extractives from wood flour [16]. 263 Figure 1e and 1f shows the fibre surface of the digested and bleached fibres. The fi- 264 bres in the images are seen to have a more textured surface than the digested fibre. This 265 surface is likely a result of the removal of localised lignin and extractives from the fibre 266 surfaces during the bleaching process, exposing the microfibrils in the fibre. This theory 267 agrees with literature where a rougher surface was obtained from hydrogen peroxide 268 bleaching, where it was subsequently used to improve interfacial strength in the corre- 269 sponding composites [13]. Hydrogen peroxide bleaching is also known to remove lignin 270 content [25]. The images also imply that more fibre separation has occurred, and more 271 individual fibres are present (compared to the digested fibre). The potential increase in 272 fibre separation is likely the result of the removal of lignin and extractives, which naturally 273
hold the fibres together in fibre bundles. 274
The digested, bleached, and ultrasonic treated fibres can be seen in Figure 1g, 1h, 275 and 1i. The use of ultrasonic treatment after bleaching the fibres shows significant fibril- 276 lation of the fibres and the exposure of microfibres and potentially nano fibres. The added 277 fibrillation from the ultrasonic treatment increases the surface area of the fibres, suggest- 278 ing a potential for more interaction and better interfacial strength between the fibres and 279
matrix. 280
281
A B
C D
Fibre Bundles
Fibrillation
D D
DU DU
E F
G H
I
Figure 1: SEM of A and B - digested fibre (D), C and D - digested and ultrasonic treated fibre (DU), 282 E and F - digested and bleached fibre (DB), and G, H and I - digested bleached and ultrasonic treated 283
fibre (DBU). 284
The fibrillation induced by the ultrasonic treatment can increase the interfacial 285 strength of composites through the presence of microfibrils and increased surface area. 286 However, literature has equally shown that mechanical processing to induce fibrillation 287 can also damage the fibres and reduce fibre length, with the potential of decreasing com- 288 posite strength [7]. Figure 1g and 1h shows significant fibrillation induced by the ultra- 289 sonic treatment after the bleaching process, suggesting potential for the fibre strength and 290 length to be decreased due to the ultrasonic process, and therefore, potential to reduce 291
corresponding composite mechanical properties. 292
Figure 1i reveals that the fibres tend to agglomerate after the treatment, as shown by 293 the large group of fibres. This phenomenon has the potential to reduce the mixing of ma- 294 trix and fibres during compounding, therefore reducing the wetting of fibres and reducing 295
composite properties. 296
Rough surface
Fibrillation
Microfibrils
Potential nanofibres
Agglomeration
DB DB
DBU DBU
DBU
The results from the fibre quality analysis were used to study the fibres geometry, 297 including width, length, aspect ratios, number of shives (bundles), and fines. Table 1 sum- 298 marises the information recorded for all fibre processing variables. 299 It can be seen that bleaching of the digested fibres reduced the diameter of the fibres 300 without any effect on fibre length. Literature suggests that increased chemical processing 301 results in a reduction of fibre width and the reduction in corresponding kappa number, 302 indicating the removal of lignin [26]. Therefore, the reduction in fibre width due to the 303 bleaching further suggests the removal of lignin and extractives from the fibre surface, 304 reinforcing the results of the SEM. The number of bundles or shives is also seen to decrease 305 after bleaching of fibres, which further suggests the reduction of lignin and extractives in 306 the fibres which are known to hold fibre bundles together [7]. 307 Ultrasonic treatment reduced the mean fibre length and had minimal effect on the 308 fibre width, resulting in a lower aspect ratio. However, the results suggest that ultrasonic 309 treatment (Sample DU) reduced the number of shives or fibre bundles, reinforcing the 310 results of the SEM where more individual fibres were visually present, and separation of 311
fibres bundles had been improved. 312
The ultrasonic treatment of the digested and bleached fibres was found to reduce the 313 length of the fibres from 1.18 mm to 0.66 mm, a reduction of 44%. Furthermore, the per- 314 centage of fines, weighted by length, was increased from 1.03% to 16.66%. Although the 315 SEM suggested the potential to increase interfacial strength due to fibrillation of the fibres, 316 the large reduction in fibre length and increased number of fines in the fibres further sug- 317 gests the potential of reducing composite properties due to reduced fibre reinforcement 318
capability. 319
The analysis shows that the use of ultrasonic treatment increases the fibre width. Af- 320 ter ultrasonic treatment, the mean fibre width of the digested fibres slightly increased 321 from 32.39 µm to 32.62 µm (comparing D and DU fibre) and increased the mean width of 322 the bleached fibres from 31.47 um to 32.76 um (comparing DB and DBU fibre). The appar- 323 ent increase in width is likely due to the additional fibrillation surrounding the fibres, 324 which resulted in an apparent fibre width that is larger than the actual fibres. The SEM 325 reinforces this, as the difference was larger in the width of the bleached fibres, where sub- 326 stantially more fibrillation was indicated. It is likely that the actual width of the fibres has 327 been reduced due to the micro fibrils being separated from the primary wall of the cellu- 328 losic fibres and the potential removal of lignin from the fibre surface. 329 The results of the analysis also show that the number of shives increased with the 330 ultrasonic treatment in the digested and bleached fibres (comparing DB and DBU fibre). 331 The shives measured are likely a result of the agglomeration of fibres, indicated in Fig- 332
ure 1-I of the SEM results, being measured as shives. 333
334
335
Table 1: Summary of results from fibre quality analysis. The number of shives as a percentage of 336
the number of fibres measured is given in parenthesis. 337
Sample
Number of Fibres Measured
Mean Length (mm)
Mean Width (µm)
Aspect Ratio
Number of Shives
Fines (Length Weighted) (%)
Digested (D) 33190 1.20 32.39 36.95 85.67 1.01
Digested + Ultrasonic
(DU) 38720 0.94 32.62 28.80 10.33 2.74
Digested + Bleached +
DB 47840 1.18 31.47 37.64 19.00 1.03
Digested + Bleached + Ultrasonic +
DBU 36430 0.66 32.76 20.10 66.00 16.66
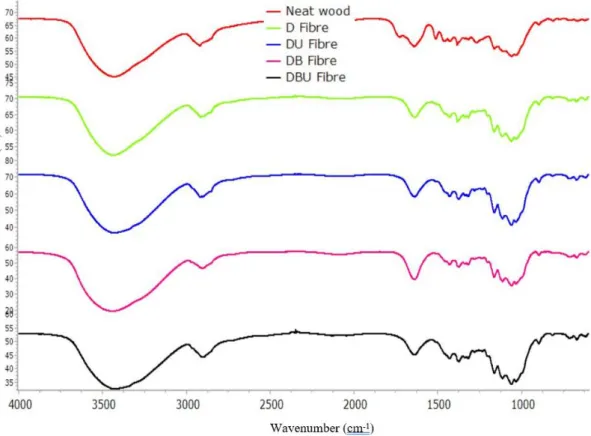
338 The digestion process aimed to reduce the content of lignin, hemicellulose, and ex- 339 tractives, in a single step. Literature on Kraft pulping indicates that hemicellulose is orig- 340 inally removed at a faster rate than lignin [27]. The digestion process also appears to fol- 341 low this trend, as the spectra in Figure 2 indicates the removal of most of the hemicellulose 342 in the digestion process, whereas residual lignin appears to remain. A clear peak in the 343 wood flour spectra at 1726 cm-1 is specific to -COOH and C=O functional groups which 344 are specifically found in hemicellulose. The spectra for all other fibres do not contain this 345 peak, suggesting that hemicellulose has primarily been removed during the digestion pro- 346
cess [28]. 347
The spectra suggest a reduction of lignin in the digestion and bleaching processes. 348 The peaks at 1511 cm-1 represent the functional group C=C, and are assigned to aromatic 349 rings of lignin, specifically indicating guaiacyl (G) units. The indication of G units of lignin 350 makes sense as the lignin in soft woods such as Pinus Radiata primarily are known to pri- 351 marily be composed of G units [29]. The spectra show a reduction of the 1511 cm-1 in the 352 digested fibre and a further reduction in the peak after bleaching. The reduction in the 353 size of the peak indicates partial removal of lignin from the fibre during these chemical 354 processes. This removal of lignin is further inferred by reducing peaks at 1460 cm-1, indi- 355 cating the reduction of C-H functional groups assigned to lignin. However, lignin was still 356 clearly present in all samples, shown by the small peaks still present at 1511 cm-1, 1460 cm- 357
1, and the peaks remaining at 1120 cm-1 and 1039 cm-1, which all indicate functional groups 358
found in lignin. The presence of lignin even after bleaching is expected; literature from 359 the pulp and paper industry suggests bleaching of pulp can take up to seven different 360 chemical treatments due to the difficulty of removing lignin [25, 28]. 361 The figure suggests that the use of ultrasonic treatment with NaOH gives no signifi- 362 cant change in the peak, indicating little change in the constituents present in the fibres. 363 However, the FTIR spectra used is qualitative, and the processing could have small un- 364 seen effects on the constituents present in the fibres. 365
366
Figure 2: FTIR results from neat wood, and all fibre samples. Neat wood (wood flour), D (digested 367 fibre), DU (digested and ultrasonic treated fibre), DB (digested and bleached fibre), and DBU (di- 368
gested, bleached, and ultrasonic treated fibre). 369
X-Ray Diffraction (XRD) was used to analyse the crystallinity of the timber and fibres. 370 The crystallinity index of the wood flour and fibres gives further insight into the constit- 371 uents in the timber, and the XRD spectra provides insight into any potential changes to 372 the crystalline cellulose. The crystallinity index was calculated using the Segal method 373 using the spectra in Figure 3. The resulting crystallinity indices (Xc) are displayed in Fig- 374 ure 3 along with the spectra. The results show that the crystallinity index increases with 375 progressing chemical processing. The crystallinity index increased from 41.9 % for the 376 timber, to 67.2 % for the digested fibres (comparing F and D samples). Furthermore, the 377 crystallinity index increased to 71.5 % because of the bleaching process (comparing D and 378 DB samples). The increase in the crystallinity index was likely due to the removal of amor- 379 phous material, including lignin, hemicellulose, and other extractives. This reduction of 380 amorphous constituents is confirmed by the SEM, fibre quality analysis, and FTIR dis- 381
cussed earlier. 382
The results from the XRD analysis show that the use of ultrasonic treatment after 383 digestion also increases the crystallinity index, which is likely due to the removal of small 384 amounts of amorphous constituents (comparing D and DU fibre). However, the crystal- 385 linity index is reduced after the ultrasonic treatment of the bleached fibres (comparing DB 386 and DBU fibre). The spectra in Figure 3 shows a shoulder peak emerging at roughly 20º, 387 which is more obvious in the DBU fibre. The peak suggests the transformation from 388
cellulose Iβ to cellulose II, resulting in the formation of the peak at 20º (corresponding to 389 the 110 plane in cellulose II) and the reduction of the peak corresponding to the 002 plane. 390 The potential transformation of small amounts of cellulose Iβ to cellulose II explains the 391 reduction in the calculated crystallinity index caused by the high amounts of energy dur- 392 ing the ultrasonic treatment. This reduction also shows the limitations of the Segal method 393
used for calculating the crystallinity index [30, 31]. 394
395
396
Figure 3: XRD of CCA results from treated timber and all fibre samples. F (wood flour), D (digested 397 fibre), DU (digested and ultrasonic treated fibre), DB (digested and bleached fibre), and DBU (di- 398
gested, bleached, and ultrasonic treated fibre) 399
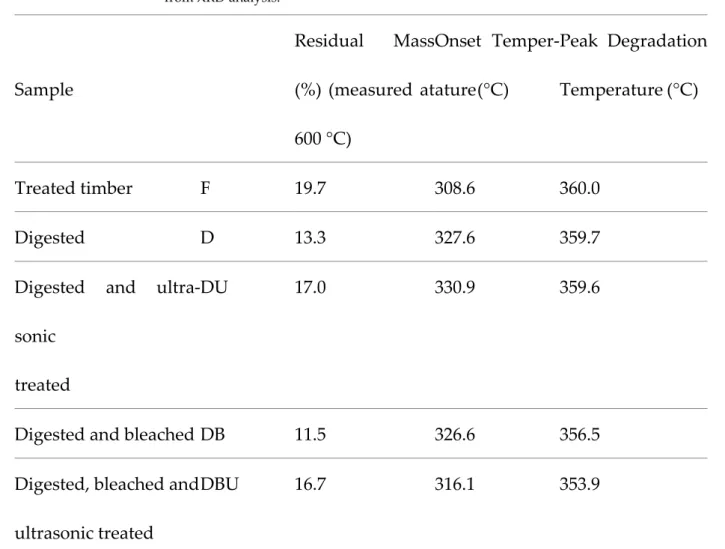
TGA was used to analyse the thermal degradation of the treated timber and fibres. 400 Figure 4 shows the TG and DTG (1st derivative of TG) analysis for all fibres and wood 401 flour samples and Table 2 summarises the mass change, onset temperature, and peak deg- 402 radation temperatures. The DTG results show the first derivative of the TG results, 403 providing peaks that represent the rate of thermal degradation. Variances in the TG and 404 DTG for the fibre samples are likely due to differences in the content of cellulose, lignin, 405 hemicellulose, and extractives. Previous studies suggest that "hemicellulose decomposes 406 at a lower temperature range (220–315 °C) than cellulose (300–400 °C), while lignin de- 407 composes over a broad range of temperatures (150– 900 °C)" [32]. However, it has been 408 reported that the heavy metals can affect the thermal conductivity of the material, poten- 409 tially affecting the thermal degradation properties [10]. 410 The results of the TG testing indicate an initial change in mass at approximately 100 411 ºC in all samples, suggesting the presence of water. The DTG of wood flour shows a major 412 peak at 360 ºC, and shoulder peaks at 260.7 ºC and 326 ºC, likely indicating the lignin and 413 hemicellulose in the timber degrading before the cellulose. The samples all show initial 414 thermal degradation at approximately 200 ºC, most likely due to the presence of lignin 415 which degrades at lower temperatures than the other major constituents. This is most sig- 416 nificant in the wood flour, however, it occurs in all samples. 417
418
419
Figure 4: TGA results from treated timber and all fibre samples. Neat wood (wood flour), D (di- 420 gested fibre), DU (digested and ultrasonic treated fibre), DB (digested and bleached fibre), and DBU 421
(digested, bleached and ultrasonic treated fibre) 422
423
424
Table 2: Data from TGA analysis for treated timber and all fibre samples, and crystallinity index 425
from XRD analysis. 426
Sample
Residual Mass (%) (measured at 600 °C)
Onset Temper- ature (°C)
Peak Degradation Temperature (°C)
Treated timber F 19.7 308.6 360.0
Digested D 13.3 327.6 359.7
Digested and ultra- sonic
treated
DU 17.0 330.9 359.6
Digested and bleached DB 11.5 326.6 356.5
Digested, bleached and ultrasonic treated
DBU 16.7 316.1 353.9
427 ICP-MS was used to analyse the heavy metal content in the reinforcement materials. 428 The results of the analysis are shown in Table 3. In New Zealand, H 3.2 CCA treated tim- 429 ber requires the total concentration of heavy metals to be 0.37 wt.% (in the timber) as de- 430 fined by NZS 3640 [33]. However, the sum of the three heavy metals in the timber adds to 431 0.42 wt.%, which is slightly higher than the New Zealand standard. The specific content 432 of copper, chromium, and arsenic in the timber was measured to be 0.0839 wt.%, 433 0.13785wt.%, and 0.0968 wt.%, respectively, inferring proportions of 26.8% Cu, 41.2% Cr 434 and 32.0% As. The results fit reasonably well with the relative proportions required by 435 NZS 3640 in the CCA treatment of 23 – 25 % Cu, 38- 45 % Cr, and 30 – 37 % As [33]. The 436 copper concentration is the only heavy metal lying outside the expected range (1.3% 437 higher than expected). The small differences in heavy metal content compared to the NZ 438 standard are potentially due to variation within the timber and the small sample size of 439 wood flour used for testing. However, the results are very similar to the New Zealand 440 standard and can be regarded as an accurate representation of the trend in the heavy metal 441
content in the wood flour and fibres. 442
Table 3 shows how the concentration of heavy metals changes with the treatment of 443 the timber and fibres. The results show that the concentration of arsenic was reduced by 444 99.8 % from the wood flour to the digested fibres and was further reduced with further 445 treatment. The reduction in arsenic content signifies that the fibres could potentially be 446 used safely in wood-plastic composite applications, as arsenic is considered the most toxic 447
of the three heavy metals [34]. The concentration of copper and chromium was also re- 448 duced after digestion, bleaching, and ultrasonic treatments. The reduction of the concen- 449 tration of chromium was less than that of arsenic (Cr was reduced from 1728.5 ppm to 450 957.9 ppm from the treated timber to digested fibres, respectively). The concentration of 451 copper was found to only decrease from 1126.4 ppm to 1093.6 ppm (comparing the timber 452 and digested fibre). Bleaching with hydrogen peroxide was found to reduce both copper 453 and chromium in the fibre and further reduce the arsenic content. In contrast, ultrasonic 454 treatment had the least effect on the heavy metal content. 455 The variable changes in heavy metal concentration (i.e. comparing changes in Cu, Cr, 456 and As concentration) in the digested fibre is likely a result of how the heavy metals are 457 fixed into the timber. The literature is very unclear on the exact chemistry of the fixation 458 of preservatives into timber; however, a recent report suggests that the heavy metals are 459 fixed in the timber in the forms of chromium (III) arsenate, chromium (III) hydroxide and 460 wood carboxylate-copper (II) complexes [35]. The removal of 99.8 % of As suggests the 461 removal of the majority of the chromium (III) arsenate in the timber during the digestion 462 process. The potential reduction of chromium (III) arsenate in the timber would agree with 463 the results; although, As is almost completely removed, the concentration of Cr is roughly 464 halved, which is likely due to the chromium (III) hydroxide remaining in the fibre. Thus, 465 the results infer that the chromium (III) arsenate is fixed primarily into the alkali soluble 466 constituents of the timber (such as hemicellulose and lignin). However, the concentration 467 of copper and chromium changes less, which could result from chromium (III) hydroxide 468 and carboxylate-copper (II) complexes potentially being evenly distributed and fixed 469 throughout all the timber constituents (including cellulose). 470 When considering the yields of the digestion, ultrasonic, and bleaching processes, the 471 mass of heavy metals in the fibres compared to the original mass of heavy metals in the 472 timber is significantly reduced. Therefore, a significant portion of the heavy metals from 473 the timber can be expected to be in the fibre treatment solutions after processing (diges- 474 tion, bleaching, and ultrasonic treatment solutions). The presence of the heavy metals will 475 likely alter any potential commercial-scale recovery of water, biomass, or chemicals from 476 the solutions, and will require further research. The highly alkaline solutions used for 477 processing may precipitate the heavy metals allowing for their removal [36]. However, 478 more research is required to investigate this possibility. 479 480
Table 3: Mean heavy metal concentration in fibre and timber samples. F (wood flour), D (digested 481 fibre), DU (digested and ultrasonic treated fibre), DB (digested and bleached fibre), and DBU (di- 482 gested, bleached and ultrasonic treated fibre). The COV is presented in parenthesis (%). 483
Cu (ppm) Cr (ppm) As (ppm)
F 1126.4(4.57) 1728.5(5.61) 1346.0(4.97)
D 1093.6(0.91) 957.9(0.71) 1.94(1.43)
DU 986.89(3.43) 852.17(5.42) 1.30(10.8)
DB 556.53(1.99) 353.16(2.52) 1.21(3.95)
DBU 503.22(4.95) 338.76(5.70) 0.823(9.09)
484
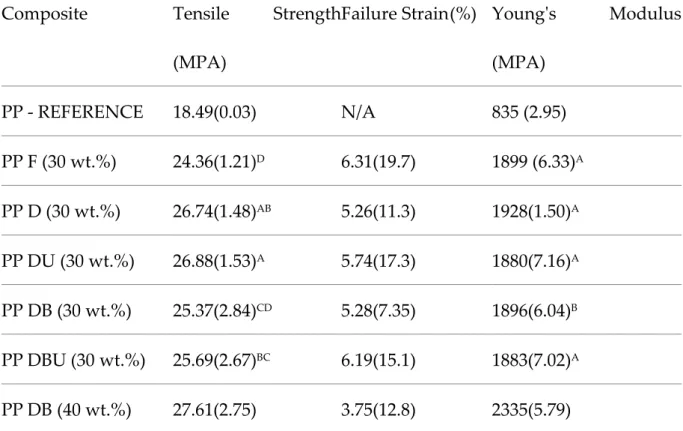
4.2 Characterisation of Composites 485 Composites were assessed for there mechanical properties and for the potential of 486 leaching. Table 4 and Figure 5 show the tensile properties of the composites. 487
Table 4: Mechanical properties of 30 wt.% F (wood flour), D (digested fibre), DU (digested and 488 ultrasonic treated fibre), DB (digested and bleached fibre), and DBU (digested, bleached and ultra- 489
sonic treated fibre) composites, and 40 wt.% DB composites. 490
Composite Tensile Strength (MPA)
Failure Strain (%) Young's Modulus (MPA)
PP - REFERENCE 18.49(0.03) N/A 835 (2.95)
PP F (30 wt.%) 24.36(1.21)
D6.31(19.7) 1899 (6.33)
APP D (30 wt.%) 26.74(1.48)
AB5.26(11.3) 1928(1.50)
APP DU (30 wt.%) 26.88(1.53)
A5.74(17.3) 1880(7.16)
APP DB (30 wt.%) 25.37(2.84)
CD5.28(7.35) 1896(6.04)
BPP DBU (30 wt.%) 25.69(2.67)
BC6.19(15.1) 1883(7.02)
APP DB (40 wt.%) 27.61(2.75) 3.75(12.8) 2335(5.79)
*The COV is presented in parenthesis (%). Means that share a letter (A, B, C, and D), in the same 491 column, suggest that the differences are statistically insignificant (p< 0,05). 492 Table 4 shows the tensile properties of the PP and composites produced in this study. 493 A higher tensile strength was attained in the fibre composites than wood flour composites. 494 The highest TS obtained was from the composites produced with DU fibres, and the high- 495 est young's modulus (YM) was from the composites produced using D fibre. The results 496 show that the bleaching process reduced the average TS and YM of corresponding com- 497 posites. When comparing composites produced with D and DB fibres, the average TS was 498 reduced from 26.74 MPa to 25.37 MPa, and the YM from 1928.92 MPa, to 1896.13 MPa. 499 The ultrasonic treatment had similar effects for both the digested and digested and 500 bleached fibres. The inclusion of an ultrasonic treatment was found to increase the average 501 TS and decrease the YM for composites in both cases (comparing D and DU fibre compo- 502 sites and DB and DBU fibre composites). The increase in TS is likely due to the increase in 503 the surface area caused by the fibrillation from the ultrasonic treatment shown in the re- 504 sults of the SEM of fibre surfaces (Figures 1c and 1g). The increase in fibre surface area has 505 the potential to increase interfacial strength and therefore improve composite TS. Further- 506 more, the reduction in YM is likely a result of the decrease in fibre length induced by the 507 ultrasonic treatment which was shown in the fibre quality analysis (Table 1). The reduc- 508 tion in length is likely to have reduced fibre reinforcement efficiency as the length of fibre 509
that the load is transferred to is reduce [18]. The results from the tensile testing of the fibre 510 composites are all very similar. The COV and the results of the Anova test indicate that 511 the differences in YM of the fibre composites are statistically insignificant, and the tensile 512 strength was higher for digested fibre then digested and bleached fibre, and the use of 513 ultraosinc treament did not make a statistically signifigant difference. 514 The bleached fibres had the lowest heavy metal content, likely giving an advantage 515 as a commercially viable product, Furthermore the TS of the composites were only slightly 516 lower than the digested fibre composites, and there was no statistically significant differ- 517 ence in the YM. Composites were produced using 40wt.% digested and bleached fibre, 4 518 wt.% MAPP, and 56 wt.% PP, to provide a better understanding of the mechanical perfor- 519 mance attainable. Table 4 shows that the resulting average tensile strength was found to 520 be 27.61 MPa, the highest strength properties attained from any composites tested during 521 this study. The modulus increased compared to the composites with 30 wt.% bleached 522 fibres, and a modulus of 2.33 GPa was attained. Due to the high YM and failure strain 523 attained from the extruded 40 wt.% DB fibre composites, the composites could be re- 524 garded as having the most useable mechanical properties. 525 The results from the composites with 40 wt.% fibre suggest that the wetting of the 526 fibres using the extruder is still good with the increased fibre content, therefore providing 527 good interfacial strength and increased mechanical performance. 528 Figure 5 shows the stress strain curve from the tensile testing of polypropylene, 529 30 wt% DB fibre composites and 40 wt% DB fibre composites. The figure shows that the 530 addition of more fibre increases the strength and stiffness of the composites. However, 531 the failure strain is reduced with the addition of more fibre. 532
533 Figure 5: Stress strain curve of PP 30 wt% DB fibre (DB 30) and 40 wt% DB fibre (DB 40) composites. 534 535 The failure surfaces of the composites were studied using SEM to understand the 536 failure mechanisms during tensile testing. Overall, the composites showed minimal dif- 537 ferences between the composites produced with varying fibre treatments. Figure 6 shows 538 some examples of failure surfaces of the composites. The long matrix ‘tongues’ shown in 539 the figures indicate that the composites fail in a ductile manner caused by plastic defor- 540 mation of the matrix of the same magnitude (if not bigger) of the fibres within the compo- 541 site. The composites also indicate a non-homogenous failure surface in all composites 542 which could potentially suggest poor mixing during the extrusion or poor compatibility 543 with the fibres and matrix resulting in a non-homogenous mix of fibres and polymer 544 through the composites cross-section. The figure also indicates some porosity within the 545 composites. This could further lead to reduced composite strength as it acts as stress 546
-5 0 5 10 15 20 25 30 35
-2 0 2 4 6 8 10 12
Stress,σ(MPa)
Strain, ε(%)
PP DB 30 DB 40
concentrations in the material while testing. Overall the SEM indicates that the composite 547 performance could be improved with improved processing. 548
549 Figure 6: SEM of failure surfaces for A) digested fibre composite with 30 wt% fibre and B) digested 550
bleached and ultrasonic fibre composites with 30 wt.% fibre. 551
Ductile Failure Surface
Porosity
Porosity or Fibre Pull-out Porosity or Fibre Pull-out
Porosity or Fibre Pull-out
Porosity or Fibre Pull-out Nonhomogeneous Failure Surface
Creep testing was undertaken over a 12-hour period to understand the influence of 552 the introduction of fibres to PP on the viscoelastic behaviour. The 40 wt.% DB fibre com- 553 posites were used for the study since it showed the most appropriate mechanical proper- 554 ties for the construction sector. PP was used as a comparison. The composite and PP were 555 tested at 15 and 30 % of their specific flexural strength. The PP flexural strength was 556 23.56 MPa, and the DB composites flexural strength was 45.19 MPa. The resultant flex- 557 ural strain was measured over a 12-hour period and shown in Figure 7. 558 Figure 7 shows that for tests at both 15 and 30 % of the flexural strength, PP has a 559 higher flexural strain than the composites, even though the applied stress was lower. Fur- 560 thermore, the results indicate that the creep rate is higher in the PP than the DB fibre com- 561 posites in both tests. Both the differences in strain and creep rate between PP and compo- 562 sites appear to be more pronounced in the 30% strength tests than the 15% tests. 563 Figure 7 also shows that the creep curve for the DB fibre composites follows a smooth 564 line that is potentially starting to plateau in both 15 and 30% tests over a 12-hour period. 565 However, the PP curve for the 30 % test has an initial plateau at roughly 15000 seconds 566 before starting to accelerate again later in the test. This curvature is potentially indicative 567 of the PP sample reaching a tertiary creep phase as the creep rate starts to accelerate at the 568 end of the test. However, it is also possible that it is due to other factors, such as the com- 569 plex semi-crystalline structure of PP. The data suggests that using the DB fibres is useful 570 for reducing the strain in the composites and the creep rate in the material. Furthermore, 571 it is possible that the introduction of wood fibres has increased the time taken to induce 572 tertiary stress, which is important for structural application in the building sector, where 573
tertiary creep should be avoided [37, 38]. 574
575
576
Figure 7: Creep testing of polypropylene (PP) and 40 wt.% DB (digested and bleached) fibre com- 577
posites. 578
Variances in temperatures may have affected the test results due to the susceptibility 579 of polymers properties to variance in temperature. However, it is unlikely that the small 580 differences in the temperature during testing affected the trends found in the results. 581 The testing gives insight into the improvement of creep properties when fibres are 582 added to polymers to alter properties. However, to understand long term application po- 583 tential, more testing and, further research is required to understand creep performance in 584 this time frame and whether tertiary creep can be avoided [39] 585 0
0.5 1 1.5 2 2.5 3
0 5000 10000 15000 20000 25000 30000 35000 40000 45000
Flexural Strain, ε(%)
Time, t (s)
40 wt% (30% Flexural strength) 40 wt% (15% Flexural strength) PP (30% Flexural strength) PP (15% Flexural strength)
Figure 8 shows the cumulative leaching of copper, chromium, and arsenic from 30 586 wt.% wood flour (F), digested fibre (D), and digested and bleached fibre (DB) composites 587 over a 14-day period (cumulative leaching values after 14 days are summarised in Table 588 5). The experimentation took place by measuring only one sample of leachate per compo- 589 site material at each time interval, and the accuracy of the results could be increased 590 through testing replicates. Furthermore, although the results of all of the testing were 591 above the quantitative limit of the ICP-MS experimentation, some of the results indicate 592 extremely low levels of heavy metals (especially the leaching of As from D and DB fibre 593 composites), and the results of samples with very low levels of leaching are potentially 594 susceptible to errors in the methods undertaken or contamination. However, the results 595 shown in the figures give a clear trend in leaching properties between samples. 596 597 598
Figure 8: Cumulative leaching of copper, chromium, and arsenic, from 30 wt.% F (wood flour), D 599 (digested fibre), and DB (digested and bleached fibre) extruded composites. 600 601 0.00
10.00 20.00 30.00 40.00 50.00 60.00
6 12 48 96 144 192 240 288 336 384
Cu leaching (PPB)
Time, hours
0.00 1.00 2.00 3.00 4.00 5.00 6.00
6 12 48 96 144 192 240 288 336 384
Cr leaching (PPB)
Time, hours
F D DB
0.00 5.00 10.00 15.00 20.00 25.00 30.00 35.00 40.00 45.00
6 12 48 96 144 192 240 288 336 384
As leaching (PPB)
Time, hours
Table 5: Summary of cumulative leaching (total over 14 days) of copper, chromium, and arsenic, 602 from 30 wt.% F (wood flour), D (digested fibre), and DB (digested and bleached fibre) extruded 603
composites. 604
Cu (ppb) Cr (ppb) As (ppb)
F 49.22 1.98 41.29
D 48.96 4.78 0.42
DB 19.84 1.84 0.07
605 The recorded leaching values of the wood flour composites were lower than other 606 studies, likely due to the low content of wood flour in the composites allowing for better 607 encapsulation in the matrix, therefore, restricting water penetrating the composites and 608 reducing the ability of the heavy metals to leach out [9, 10]. 609
The results shown in Figure 8 and 610
Table 5 show that the leaching of copper is higher from all materials than the leaching 611 of chromium and arsenic. This is interesting as the content of chromium in both the wood 612 flour and digested fibres is higher than the other heavy metals, shown in Table 3. The 613 arsenic leaching from the wood flour was also significantly higher than the chromium 614
leaching. 615
The leaching of copper and arsenic appears to be directly related to the heavy metal 616 content in the flour and fibres. The concentration and leaching of copper were very similar 617 for wood flour and digested fibres, and the concentration and leaching of copper were much 618 lower for the digested and bleached fibres. The properties were very similar for arsenic; 619 the wood flour has a high concentration of arsenic and leaches the most, whereas the D 620 and DB fibres have very low concentrations of arsenic, and the corresponding leaching 621
was also minimal. 622
Differing from the copper and arsenic leaching properties, the leaching of chromium 623 does not appear to directly relate to the content in the wood flour and fibres. The wood 624 flour has the highest chromium content, whereas the digested fibres appear to leach the 625 most over a two-week period. The digested fibre composites were seen to absorb the most 626 moisture, which has the potential to allow for more chromium to leach out of the compo- 627 sites. However, the leaching of chromium from the DB fibre composites suggest that there 628 was further reasoning; leaching and moisture absorption of the wood flour composites 629 and the digested and bleached fibre composites appeared to be very similar, however, the 630 content of chromium in the DB fibres in approximately 5 times less than that of the wood 631 flour (353.16 ppm compared to 1728.5 ppm). Therefore, it is likely that the fixation of chro- 632 mium into the composites was altered with the digestion process due to the high temper- 633 ature, and pressure in the alkali solution. This could be a result of residual chromium (III) 634 arsenate, which is expected to have been primarily removed, now being more susceptible 635 to leaching, or an alteration in the fixation of chromium (III) hydroxide. However, it 636 should be noted that the leaching was all measured to be in the same magnitude 637 of ppb, and it is possible that small amounts of contamination could have caused the dif- 638
ferences in results. 639
The maximum acceptable values (MAV) for the heavy metals in New Zealand's drink- 640 ing water are 2000, 50, and 10 ppb for Cu, Cr, and As, respectively [40]. The leaching from 641 composites produced with D and DB fibres both meet these standards, as seen in 642
Table 5. Therefore, even if there were small amounts of contamination or error in the 643 measurements, the samples are still below the MAV for safe drinking water. 644 The literature on using WPC produced with waste CCA treated timber indicated that 645 one of the largest concerns was the heavy metal content and the potential for leaching 646 when in application. Furthermore, the two studies that investigated leaching from WPC 647 showed leachate levels that were significantly higher than the MAV for safe drinking wa- 648 ter and used this as a justification for their concerns. However, the results of this study 649 suggest that the use of chemical processing to obtain wood fibres from CCA treated timber 650 has the potential to be used in the wood-plastic composite materials with leachate levels 651 significantly lower than the MAV of drinking water. Therefore, the leaching test results 652 indicate the potential for safe usage and application of composites produced with wood 653 fibres from waste CCA treated timber, even when in contact with people. 654
4. Conclusions and Future Recommendations 655
This research has evaluated the potential for using waste CCA treated timber as a 656 raw material for the reinforcement in WPC. The results show that the addition of fibres to 657 PP have the potential to considerably improve composite strength, compared to PP and 658 wood flour reinforced PP. The results also show that waste CCA treated timber could be 659 recycled to produce WPC that could be regarded as safe due to the low heavy metal con- 660 tent and low leaching. Additional fibre treatment was found to have minimal effect on 661 composite mechanical performance; however, the use of hydrogen peroxide bleaching 662 substantially decreased the heavy metal content and leaching of corresponding fibres and 663
composites. 664
The use of WPC in construction has potential to reduce reliance on virgin materials 665 (including treated timber) in the construction sector, which could further help reduce 666 treated timber waste over time. Previous studies have indicated the potential to reprocess 667 fibrous WPC up to eight times with minimal loss in mechanical performance, thus, indi- 668 cating potential to recycle the WPC and keep it in the construction sector for long periods 669
of time in circular life cycle [7]. 670
Further research on the durability of the WPC produced from waste treated timber 671 should be undertaken as it is likely to influence application potential. Further research 672 would be required to investigate the recovery or disposal of heavy metals, chemicals, and 673 water from this procedure to understand the economic and environmental implications 674 of the processing and the potential of WPC produced from waste CCA treated timber as 675
a sustainable and commercially viable material. 676
Life cycle analysis (LCA) should also be undertaken to investigate the environmental 677 impacts of producing WPC from waste CCA treated timber in comparison to the use of 678 virgin materials in the construction sector to understand the full environmental impact 679 including carbon emissions and human and ecotoxicity. LCA should be completed with a 680 comparison of the full life cycle of traditionally used materials in construction, and the 681 WPC to include all potential recycling stages of the WPC. 682
Author Contributions: 683
Funding: Project was funded from the Ministry of Business, Innovation and Employment (MBIE) 684 New Zealand Endeavour Fund, through the project Āmiomio Aotearoa – A circular Economy for 685
the wellbeing of New Zealand (UOWX2004). 686
Acknowledgments: The authors would like to acknowledge Christian Gauss, Akindoyo John, Jo- 687 anathan van Harselaar and Helen Turner for their technical support. 688 Conflicts of Interest: “The authors declare no conflict of interest.” 689 690
References 691 [1] BRANZ Working with treated timber. Available: http://www.level.org.nz/health-and-safety/materials-handling/working- 692
with-treated-timber/.(accessed 05 Februrary, 2021). 693
[2] M. U. Hossain and S. T. Ng, "Critical consideration of buildings' environmental impact assessment towards adoption of 694 circular economy: An analytical review", Journal of Cleaner Production, vol. 205, pp. 763-780, 2018. 695 [3] L. Helsen and E. Van den Bulck, "Review of disposal technologies for chromated copper arsenate (CCA) treated wood waste, 696 with detailed analyses of thermochemical conversion processes", Environmental Pollution, vol. 134, no. 2, pp. 301-14, 2005. 697 [4] Treated Timber Waste Minimisation Project Milestone 1: Industry Overview Available: 698 https://www.ecan.govt.nz/document/download?uri=1815993.(accessed 12 Februrary 2021) 699
[5] Hazard Assessment for H3.1 and H3.2 Timber Preservatives Available: 700
https://www.abodo.co.nz/resource/Downloads/Hazard-Assessment-for-H3.1-and-H3.2.pdf. (accessed 21 April 2021) 701 [6] An assessment of risks associated with use of CCA-treated timber in sensitive environments and optio