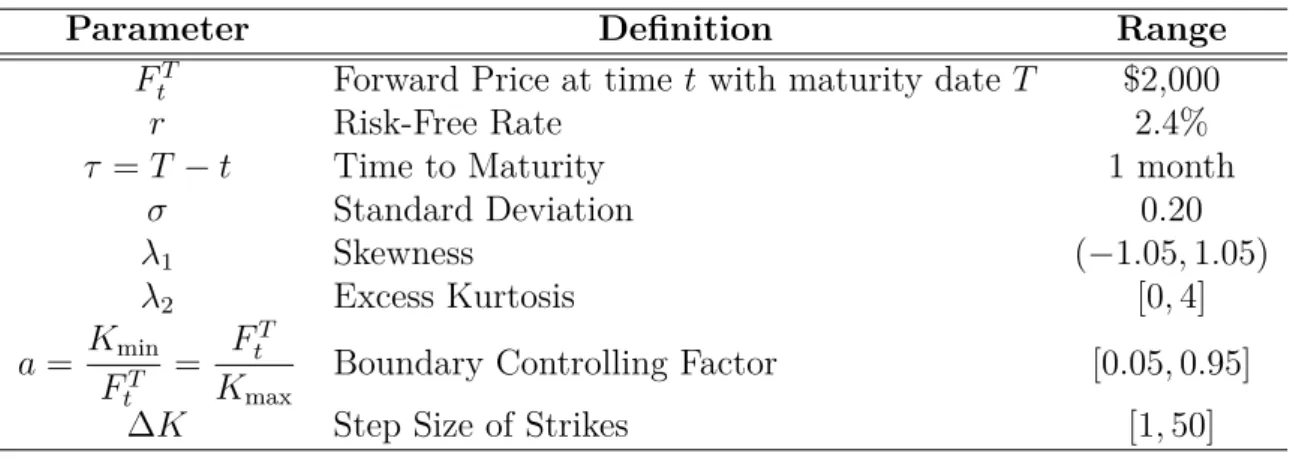
This is the first study of the errors of the Bakshi, Kapadia, and Madan (2003) risk-neutral moment estimators with the density of the underlying explicitly specified. Risk-neutral moment estimators are functions that convert option prices to the times of the underlying asset. These moments can be used to form a basis for understanding the behavior of the asset.
Bakshi and Madan (2006) examine the spread between the risk-free neutral and physical volatilities of the S&P100 index. Liu and van der Heijden (2016) and Lee and Yang (2015) study the errors of the BKM method when the true value of the risk-neutral moment is unknown. The values of the risk-neutral estimators are not calculated, but the errors are determined relative to the criterion.
Both Liu and van der Heijden (2016) and Lee and Yang (2015) study the errors of the BKM method with little control over the input. An example of the error calculation for skewness and kurtosis, performed for the points in Figure 2, is shown in Figure 3.
Calculating the Volatility Indices
From this, both the mean of the errors and the maximum absolute error for each area are plotted with their respective limit control factor and step size. A simpler form of equation (20) can be obtained by approximating the log and the square root, as shown here. 21) By suppressing kurtosis, this formula shows that introducing negative skewness into returns will cause the VIX to become smaller than the standard deviation. The CBOE VIX is used as a benchmark against the VIX calculated according to the BKM method.
Testing the Convexity Adjustment Term
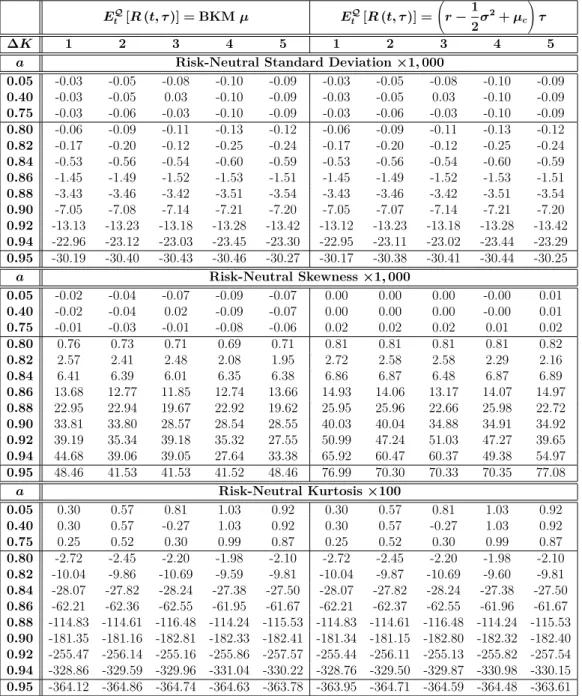
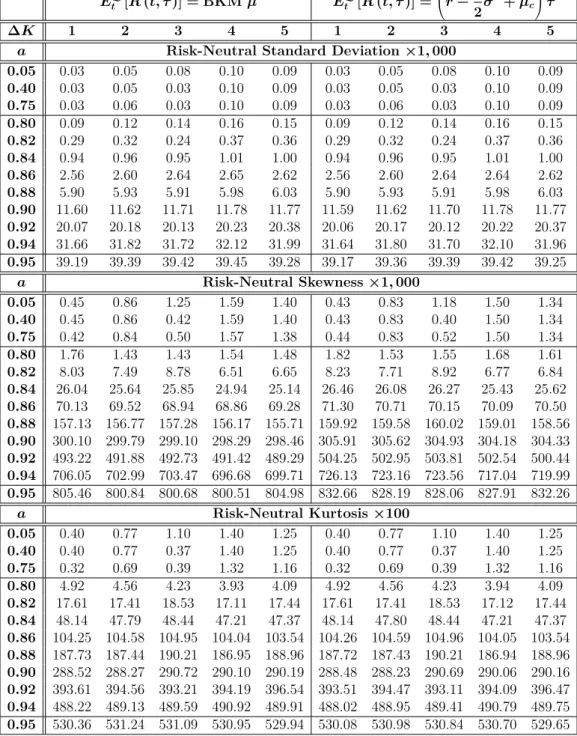
By using Equation (24) in place of the BKMµ, the errors caused by BKM's approximation can be calculated.
3 Data
4 Numerical Results
BKM Estimation
The constraint is stronger and is reflected in the allowed limiting factor and step size. The bound check factor and step size to ensure that the errors are bounded by 10−3 must also be bounded by 0.75 and $2, respectively. The step size depends on the futures price. To generalize this result, the step size must be less than 0.1% of the futures price.
This figure shows that the errors caused by truncation of the integral cause less predictable behavior, whereas changes in the step size do not appear to affect the error as unpredictably. Although the truncation error is less predictable, the behavior is stable when the limit controlling factor is below 0.75. Due to the large errors caused by truncation, Figure 5 shows errors with limit control factor values of and 0.75.
Figures 6 and 8 show the same errors but with respect to marginal control factors for step sizes of 1, 10 and 25. To examine the independence of the skewness estimator from kurtosis, the skewness is estimated when the skewness, marginal control factor and step size are set to - 1, 0.25, and 1, respectively, while adjusting the kurtosis within the valid Gram-Charlier range.
In-Depth Error Analysis
Since neither the true skewness nor the true kurtosis are chosen to be zero, the relative error for each estimator can be calculated. From this, the effects of kurtosis on skewness estimation and vice versa are shown to be insignificant. Therefore, for this case, the skewness estimate is independent of the kurtosis and vice versa.
The error does not decrease exponentially with the step size, but rather quadratically. Using these values, the asymmetric envelope can be decomposed into two components, the symmetric envelope and the trend expression. The error fluctuates with increasing period, to capture this behavior equation (26) seems suitable.
Since the risk-neutral moments are composed of multiple contracts, which in itself causes errors, the errors of each contract with respect to the step size are shown in Figure 13. The volatility contract errors can be modeled in the same way as the skewness estimator.
Alternative Convexity Adjustment Term
5 Implications
6 Conclusion
The BKM method is used to calculate the CBOE SKEW, this paper finds that to estimate the skewness within 10−3 of the true value, the shock range (Kmin, Kmax) must contain at least 3/4 to 4/3 of the forward price and have a step size (∆K) of no more than 0.1% of the future price. Instead of using the absolute error as a measure, if the average error is used, then the step size restriction can be relaxed to 1% of the future price. Under the same threshold control factor and step size specification, the absolute errors of kurtosis, standard deviation, and VIX are bounded by 5×10⁻³, respectively.
Increasing the granularity of the step size reduces the error approximately quadratically, not exponentially.
Demeterfi, Kresimir, Emanuel Derman, Michael Kamal, and Joseph Zou, 1999, A Guide to Volatility and Variance Swaps, Journal of Derivatives 6(4), 9–32. Dennis, Patrick and Stewart Mayhew, 2002, Risk-neutral crowding: evidence from stock options, Journal of Financial and Quantitative Analysis. Pliska, 1981, Martingales and stochastic integrals in the theory of continuous trading, Stochastic Processes and their Applications.
Heston, Steven L., 1993, A closed-form solution for options with stochastic volatility with applications to bond and currency options, Review of Financial Studies. Jarrow, Robert and Andrew Rudd, 1982, Approximate Option Valuation for Arbitrary Stochastic Processes, Journal of Financial Economics. Lee, Geul and Li Yang, 2015, Effect of Truncation on Model-Free Implicit Moment Estimator, Available at SSRN: https://ssrn.com/abstract=2485513.
Liu, Zhangxin and Thijs van der Heijden, 2016, Model-free risk-neutral moments and proxies, Available at SSRN: https://ssrn.com/abstract=2641559. Neumann, Michael and George Skiadopoulos, 2013, Anticipatory Dynamics in Higher-Order Risk-Neutral Moments: Evidence from S&P 500 Options, Journal of Financial and Quantitative Analysis. Stilger, Przemysław S., Alexandros Kostakis and Ser-Huang Poon, 2017, What risk-neutral asymmetry tells us about future stock returns.
Appendix
A Gram-Charlier Region Derivation
B Virtual Options Derivation
C BKM Derivation
D BKM and Black-Scholes Risk-Neutral Log Returns
E Numerical Integration
F VIX Derivation
Variance Swap Derivation
G Error Envelope Derivation
H Testing the Volatility, Cubic, and Quartic Contracts Directly
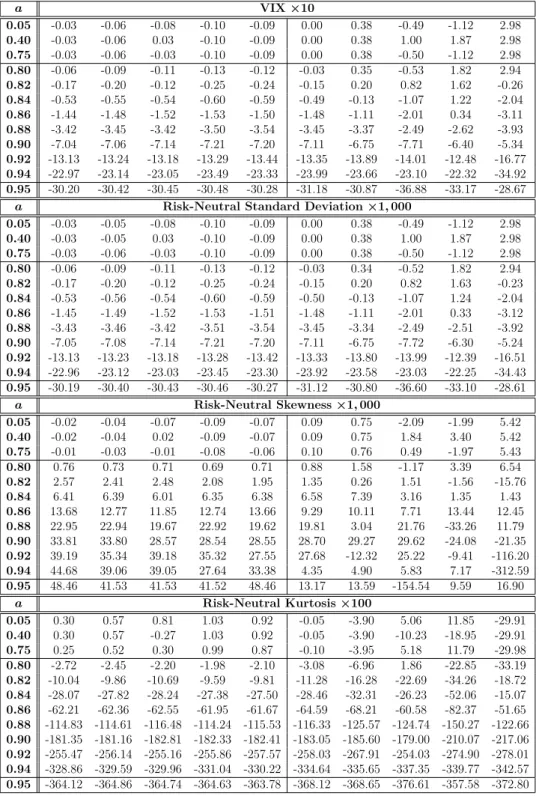
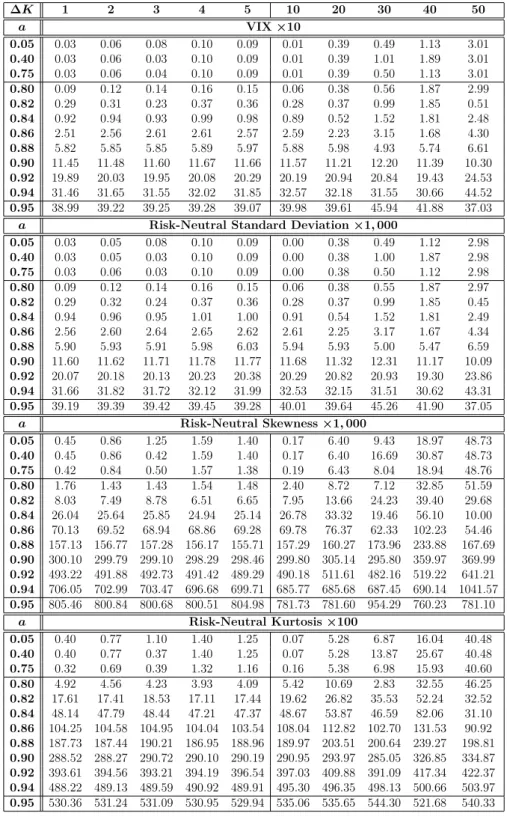
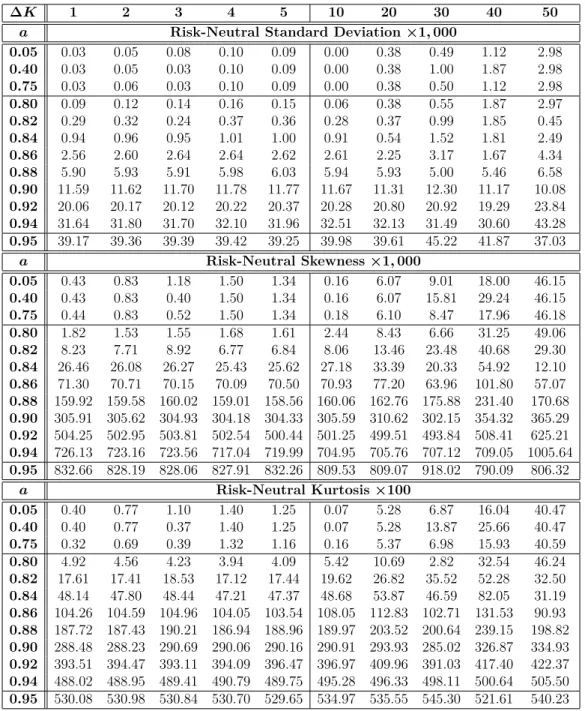
This table shows the mean errors of the VIX, standard deviation, skewness, and kurtosis estimators calculated from the valid Gram-Charlier region. The options created have a forward price FtT, time to expiration τ, risk-free rate r, and standard deviation σ, are arbitrarily set at $2,000, one month, 2.4%, and 0.20, respectively. This table shows the maximum values of the absolute errors of the VIX, standard deviation, skewness and kurtosis estimators calculated from the valid Gram-Charlier region.
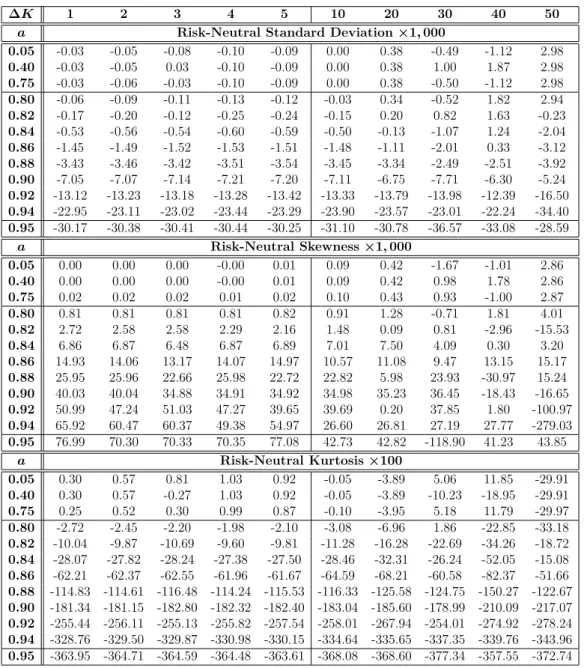
This table shows the maximum values of the VIX estimators' absolute errors, standard deviation, skewness, and kurtosis, which are calculated from the Gram-Charlier valid region. The generated options have a future price FtT, time to maturity τ, risk-free rate r, and standard deviation σ, are arbitrarily set at $2,000, one month, 2.4%, and 0.20, respectively. This table shows a comparison of the mean errors of the standard deviation, skewness, and kurtosis estimators, which were calculated from the Gram-Charlier valid region.
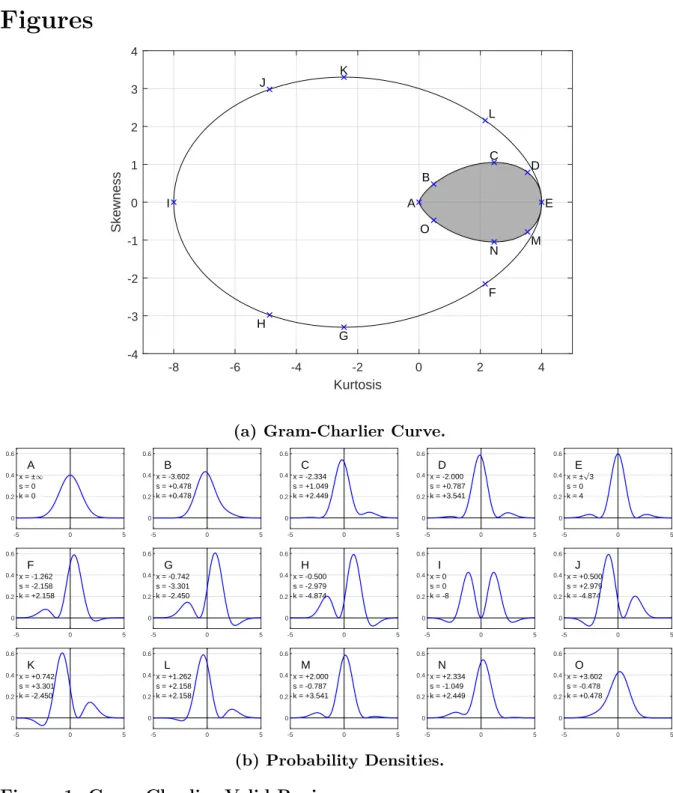
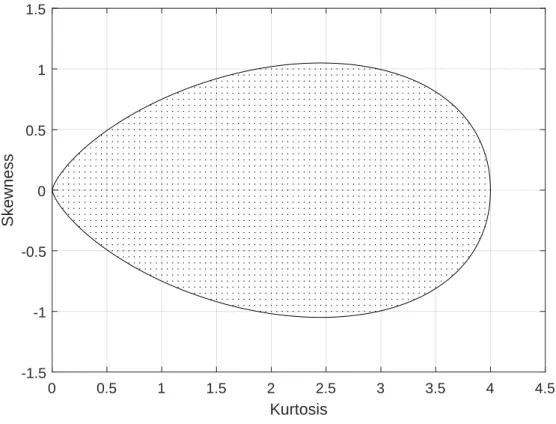
The options created have a forward price FtT, time to expirationτ, risk-free rater, and standard deviationσ, are arbitrarily set at $2,000, one month, 2.4%, and 0.20, respectively. This figure shows the region (shaded area) in which pairs of skewness and kurtosis values will yield valid probability density function using the Gram-Charlier series. These figures show the errors between the estimated skewness (a) and kurtosis (b) (using the BKM method) and their true values.
Based on the Gram-Charlier valid region, from which 2,515 pairs of true skewness and kurtosis values were used to calculate the error surface. Using the Gram-Charlier series, virtual options with known standard deviation σ, skewness λ1, and kurtosisλ2 were generated for a future price FtT, time to maturity τ, risk-free rate r, and standard deviation σ, arbitrarily set at $2,000. , one month, 2.4% and 0.20, respectively. A total of 2,515 different pairs of skewness and kurtosis (within the Gram-Charlier region) were used.
This figure shows the values and relative errors of skewness when kurtosis is changed (a), and kurtosis when skewness is changed (b). The bias errors for a marginal control factor of a = 0.05 with different step sizes between 1 and 50 show that, in general, as the step size increases, so do the errors. K = 0.001 (red line), the shape of the relationship between error and step size is revealed.
The relative errors for the volatility contracts, cubic and quartic for a limiting control factor of a = 0.05 with different step sizes between 1 and 50 shows that, in general, as the step size becomes larger, so do the errors.