GRADUATE SCHOOL OF BUSINESS AND GOVERNMENT MANAGEMENT
* Honours Student
WORKING PAPER SERIES 2/91 Cost Utility Analysis
in Health Policy
Sylvia Dixon
*
Public Policy and Economics
Faculty of Co=erce and Administration Victoria University of Wellington
September 1990 ISSN 0114-7420 ISBN 0-475-11433-7
1 Introduction
2 The Development of Cost-Utility Analysis
3 The Construction of Quality-Adjusted-Life-Year Indices
4 QALYs and Utility Theory
.1 Implicit Models of Individual Preferences .2 The Valuation of Health states
.3 Attitudes to Risk and Time Preferences .4 From Individual to Social Utilities
5 Issues in the Application of Cost-Utility Analysis 6 Conclusions
1 Introduction
The problem of valuing the benefits of health care programmes is a ubiquitious one in health economics.
since most health care systems in OECD countries have a large element of public provision, many of the goods and services they provide do not have market prices. Where markets in health care do exist, the prices generated are unlikely to provide reliable signals of the relative
value of these goods and services to society, due to numerous market imperfections.
Over the last fifteen years, the technique of cost-
utility analysis has been developed as a new approach to the problem of valuing health care benefits. A
distinctive feature of cost-utility analysis (CUA) lies in the fact that the outcomes of health care programmes are valued not in monetary terms but in terms of a new unit, the quality-adjusted-life-year (QALY), which embodies both the life-saving and the quality-of-life- improving dimensions of health care.
The method of cost-utility analysis has two main
elements: an analysis of the additional utilities (or quality-adjusted-life-years) generated by health care interventions, and an analysis of the costs entailed. In this paper I will focus almost exclusively on the first part of the process, for i t is the techniques developed for the analysis of utility gains that are both most innovative and most controversial.
A brief summary of the origins and objectives of cost- utility analysis is given in section 2. In section 3 the methods proposed for the construction of quality-
adjusted-life-year indices are described. These two sections are intended to provide a background for the analysis in the remainder of the paper. Readers who are already familiar with the literature can skip to section 4.
Section 4 focuses on some of the major theoretical and technical issues that underlie the measurement of QALYs.
At present, the concept of the QALY does not have a
single, consistent theoretical basis. In the absence of an agreed-upon theoretical framework, researchers working in the field have each used their own implicit model of individual preferences. Nor is there much consensus on the choice of measurement techniques, or any real
consistency in their application. In section 4 I explore the reasons for this diversity of approach and its
consequences.
Section 4 also raises the more fundamental question of whether the accurate and reliable measurement of health state utilities is really a feasible goal. There are reasons to believe that i t is not. Acknowledging this point would have important implications for the choice of QALY measurement techniques, for the manner in which
-2-
cost-per-QALY indices are interpreted, and for the way in which they are incorporated into health policy decision making.
Section 5 reviews briefly some of the social, political and ethical issues that would arise if cost-per-QALY data were actually used as an input into health policy
decisions. In the concluding section I attempt to reach an overall assessment of QALYs and the role of cost-
utility assessment methods in the allocation of health care resources.
2 The Development of Cost-Utility Analysis
Drummond (1989) has provided an informative and succinct outline of the main factors contributing to the
development of cost-utility analysis. He begins with the standard observation that because resources for the
provision of health care are scarce, choices need to be made in their deployment. While in many sectors of the economy resource allocation decisions are made through market mechanisms, market prices have a much more limited role to play in the allocation of health care services
(ibid, p.59). This is because numerous distortions in markets for health care mean that market prices are
unlikely to reflect very closely the true value of health care goods and services to society. The sources of
market failure include imperfect information, imperfect competition, and externalities. 1
The traditional (and still most commonly used) indicators of health service outputs include the number of cases treated, the number of successful treatments, and various measures of the community's health, such as life-
expectancy and mortality rates. Many of these are really measures of through-put rather than output, while others are too aggregated to function as effective indicators of the benefits of particular health programmes. In recent years there has been a proliferation of research in the field of output measures, however. A number of general scales of health outcomes have been developed, such as the Spitzer QL Index, the McMaster Health Index, the Quality of Wellbeing scale, and the Nottingham Health Profile (ibid, p.62). Potentially, these health indices can be used to assess and compare the impact of health
1. For example, consumers of health care frequently have quite limited information about the nature and quality of the care being provided and its likely effectiveness. The demand for health care is often
supplier-induced or at least shaped by supplier concerns.
Supply conditions do not resemble those in perfect
markets: instead there are geographical, regulatory and other barriers to entry and little or no competition between suppliers may emerge. An individual's health care consumption decisions may confer uncompensated costs or benefits onto other members of society.
-3-
interventions across a range of different diseases. In addition, the quality-adjusted-life-year (QALY) has been developed as a general-purpose unit of output
measurement. This measure combines data obtained from individuals on the overall utility of health states (or improvements in health states) with data on the life
expectancies associated with these health states, to form a single indicator of benefits received.
The concept of the quality-adjusted-life-year is at the core of the cost-utility analysis literature. The cost- utility approach can be best seen as a method of economic evaluation which differs from the more traditional
approaches of cost-benefit analysis and cost- effectiveness analysis in a number of respects.
In cost-benefit analysis, an attempt is made to value the consequences or benefits of health programmes in monetary terms. Programmes are evaluated by weighing the present value of the expected benefits against the present value of the expected costs. In cost-effective analysis, by contrast, no attempt is made to assign dollar values to the benefits of health interventions. Instead programmes with similar goals are ranked by comparing their costs per unit of output gained. Outputs are measured in the most appropriate natural or physical units, such as the number of life-years gained.
Because of the difficulties of expressing the more subjective and qualitative consequences of health care programmes in monetary terms, cost-benefit analyses in the health field have in practice tended to restrict themselves to a fairly limited range of benefits
(Drummond et al, 1987, p.3). This restriction on the scope of cost-benefit analyses can be seen as reducing their usefulness (ibid, p. 3). A limitation of the cost- effectiveness approach, on the other hand, lies in the fact that i t cannot be used to compare health
interventions across different types of diseases since the units of output are unlikely to be the same. Cost- utility analysis appears to offer a solution to both
these problems. The measurement of programme outcomes in terms of a "utility" unit - the quality-adjusted-life- year - circumvents the need to put dollar figures on these outcomes. Since the outcomes of most types of health care intervention can potentially be converted into the common unit of the QALY, widely diverse programmes which cater to the needs of heterogenous groups within the community can be ranked in terms of their cost per QALY obtained.
Advocates of the CUA approach suggest that i t can play a useful role in health sector resource allocation
decisions at a number of levels: as an input into
clinical decisions affecting individual patients; as an input into clinical policy decisions affecting groups of patients; and most importantly, as an input into
management decisions on the allocation of health funding
within regions or localities (Drummond, 1989; Gudex, 1986; Torrance, 1986; Williams, 1985 and 1988).
In the clinical context, decisions such as which
diagnostic tests to use and which treatment method to employ frequently involve trade-offs between extensions to a patient's life expectancy and improvements in their quality of life (antihypertensive drug therapy and
chemotherapy for certain types of cancer are examples of such treatment options). These decisions may also have to take into account some level of medical risk or
uncertainty about the exact effects of proposed treatments. The techniques developed for the construction of QALY indices involve a series of analytical steps which can be applied to clinical decisions of this nature.
As an illustration, Lane (1987) describes the application of the CUA strategy to a decision involving the choice of the best treatment procedure for a patient with gastric cancer. He outlines a scenario in which the surgeon and his patient are required to weigh up three treatment options which differ in their consequences for the patient's post-operative life-expectancy, his post- operative pain and discomfort, and the life-style adaptions which he will be forced to make. Lane
recommends the following decision procedure: a) list the possible options the patient may choose; b) for each option, list the possible consequences in terms of their implications for the duration and quality of the
patient's life; c) assess, for each possible
consequence, how likely i t is to occur, and its value to the patient; d) for each option, compute its expected utility by summing the utilities associated with each possible consequence of the treatment option, weighted by their respective probabilities of occuring. The
utilities used in steps c) and d) of the process are obtained directly from the patient, using one of the standard techniques that have been developed for this purpose (these are described below). Note that in Lane's application, no attempt is made to calculate the monetary costs of the different treatments or take these into
account. This, is typical of applications at the clinical level, and for this reason i t may be more accurate to describe them as examples of subjective expected utility analysis than as examples of cost-utility analysis.
Advocates of cost-utility analysis suggest that the technique can also be used as an input into clinical policy decisions which affect the care of groups of
patients, such as decisions regarding what drugs to stock in the hospital pharmacy, or whether to encourage day surgery for a particular medical condition (Drummond, 1989, p.61). Again, cost-utility analysis is seen as a way of assessing and weighing up relative impacts on patients' life expectancies and their qualities of life, while also taking into account cost considerations.
However, advocates see greatest scope for the application
-5-
of the technique in health policy decisions made at the local or central management level - decisions such as the balance of funding to be directed towards different types of care or to different care groups.
Economists such as Alan Williams, Michael Drummond, and George Torrance have proposed that information on costs- per-QALY-obtained be used to assist policy makers in assigning priorities among the wide range of health care activities that compete for funding. All else being
equal, the most desirable activities are those that yield the greatest gains in quality-adjusted-life-years per unit of expenditure. It is suggested that these
activities or procedures should be developed first (Gudex, 1986, p.15), or that currently allocated resources be redeployed at the margin towards these
activities (Williams, 1985, p.329). Sackett and Torrance (1978), Williams (1985) and Gudex (1986) have gone as far as publishing "league tables" giving cost-per-QALY
estimates for such disparate treatments as kidney
transplantation, haemodialysis, hip replacement, surgical treatment for scoliosis, and coronary artery bypass
grafting (see Appendix I for an example). They stress that these figures are indicative only, for the exact costs and benefits gained will vary according to the characteristics of the patients undergoing treatment and those of the institution treating them (Gudex, 1986, p. 12) •
3 The Construction of Quality-Adjusted-Life-Year Indices
In cost-utility analysis, "utility" refers to the value or worth of a specific health status to the person
experiencing it. I t is assumed that utility can be
gauged from the preferences that individuals or groups of individuals express for these health states (Drummond et al, 1987, p.13). The aim of the utility measurement process is to obtain a single value for each of the health states that are of interest, on a cardinal scale
(which may have interval or ratio measurement
properties). Usually the scale is standardised so that
"dead" is equal to zero and "perfect health" is equal to one, and the utilities associated with states of i l l - health fall somewhere in between.
The utility values thus obtained are then used in
combination with data on the duration of time to be spent in a particular health state to derive a "quality-
adjusted-life-year" value. To give a simple example, suppose that a value of 0.75 is assigned to the health state enjoyed by a post-operative patient. The operation extends the life of the patient by two years. Then the QALYs obtained by the operation equal 0.75 x 2
=
1.5.There are two basic approaches to obtaining utility values: either to find people with the health state and measure their subjective utility for the condition, or to
-6-
describe the condition, using a written scenario, to people who do not have the condition and measure their hypothetical subjective utility for i t (ibid, p.115). In the latter approach members of the public may be used, or alternatively health professionals who already have some knowledge of the health states concerned. Drummond, Stoddart and Torrance argue that since most cost-utility analyses are conducted from the societal viewpoint and are pertinant to public policy decisions, the appropriate utilities are those of (informed) members of the general public (ibid, p.115). Informed means that the
respondents truly understand what the health state is like, which suggests that the descriptions should contain a reasonable amount of detail (ibid, p.116).
While at least five measurement methods have been developed, three methods are most popular: the rating scale, the time tradeoff approach, and the standard
gamble. These methods are outlined in detail by Drummond et.al (1987) and Torrance (1986, 1987). A typical rating scale consists of a line on a page with clearly defined endpoints. The most preferred health state is placed at one end of the line and the least preferred at the other end. The respondent is asked to locate the remaining health states in between, in such a way that the
intervals or spacing between them correspond to (and are proportional to) his or her feelings about the relative differences in the desirability of these states (Drummond et al, p.125; Torrance, 1986, p.18-19). It is important that the durations of the health states being ranked are the same. For example, chronic states, which are
considered to be permanent from the age of onset to the age of death (dates which are specified to the
respondent), can be ranked in one batch. Temporary health states must be ranked separately, and on the assumption that their duration is the same. Procedures have been developed to convert the utilities for h~alth states of different durations onto a common scale.
The standard gamble approach is based on the von Neumann- Morgenstern theory of expected utility maximisation. It draws upon methods that have been widely used in other fields of research concerned with decision making under 2. Such a procedure is described in Drummond et al
(1986, p.126). Suppose that utility values must be obtained for several chronic health states and several temporary ones. The interval preference values for the temporary states must be transformed onto the standard o- 1 health preference scale used to rank the chronic
states. This can be done by redefining the worst temporary health state as a chronic state of the same duration, and measuring its preference value with the technique used for chronic states. The values of the other temporary states can then be translated into values on the standard 0-1 scale by a positive linear
transformation.
-7-
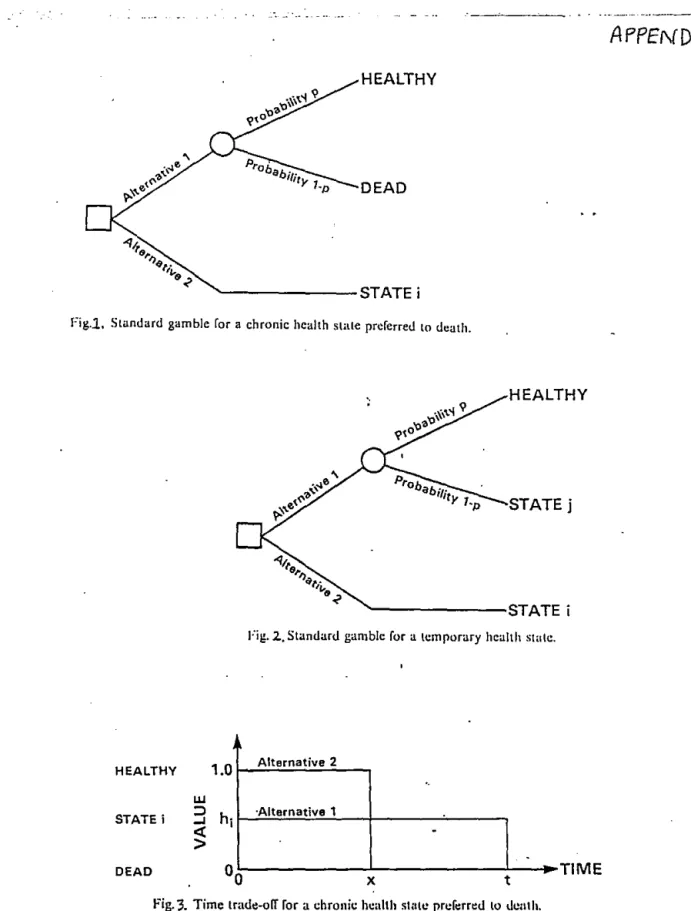
uncertainty. In a typical standard gamble the respondent is offered two alternatives (see Figure 1 in Appendix II). Alternative 1 is a treatment with two possible
outcomes: either the patient is returned to normal health and lives for an additional t years (with probability p) or the patient dies immediately (with probability 1-p).
Alternative 2 has the certain outcome of a particular chronic health state, state i, f o r t years. Probability p is varied until the respondent is indifferent between the two alternatives, at which point the utility value for health state i is simply p. Since most people cannot readily relate to probabilities, the standard gamble
method is often supplemented with the use of visual aids (Drummond et al, p.126; Torrance, 1986, p.20).
While this is the basic format of the standard gamble method, variations are possible. For example, i t is not essential that the two outcomes of the gamble are healthy and dead. When preferences for temporary health states are being measured, intermediate states i are measured relative to a gamble involving the best state (healthy) and the worst state (temporary state j) (see Figure 2 in Appendix II). The utility value for state i is given by the formuala hi=p+(l-p)hj where hi is the utility of the state being measured, ana hj is the utility of the worst state (Drummond et al, p.127; Torrance, 1986, p.21). If these values are to be converted to values on the
standard 0-1 utility scale for chronic health states, then j must be redefined and measured on this latter utility scale, giving a value for hj which can then in turn be used to obtain the values for the'hi (Torrance, 1986, p.22).
The time tradeoff approach was developed specifically for use in health care by Torrance, Thomas and Sackett
(1972). The respondent is offered two alternatives (see Figure 3 in Appendix II). Alternative 1 is chronic state i for time t (representing the life expectancy of an
individual with the chronic condition) followed by death.
Alternative 2 is to be healthy for time x<t followed by death. Timex is varied until the respondent is
indifferent between the two alternatives, at which point the utility value for state i is given by hi=x/t.
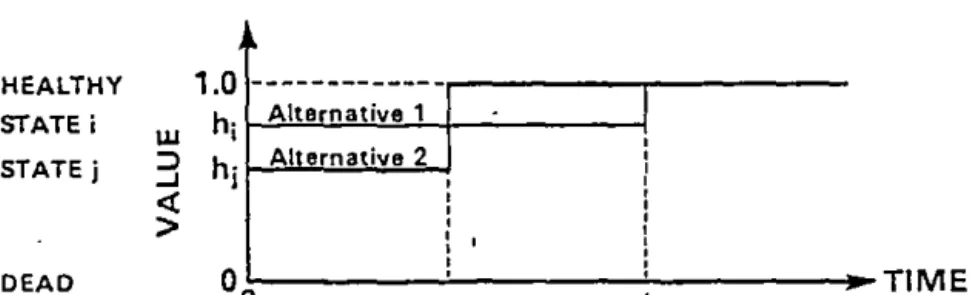
Preferences for temporary health states can be measured relative to each other using a similar approach, in which intermediate states i are measured relative to the best state (healthy) and the worst state (temporary state j)
(Drummond et al, pp.128-9; Torrance, 1986, p.23). In this situation, time x is varied until the respondent is indifferent between the two alternatives, at which point the utility value for i is given by hi=l-(1-hj)x/t (see Figure 4 in Appendix II).
Once utility values have been obtained using one of the three techniques, they are converted into daily
equivalents and used as weighting factors in conjunction with life-expectancy data to calculate the quality-
adjusted-life-years yielded by particular health
interventions. If a health care programme does not
extend a patient's life but simply improves its quality, then the relevant QALY measure is obtained by taking the difference between the utility value that applies given the intervention and the utility value that would apply without it. This value is then applied as a weighting
factor to the time period over which the health care programme is expected to have its effects.
In policy applications, the QALYs yielded by alternative health care interventions are combined with cost data to obtain cost-per-QALY ratios. The usual approach is to discount QALYs that are gained in future years at the same rate at which the costs are discounted. For
example, suppose a home dialysis programme leads to an eight-year extension to a patient's life and the mean daily utility of their health state during this period is 0.65. Then the intervention achieves a gain of 0.65 x 8
=
5.2 QALYs, or using a 10 percent discount rate, 3.8 QALYs (Drummond, 1986, p.138). If the cost per year of home dialysis is $10,000, the total cost of the homedialysis programme, discounted at 10 percent, is $58,684, and the cost per QALY obtained, in current dollars, is
$15,443.
In this section, I have described the techniques used to obtain utility values for a cost-utility analysis at their simplest. The methods used in practice are often more complex. Some of the possible extensions of the basic techniques are described in section 4.
4 OALYs and Utility Theory
Any research programme that sets out to measure
individual utilities must by necessity make a number of assumptions about the nature of individual preferences.
Some of these assumptions are quite general. For instance, i t must be assumed that individuals have preferences among alternatives that are sufficiently stable, orderly and well-structured for them to be represented numerically. It must also be assumed that these preferences are well-structured and stable enough for the numerical representation to be unique, once the value scale has been chosen (Cox, 1986, p.115).
Much of the cost-utility literature also makes the
somewhat stronger assumption that individual preferences can be elicited by means of a hypothetical lottery or tradeoff. In the time tradeoff approach, i t is assumed that individuals are able to equate the certain prospect of living Y years in less than perfect health with some other certain prospect of living X years in full health.
In the standard gamble approach, i t is assumed that individuals are able to equate t years of less than
perfect health with a lottery involving a most preferred alternative with a probability of panda least preferred alternative with a probability 1-p.
Utility theory in general is founded upon these
assumptions. However, they have not gone unchallenged, and a research programme that is so centrally concerned with the measurement of utilities cannot avoid being scrutinised in the light of the more general critique.
Is i t really valid to proceed on the basis that individuals have well-formulated and consistent
preferences, which are stable and exist independently of the measurement process? This broad question provides a backdrop to my evaluation of the specifics of cost-
utility analysis, and I will return to i t at various points in the discussion.
In addition to the premises that are common to utility theory, the literature on cost-utility analysis makes a number of much more specific assumptions about the nature of individual preferences, whether explicitly or
implicitly. In section 4.1, I look at some of the
"models" of individual utility that have been proposed or assumed to hold in the literature on QALYs, and their implications. For instance, an individual's rate of tradeoff between additional healthy years and additional years in a less than healthy state is often required by the underlying model to be constant and proportional.
Some models assume risk neutrality on the part of all individuals, while others allow for different attitudes towards risk. When risk attitude is incorporated, i t is usually taken to be a constant factor, which does not alter as the number of years involved in the health states under assessment are altered. In addition, an individual's attitude to risk has usually been assumed to be independent of the decision process through which he or she assigns values to different health states.
If these assumptions are reasonably accurate, then we can be confident that the maximisation of QALYs will
maximise, or at least raise, individual utility. The empirical evidence suggests, however, that individual preferences do not always satisfy the properties assumed.
Some of this evidence is reviewed in section 4.1.
In section 4.2, I look in more depth at the processes through which people actually assign values or rankings to alternative health states, and the manner in which these values have been captured in the theoretical and empirical work.
In section 4.3, I consider two closely related theoretical and measurement issues: individuals'
attitudes to risk, and individuals' subjective rates of time preference. There is little consensus in the
literature on how to deal with these dimensions of health preferences.
Once utility values have been obtained for a sample of individuals, they can be combined to derive the
"collective" utility values required for health policy analyses. Most researchers have used a simple averaging
method at this point, assuming that each individual's valuation should have equal weight in the social utility function. In section 4.4, I consider the validity of this and other possible methods of aggregation.
The estimation of "collective" utility values also raises issues concerning the choice of a population or
populations from which to draw the relevant data. Whose utilities should we measure in deriving these
"collective" values? Should the choice of a population depend on the uses to which the "collective" utility values are likely to be put? These issues are also considered in section 4.4.
4.1 Implicit Models of Individual Preferences
Miyamoto ahd Eraker (1985), building on work of Pliskin et al (1980), have considered the question of what types of utility function consistent with standard economic theory might serve best as a representation of the QALY concept. They suggest the following functional form:
U(Y,Q) = bYrH(Q)
where utility depends upon expected survival duration, Y, and health status, Q. The function H(Q) measures the utility of survival in health state Q (as a proportion of the utility of survival in perfect health). Most simply, H(Q) is equal to (X/Y), where Y is the number of years of less than perfect health that the individual considers to be the equivalent of X years of life in perfect health
(they are indifferent between the two).
The parameter b i s a scaling constant chosen so that the uti-lity indicies lie in some convenient range. The
parameter r represents the individual's attitude to risk in gambles involving the duration of time to be spent in a particular health state. Suppose an individual faces a choice between 10 years in a given health state and a 50- 50 lottery of 5 or 15 years in the same health state. If that person prefers/is indifferent to/disprefers the
expected time equivalent of the lottery to the lottery itself, then he or she is exhibiting risk averse/risk neutral/risk attracted behaviour, respectively (Gafni and Torrance, 1984, p.442). Thus, a risk averse person would prefer the certainty of 10 years to the lottery. Risk aversion holds if the value for r is less than one; risk attraction, if i t is greater than one.
If b=l and r=l (indicating risk neutrality) utility is simply the expected length of life multiplied by a factor indicating the utility of survival duration in a
particular health state. Miyamoto and Eraker show that even if r is not equal to 1, utilities and QALYs (as they are most often calculated) will correspond as long as H(Q) = (X/Y)r (ibid, p.196).
Some researchers in the field, such as McNeil et al (1978, 1981, 1982) and Miyamoto and Eraker themselves, have measured QALYs for individual patients in a manner that is consistent with Miyamoto and Eraker's functional form. McNeil et al used the certainty equivalent method to estimate the survival risk attitudes of each of the patients in their sample, independently of the
measurement of preferences for alternative health states.
More often however, attitude to survival risk is simply ignored. The time-tradeoff technique and the rating scale, as developed and used by Torrance and others
(Torrance et al, 1972; Boyle et al, 1983; Williams, 1985), involve "choice under certainty" and do not make any allowance for individual risk factors (or
alternatively, they implicitly assume that everyone is risk neutral and r=l). The methods of these authors imply that individuals' utility functions take the simpler form of U(Y,Q) = bYH(Q). Whether or not an individual's attitude to survival risks is indirectly captured by the standard gamble technique is a matter that is contested in the literature (see for example, Richardson, 1989, p.23).
I will return to the issue of correctly modelling
individuals' risk attitudes below. Leaving i t aside for the moment, let us look at what the functional forms considered above imply about the properties of
individuals' preferences.
Firstly, the functions are multiplicative. This means that while utility is an increasing function of both survival duration and health quality, the function that assigns utility to survival years operates independently of the function that assigns utility to health states of different quality. Moreover there is a constant
proportional tradeoff between the two (Miyamoto and Eraker, p.196; Loomes and Mckenzie, p.300). An
individual who regards 12 years in excellent health as equivalent to 15 years in their current state of health must also regard 4 years of excellent health as
equivalent to 5 years in their current health state (Loomes and McKenzie, p.300). If an individual is prepared to "sacrifice" some proportion of their remaining years of life in order to achieve an
3. This equivalence can be most readily seen in the case of utility values obtained via the time tradeoff technique. The utility of chronic health state i is found as x/t, where x represents the time spent in
perfect health before death (equivalent to Miyamoto and Eraker's X) and t represents the time spent in the
inferior health state i (equivalent to Miyamoto and Eraker's Y). Equivalence will also result from the
standard gamble method if the selected probability p for health state i is equal to (X/Y), and by the rating scale method if the utility selected by the respondents also equals (X/Y) •
improvement in their health status, then the terms of the tradeoff are constant and independent of the absolute number of life years involved.
There is empirical evidence that individuals' choices do not always obey either the independence principle or the constant proportional tradeoff property. For.example, Sackett and Torrance (1978, p.701) found that the mean daily utility values which people placed on health states varied substantially according to the expected duration of these health states. McNeil et al (1981, p.986) found that their respondents were only willing to trade
longevity for an improvement in health status when the absolute length of time to be spent in the inferior
health state·(involving impaired speech) was greater than five years. When contemplating periods of less than five years, they were unwilling to sacrifice any weeks or
years of their life span in return for an improvement in health. These results suggest that the rate of tradeoff between alternative health states is not independent of the number of years involved in the tradeoff.
Mathematically, if H(Q) is a function which gives an
index of mean daily utility, then H(Q) is a function of Y as well as Q.
Secondly, one interpretation of the Miyamoto and Eraker functional form is that the value of r (the parameter for risk attitude) is independent of health state (Loomes and McKenzie, 1989, p.301). The independence of risk
attitude from health state requires that if an individual was faced with two prospects involving the same
probability distribution of length of life, but a different health state (where H(Q)1
=
dH(Q)2), the certainty equivalent length of life would not be affected. Formally, ifthen
(Yeh, 1)."-' (Y1h, p; Y2h, 1-p) (Yedh, 1) rv (Y1dh, p; Y2dh, 1-p) where Yeh is the certainty equivalent of the risky prospect involving the two health states Y1h (with a probability of p) and Y2h (with a probability of 1-p).
While there do not appear to be any studies that have tested this assumption, intuition suggests that an
individual's subjective feelings about the health state they are assessing may well affect their attitudes
towards the probabilities of survival in a gamble involving that health state.
Thirdly, the functional form implies that the individual utility function exhibits a constant proportional risk attitude (ibid, p.301). A constant proportional risk attitude with respect to survival duration requires that changes in the expected survival duration of a health state will lead to proportional and constant changes in the individual's certainty equivalents. Formally, this means that if:
then
(Yeh, 1)1'-' (Y1h, p; Y2h, 1-p) (dYeh, 1)
rv
(dY1h, p; dY2h, 1-p).This is equivalent to saying that the utility function has a consistent shape, which is either concave, convex, or linear. Again, direct evidence on this assumption from the health field is sparse. Reporting on the
results of a study of 14 lung cancer patients, McNeil et al (1978, p.1399) give evidence of two individuals whose utility functions for survival years definitely did not meet this criteria. These individuals were risk seeking
in the first few years of the survival period under
consideration and risk averse in later years. Mehrez and Gafni (1987, p.374), on the other hand, found that risk aversion was common for shorter periods of time, while risk seeking behaviour arose most often when the length of time over which utility was assessed increased. They suggest that individuals will opt to participate in risky treatments only if the results are far in the future.
As Loomes and McKenzie note, there is plenty of evidence against the assumption of a constant proportional risk attitude-within the broader literature on decision making under uncertainty, in which uncertainty relates to wealth or income rather than years of survival. It appears that many individuals display both risk-attracted and risk-averse behaviour in different contexts, and in relation to different amount of income (Friedman and Savage, 1948).
As a starting point for our analysis, the Loomes and McKenzie critique suggests that i t may be misleading to think· of individual preferences over health states in terms of a rather simple utility model such as that
proposed by Miyamoto and Eraker (with or without the risk parameter). The utility model chosen as a theoretical basis for CUA may need to be-rather more complex if i t is to take into account the interdependencies identified by Loomes and McKenzie.
I t is also worth remembering that even if the model
proposed by Miyamoto and Eraker is a valid representation of the utility of some individuals, we cannot assume that the values of the parameters within i t will remain stable over time. This point is often overlooked in the
literature. Miyamoto and Erkin (1985, p.201) give evidence that the older members of their sample of 46 patients with coronary artery disease were on average more risk averse than the younger members, suggesting that people's attitudes to survival risks may alter as they age or enter different life-cycle stages. They also found a relationship between age group and the estimated values for H(Q), suggesting that the perceived severity of angina increases with age (ibid, p.201). Thus the individual utility function, if i t exists, may be shifting over time.
4.2 The Valuation of Health states Let us look more closely
Eraker's function H(Q).
values to health states?
meaningful way is at the analysis method.
at the nature of Miyamoto and How do people actually assign
Capturing these values in a heart of the cost-utility-
The three basic methods of measuring utility values
(described in section 3) each measure somewhat different things. The time tradeoff gives, by definition, the number of healthy years that are equivalent to a stated period in the health state being measured. The unit of outcome is the healthy-year equivalent • . I t has both an interval and a ratio property: that is, there is a clear meaning to the statement that six healthy-year
equivalents are double three healthy-year equivalents (Richardson, 1989, p.16).
By contrast, neither the rating scale nor the standard gamble result in an outcome that is an easily understood unit. The rating scale gives a distance along a
calibrated linear scale that a subject believes indicates the value or worth of a health state relative to the
reference points on the ends of the scale. The
functional relationship between the units of the scale and welfare, utility, or the acceptable tradeoff with healthy years, is unclear (Richardson, 1989, p.17). The standard gamble is intended to measure utility in the van Neumann-Morgenstern sense (i.e., i t measures "utility" as defined by the axioms of that theory). The result of the standard gamble is the probability p which makes the
respondent indifferent between a certain and a
probabilistic choice. P is then converted by the analyst into a value on a utility index. I t has been suggested that van Neumann-Morgenstern utility can be
conceptualised as "the outcome of a mapping function which incorporates the van Neumann-Morgenstern axioms of rational choice" (Richardson, 1989, p.18). While this explains how van Neumann-Morgenstern utilities are
derived, i t is not an easy concept to convey to decision makers or members of the public.
Not surprisingly, the three methods do not yield consistent risults when administered to the same individuals. For theoretical reasons, we would not expect the outcome of the standard gamble to be exactly the same as the outcome of the time tradeoff or the rating scale. Since i t is based upon gambles, an individual's attitudes towards risk may influence the preference ratings recorded. However, we would expect there to be a systematic relationship between the results of the standard gamble and the results of the other two 4. Appendix III summarises the main objectives and design features of the empirical health preference studies that are cited in this paper.
measures, for each individual (for example, they might be related by a power transformation).
Torrance (1976) compared the standard gamble, time tradeoff and category rating methods on a sample of
college students. He found a correlation of 0.65 between individual ratings obtained with the standard gamble and individual ratings obtained with the time tradeoff, and a correlation of 0.36 between the standard gamble and the category rating results (ibid, p.133). In a more
detailed and rigorous comparison, Read et al (1984) found that standard gamble ratings were systematically higher than time tradeoff ratings, which in turn were
systematically higher than category scale ratings
(p.322). This ordinal relationship (SG>TTO>CS) held for 43 of the 60 respondents but not for the other 17.
Moreover, the differences between the utility values
generated by the three methods were large. On a scale of 0-100, the mean value for one health state (moderate
angina) as measured by the standard gamble was almost 20 points above the mean value given by category rating;
while the mean value given by the standard gamble for another health state (severe angina) was 35 points higher than that given by category rating (ibid, p.322). The tendency for the standard gamble to give systematically higher values than category rating was confirmed in another study by Llewellyn-Thomas et al (1984, p.547).
These studies have shown that the values given by the three methods are not simply mathematical transformations of each other.
Another set of studies examined the impact of changes in the formulation and wording of health state choices upon the utility values elicited. Sutherland et al (1983, p.485) showed that the numericai values assigned to health states by a group of patients using the rating scale method, were influenced by the choice of anchors
(endpoints) on the scale (the alternatives used were perfect health and death, perfect health and some other health state, and death and some other health state).
Llewellyn-Thomas et al explored the impact of variations in the descriptions of health states given to
respondents. They found that descriptions which were brief and impersonal consistently received higher utility ratings than descriptions that were more detailed,
compiled in a narrative format, and phrased in the first person (1984, p.547).
The standard gamble technique appears to be particularly vulnerable to measurement effects, perhaps because of its complexity. There is a considerable literature on the properties of the standard gamble documenting the
"biases" introduced into the results by variations in the way that the standard gamble is formulated (see, for
example, Hershey et al, 1981). Some of these
"measurement" effects have been documented in the health field. Participants in a study by McNeil et al (1982), for example, were found to have different preferences
over surgical as opposed to nonsurgical treatment options according to whether the expected outcomes were described in terms of the probability of living or the probability of dying (p.1261).
In view of these research results, i t is hardly
surprising that many analysts in the field have had to question their understanding of what is being measured.
Llewellyn-Thomas et al conclude that "it may be naive to think of any state of health as possessing a single
utility or value" (1984, p.550). According to McNeil et al, "individuals do not have constant preferences for different states of health, but rather preferences that depend on the alternatives available" (1982, p.1263).
Most revealing is the comment by Read et al who tell us that "rather than conceiving of preferences as fully formed mental entities that wait to be "elicited" from the psyche, we prefer to think that people construct
[their] preferences using the tools provided in the value assessment task" (1984, p.326).
The difficulties that have been encountered in the measurement of health utilities parallel closely
difficulties associated with the measurement of utilities in other research fields. These common problems point to the fact that the most fundamental postulate of utility theory - the idea that individuals do in fact have
preferences among alternatives that are well-defined, consistent, stable, and independent of the measurement process, is really an idealisation (Cox, 1986, p.116).
A growing body of psychological research is providing grounds for rejecting this idealisation. Psychologists such as Fischhoff, Tversky, Kahneman and Fischer have attempted to explore the ways in which "subtle aspects of how problems are posed, questions are phrased, and
responses are elicited, have a substantial impact on judgements that supposedly express people's values"
(Fischhoff, Slovic and Lichtenstein, 1980, p.118).
A widely-cited article by Hershey, Kunreuther and
Schoemaker (1982) on the biases associated with gamble- based utility elicitation methods is a good example of this literature. The authors show, among other things, that the probability and outcome levels used in reference lotteries introduce systematic biases; that the utility values obtained differ according to whether lotteries are conducted over the domain of gains or the domain of
losses; and that context or framing differences (differences in the way in which the choices are
presented to respondents) strongly affect decisions in a manner not predicted by the theory.
Irrelevant details of the measurement process can also shape the judgements elicited by measurement methods that do not depend on lotteries. There is a large literature in psychology on issues such as scaling artifacts.
Poulton (1979) reviewed this literature and summarised
five stimulus and response-mode biases that can affect the measurement of preferences. Examples are centering effects (respondents like to use the middle of a given scale) and spacing effects (respondents like to space responses over the whole scale, no matter what the
anchoring points are). Other effects arise from certain anchoring and adjustment processes in respondents'
responses to value and utility questions, from the influence of information previously or simultaneously presented, from numerical versus nonnumerical
presentation of information, and so on.
Fischhoff et al (1980) contend that preferences are most likely to be unstable when people do not know what they want. In such cases, the experimenter can influence the respondent by controlling problem formulation or the respondents' confidence in his or her judgments. From another perspective, i t has been suggested that people may have pieces of preferences rather than fully coherent ones (Fischhoff and Cox, p.67). If forced to make an evaluative judgement, they engage in an exercise in inference. That inferential process is most likely to produce reliable and consistent results when individuals have the opportunity for thoughtful assessment of the alternatives, when they are familiar with the terms in which the issues are formulated, when there are no major conflicts among their basic values, and when the
alternatives do not involve overwhelming complexity and detail (ibid, p.67-8). Requiring greater precision in a decision than people would normally muster in their evaluation of alternatives is likely to produce
inconsistencies and measurement artifacts (ibid, p.67).
The psychological literature offers a number of insights for the measurement of health state utilities, I believe.
First, i t is an unfortunate fact that utility functions are never constructed without some error or bias (van Winterfeldt and Edwards, 1986, p.215). Such errors or biases should not be seen simply as examples of failures
in the measurement process for they also reflect in part the nature of preferences themselves. Questions and options must be posed in some manner, and that manner will affect the response, for .the process of measurement does not merely elicit individual preferences but (in some instances) creates or shapes them.
Second, recent experiments have indicated that the
"errors" associated with different procedures for
eliciting utility functions are quite sizeable. Third, i t is not the case that gamble-based or indifference
methods of eliciting utilities, which require respondents to indicate their preferences between alternatives but do not require them to judge the strength of their
preferences directly, are more reliable, accurate or trustworthy than methods which do require respondents to indicate their strength of preference (such as the rating scale) (ibid, p.211).
If these insights are correct, then i t is reasonable to ask if the products of the utility measurement process, as i t is typically carried out, are really valid and reliable enough to serve as a useful basis for guiding public decisions. There are at least two possible lines of defence for methods of economic evaluation based upon utility measurement.
First, the proponents of cost-utility analysis have argued that the precise utility values assumed do not always have much impact on the overall results of an economic evaluation (Drummond, 1987, p.615). Other factors, such as the range of costs and consequences included in the model, or the methods of estimating costs, may have a more profound influence on the
findings. Sensitivity analyses can be carried out to ascertain how sensitive study results are to changes in the utility values assumed. While this line of defense is reasonable as far as i t goes, there are bound to be circumstances in which the precision of the utility values used is important.
Second, i t can be argued that even though there is nothing unique or absolute about any particular representation of an individual's health state preferences, measurements of preferences can be
illuminating if they are carefully and sensitively
carried·out. Proponents of this line of thinking would not condemn the QALY measurement process as futile but would look to the development and use of methods that are likely to increase the reliability and validity of the scores obtained. For instance, techniques have been developed by psychologists to control the extent and direction of scaling biases, through the careful choice of anchors on a scale, response options, the wording of instructions to respondents, and the like. The
researcher can encourage self-exploration on the part of the respondent and avoid forcing choices upon them. He or she can carry out consistency checks by comparing the elicited ratings against each other, and seek to
determine whether apparent inconsistences are the product of errors or measurement artifacts, or genuinely reflect the respondent's views.
The analyst can also seek to validate the results of one measurement,instrument by comparing them with those of another. It may make sense, for example, to check the results obtained via a rating scale with those obtained by an indiff~rence method, such as the time tradeoff.
Finally, the analyst can compare the choices between the various health states that are implied by the
individual's expressed preferences with the decisons they would make in direct choices between those alternatives
(Loomes and McKenzie, 1989, p.307).
These strategies would, I believe, improve the validity and reliability of the utility measurement process. They would not transform the accuracy of measurement to the
extent that one could have unqualified confidence in the point estimates of utility obtained, however. One of the lessons of the psychological literature is that point estimates can at best only provide "rough guides" to the true state of preferences. I would feel more confident about the use of health preference utilities in public decision making if analysts confined themselves to using only intervals or ranges of utility values in their cost- utility assessments.
But if only ranges of utility values are to be used, then is high-quality measurement really that important? The measurement approaches I have described would raise the costs of doing cost-utility studies, perhaps by a
significant amount.
As an alternative, researchers could simply use their own judgement and the available medical information (or the judgement of medical experts) to assign plausible utility values to health states, and then undertake extensive sensitivity analysis of the results. Weinstein (1981) has followed this approach. In an analysis of the economics of hypertension therapy, for instance, he hypothesises that the side effects of the therapy may reduce patients' quality of life by 1%, 2% or 5%. His analysis shows how the overall cost-effectiveness of hypertension treatment varies in accordance with these assumed values (1981, p.325).
The "judgemental" approach to assigning utility values offers considerable cost savings, coupled with what may in practice be a relatively minor loss of validity. It is particularly suited to the analysis of treatments whose impact on patients' life quality is relatively small, since the range of variation in assumptions about quality-of-life effects will tend to be smaller.
Problems are more likely to arise in the assessment of utility values for treatments with large or uncertain effects upon life quality. Another potential drawback of the "judgemental" approach is that decision makers might not regard the utility values and QALY indicators
obtained as being as convincing as those based on field measurements.
4.3 Attitudes to Risk and Time Preferences
The basic rationale for incorporating a risk factor into the utility function lies in the idea that the survival durations associated with many health-states are
uncertain. In choosing between alternative health states or alternative health treatments, individuals must weigh up the relevant survival probabilities. It follows that differences between individuals in attitude to risk will lead them to assign different utility values to the same states of health, and make different choices between alternative health care treatments when the short and long-term survival probabilities associated with these treatments differ. The possible extent of individual
variability in attitudes to survival risk is illustrated by Miyamoto and Eraker's data on the preferences of
coronary artery disease patients (1985). The estimated values of r for the individuals in their study ranged from a minimum of 0.23 to a maximum of 12.95 (ibid, p.203).
Miyamoto and Eraker show that.if attitude to risk is incorporated into an analysis of the. expected utilities of alternative treatments for these coronary patients, the optimal choice of treatment may alter. Preferences that are risk averse with respect to survival will be more.favourable to treatments that yield a higher
probability of short-term survival than preferences that are risk seeking. Because coronary artery bypass surgery has a higher risk of immediate (operative) mortality than does medical treatment, coronary artery bypass surgery is increasingly favoured as r increases, while medical
treatment is increasingly favoured as r decreases (ibid, p.204). The authors contend·that clinical decision
analyses carried out for such patients on the assumption that they were risk neutral would lead to biased results
(p.207).
McNeil et al demonstrate the same point in their research on the preferences of throat and lung cancer patients
(1978, 1982). Incorporating the risk attitudes of patients with lung cancer into an expected-utility analysis of the treatment alternatives (surgery and radiation therapy) led to the finding that radiation
therapy was the optimal treatment for a higher proportion of patients than the proportion actually receiving i t
(1978, p.1401). In another study (1982), the risk attitudes of patients with throat cancer also had a significant influence on the expected utilities of
surgery and radiation therapy respectively (with similar implications for the optimal treatment choice).
In section 4.1, the method used by Miyamoto and Eraker to incorporate risk attitude into the individual utility function was described, and a number of problems with this particular approach were noted. While some health researchers have adopted the model proposed by Miyamoto and Eraker, there may be other and perhaps more adequate ways of conceptualising risk attitudes.
Gafni and Torrance (1984) have suggested that the risk attitudes individuals display when making choices between alternative health propects can be broken down into three
(causal) effects: a quantity effect, a gambling effect, and a time preference effect. Consider an individual who is offered various durations of life extension in a
chronic state of disease. If the individual prefers the expected duration of a 50-50 lottery (involving X1 and X2 additional years of life in the chronic illness) to the lottery itself, he or she is risk averse and has a
concave utility function over X (time). There are three possible explanations for this behaviour.
First, the individual may assign a diminishing marginal value to each additional unit of X (time). This can be termed the quantity effect (ibid, p.445). Its presence might reflect the fact that he or she grows increasingly weary or satiated with a situation over time. As an example, many people would view a single day of bed confinement as having a greater value than a day of bed confinement that followed 100 previous days. Second, the individual might dislike gambles intrinsically and
therefore require a risk premium to compensate them for the act of gambling. This can be termed the gambling effect (ibid, p.443). Third, the individual may have a positive time preference, and prefer a health gain
received earlier over one received later. Time spent in the (X+l)th month of a "good" health state is valued less than time spent in the Xth month (ibid, p.444). An
individual's risk averse responses to conventional lottery questions can be the result of any of these effects acting singly, two or more of them acting together, or even two or more acting in opposing
directions but with the effect(s) operating in the risk- averse direction being dominant (ibid, p.445). 5
Gafni and Torrance suggest that the three effects can be represented by the following exponential utility
function:
Uy(t)
=
k1+ k2e-(b+r+g)tUy(t) denotes the utility (as viewed now) of being in health state y f o r t units of time. k1 and k2 are
scaling constants. The risk aversion parameter has three components. b represents contributions given by the
quantity effect; r represents contributions from the time preference effect; and g represents contributions from the gambling effect (ibid, p.447). Gafni and Torrance point out that time preference with a discount rate r operating alone can give identical results to a
constantly risk averse utility function with risk paramenter r.
In a given situation, there is no reason why these effects ought to behave in any systematic way. The
5. There is empirical evidence of satiation and/or time preference effects in relation to health state
preferences. Sackett and Torrance (1978) used non-
probability (indifference) methods to measure the health state preferences of a general population sample. They show that the mean daily utilities assigned to particular health states were influenced by the duration assumed.
For example, hospital dialysis lasting for three months received a mean daily utility of 0.62; hospital dialysis lasting for eight years was given a utility of 0.56; and when assumed to last for a lifetime, i t was given a
utility of 0.32 (ibid, p.701).
magnitude and even the direction of the effects may change for different values o f t . For example,
individuals may prefer a life of "normal" length to a very long life, particularly if they are in a severely disabling health state. The quantity effect in this case would be initially positive (more is better) but at large values o f t i t would become negative (more is worse)
(ibid, p.445). Similarly, there is no reason for the time preference to follow a constant discount rate. An individual may simply consider some periods of his/her life to be more important than others and therefore assign them different discount rates (ibid, p.445).
Finally, the direction of influence may also depend on whether health state y is considered to be a "good" or a
"bad".
As noted in section 4.2, Miyamoto and Eraker (1985) and McNeil et al (1978, 1981) chose to measure risk attitude independently of health state utilities, using a standard gamble defined over alternative prospects of healthy
years. An implication of Gafni and Torrance's model, however, is that risk attitude and the utility of a health state are not independent of each other. Risk attitude is in some ways specific to the health scenario under consideration, and therefore we will need to
measure i t in conjuction with our measurement of the utility of each health state.
A second implication is that unless a special effort is made to decompose the "risk" factor that gives the
utility function its particular curvature, there is no way of knowing whether i t incorporates a sizeable
component of time preference effects. When utility measures do incorporate time preference effects, distortions will be introduced if the aggregated utilities that are compiled from these individual utilities are then discounted on an across-the-board basis (the usual practice). The correct procedure is to a) have each individual assess their own value for a time stream of health consequences, using their own private discount rate(s), and b) aggregate values across
individuals (Cox, 1986, p.146). The comparison of streams of health benefits and costs occurring over different periods is a fundamental element of cost- utility analysis, and yet i t appears that benefits and costs are frequently not discounted in a consistent manner. Some of the social utility values reported in the literature may be based upon individual utility assessments that incorporate time preference judgements, while others are not.
Time preference is likely to be a more important factor in relation to chronic health states than in relation to acute illnesses. Gafni and Torrance suggest ways in which time preference and gambling preference can be
independently measured, to enable an assessment of their contribution to the overall risk effect. Time preference can be measured by asking conventional time preference