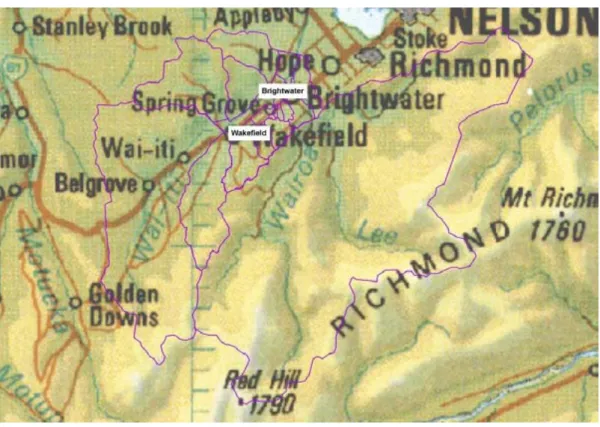
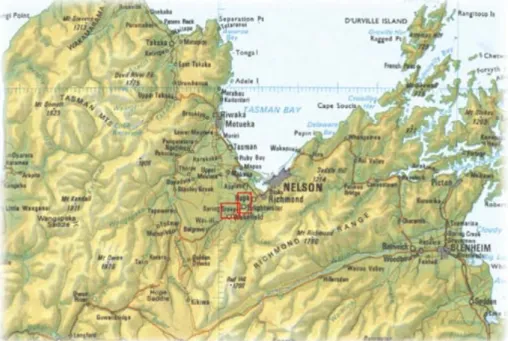
Sinclair Knight Merz was engaged by the Tasman District Council (TDC) to carry out a flood hazard modeling study for the Wai-iti and Wairoa rivers in the Brightwater and Wakefield area. A few miles north of Brightwater, the river merges into the Wai-iti before draining a further 9 km to the sea. At its source, the Wai-iti catchment rises to 1340m and then drops steeply through a forested area to 300m before traveling a further 10km downstream to Wakefield at 75m above MSL.
Here the Wai-iti is joined by the Eighty Eight Valley and Pigeon Valley Streams which drain catchments of 35km2 and 38km2 respectively. Downstream of Wakefield, the Wai-iti flows a further 7km to its confluence with the Pitfure Brook which drains a 27km² catchment south west of Brightwater. A further 3 km downstream from its confluence with the Pitfure, the Wai-iti flows into the Wairoa.
The Wai-iti and Wairoa catchments are characterized by a cool wet climate with an average annual rainfall (at Wairoa at Irvines) of approx. 1500 mm (there is a large variation in rainfall depths across the catchment due to the orographic effect of the hills), and an average annual temperature of approx. 14°C (Niwa, 2008). The Wairoa and Wai-iti Rivers have a history of flooding with significant areas of inundation around Wakefield and Brightwater previously inundated.
Hydrology
- Gauged Catchments
- Regional Flood Frequency method
- Wairoa River hydrology
- Wai-iti River hydrology
- Ungauged catchment hydrology
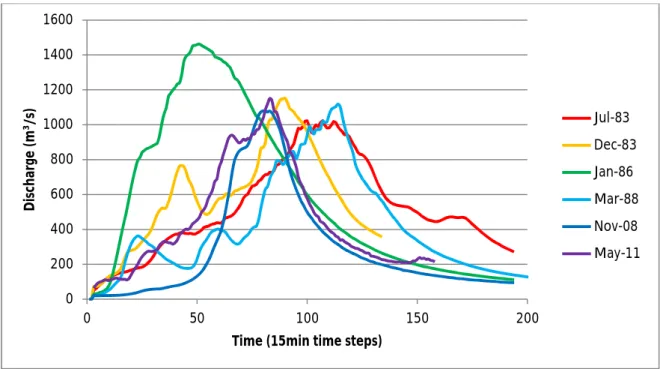
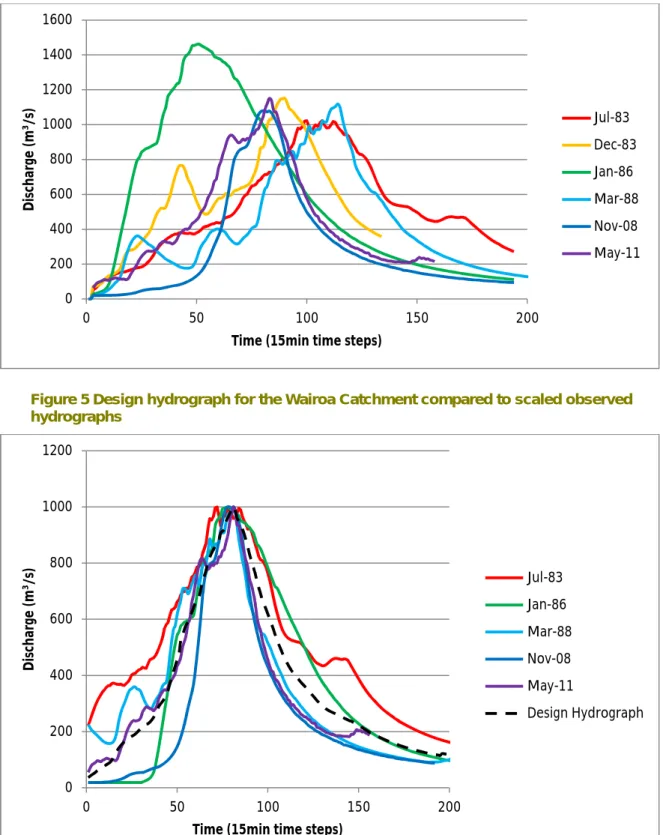
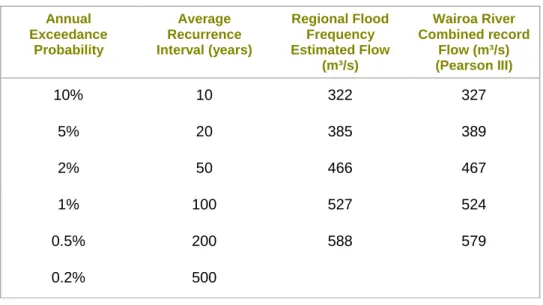
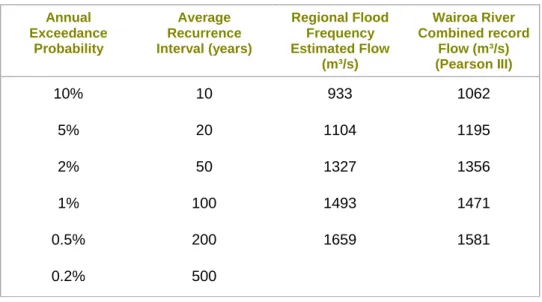
The runoff distribution (hydrograph shape) assigned to the modeled flow events was developed by comparing runoff from a number of larger recorded events. An average hydrograph was considered representative of this watershed and was used to develop a dimensionless unit hydrograph to apply to each event. Calculated peak flows at Wai-iti at the Livingston gauging station are compared across a range of events in Table 3 .
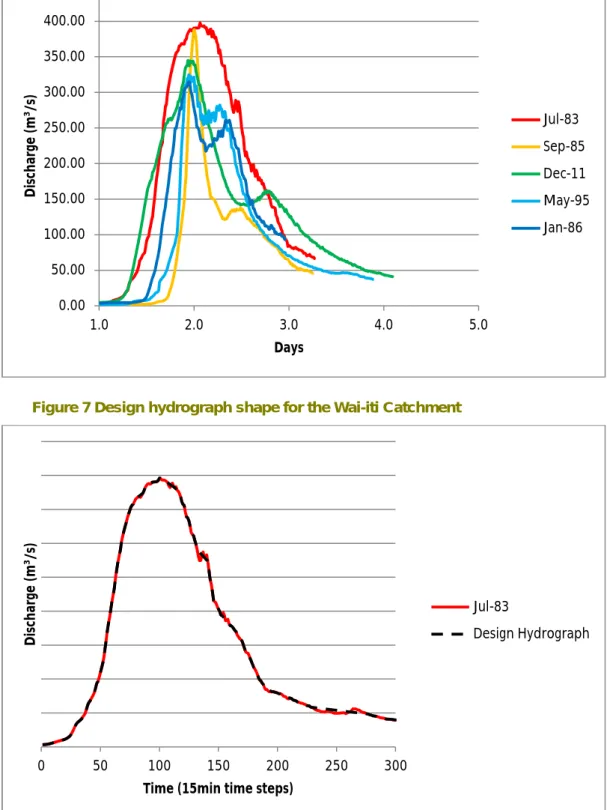
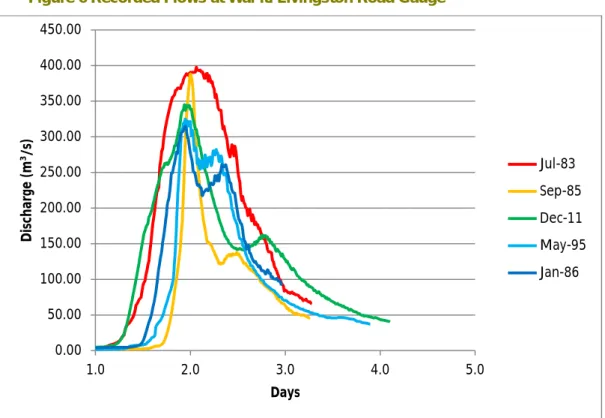
This was chosen as a conservative estimate for the catchment as it resulted in the largest peak and volume for an event on record. A smoothed dimensionless unit hydrograph based on this event was developed to apply to each event. Peak flow for the ungauged catchments has been estimated using the regional flood frequency method.
This was chosen as a conservative estimate for the catchment as it resulted in the highest stage and volume for a recorded event. There was also a preference to select only one event as the basis for the unit hydrograph rather than the average of events, as the comparison was made using stage data and there was no certainty that the stream bed between events was comparable.
Hydraulic Modelling
- Model Overview
- Bathymetry
- Structures
- Floodplain Resistance
- Boundary Conditions
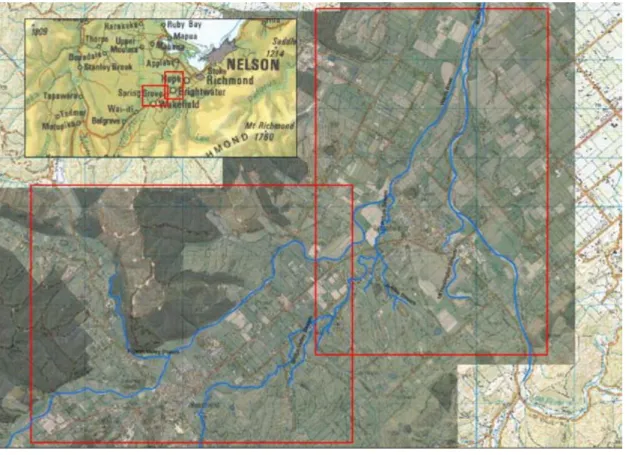
LiDAR was used to create a digital terrain model in ESRI Arc GIS, from which a 2 m x 2 m grid was created for both model areas. In many cases, smaller streams with trees and flood embankments were not accurately represented in the LiDAR data. These features were added to the model using a combination of site visits and survey data provided by TDC.
The topography was also edited in the Wai-iti and Wairoa rivers to account for the wet river channel not detailed with LiDAR and also for the mobile gravel banks present on some of the river bends. These areas of gravel are likely to be mobile during high flow events and were adjusted slightly during the validation process as discussed below. Survey data relating to some flood traps was available from TDC and was incorporated into the model.
These containment areas were verified through site visits where possible and then included in the model grid. This detail was used to edit the grid topography and soil resistivity to approximate the structure. Sufficient overlap in models was created so that power could be extracted from the Wakefield model upstream of any boundary effects and then released again into the Brightwater model.
To reduce the cumulative overestimation of flow in the lower Wai-iti catchment resulting from discharge. Given the uncertainties about the potential impacts of climate change, the 500-year return period event was used to assess the potential impacts that projected future changes in rainfall intensity could have on extreme flood events. As is standard practice in hydraulic modeling, a free margin should be considered for model results.
Freeboard attempts to account for uncertainties associated with topographic data, hydrology, and the simplifications and modeling approximations used in developing model outputs. In this investigation, a dynamic headwater scenario was developed using the results of scenario 1 of 100 AEPs and adding 500 mm to the peak water level of all significant flood areas. This new peak water level was then hydraulically modeled to determine the likely changes in flood extent and risk if an uncertainty allowance was included when modeling a 1 in 100 AEP flood event.
Validation and Sensitivity Analysis
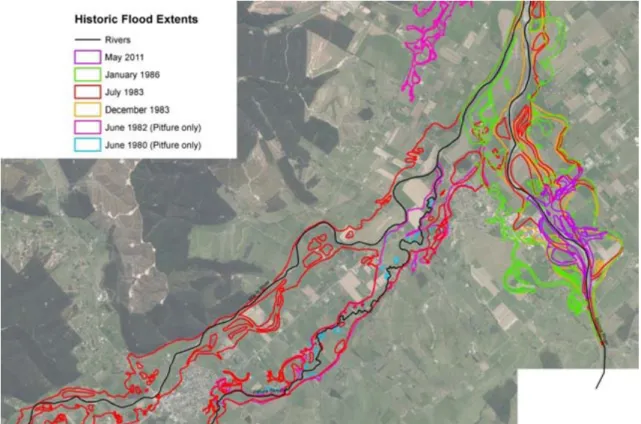
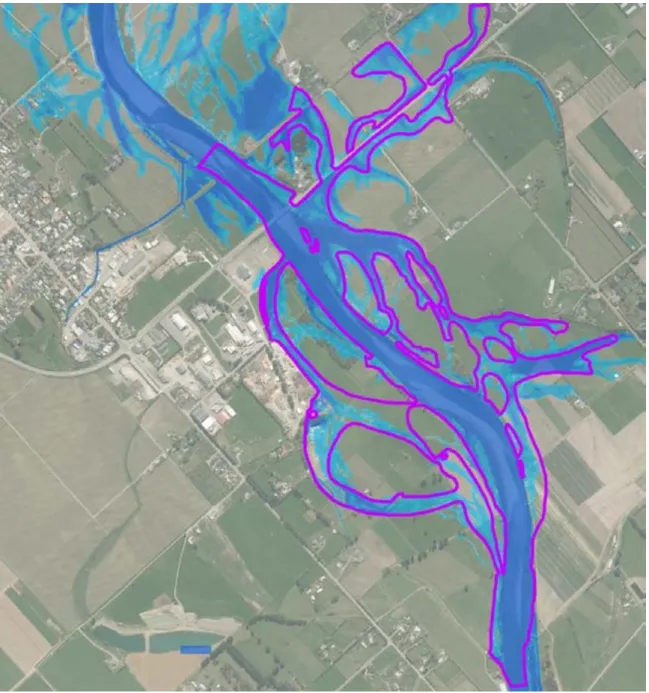
This data is considered to be the most accurate of the flood extents and was therefore primarily used to fine-tune the model. The model was developed using methods and parameters considered appropriate for the project requirements, with the final model parameters adjusted to best match the 2011 flood extent as shown above.
Limitations
Reliance Statement
Model limitations
The drains, streams and rivers were represented in the 2D grid using the LiDAR data and as a result certain limitations will exist in the accuracy and capacity of the streams. Within the context of this project's objectives, this is not considered significant as stream capacity decreases significantly during extreme flood events where flow far exceeds the capacity of small channels. However, caution should be exercised in interpreting flood extent in the vicinity of small streams.
The channel and bridge structures within the model are represented using a simplified modeling approach. Again, this methodology is consistent with the overall purpose of the project, but means that the flow and extent of flooding in the vicinity of the canal and bridge structures must be carefully addressed. In most circumstances the channels are such that water will easily flow over the top and a blockage will have limited impact during a major flood event, however if the debris flow was sufficient to partially or completely block a bridge structure in a major river, may result in different flood magnitudes than those reported in this study.
The depths and magnitude of floods near the model boundaries should not be relied upon.
Results and Discussion
- Wakefield- Existing Flood Risk
- The Pitfure Stream
- Brightwater- Existing Flood Risk
- Modelled freeboard
- Future Flood Risk
- Recommendations
The model predicted in a 1 in 100 AEP event that the peak discharge over Pigeon Valley Road north of the bridge would be just over 70m3/s and in places reached 300mm in depth. During high flow conditions, the water level upstream of the decommissioned railway embankment is expected to be high enough to cause the flow to move along the south side of the embankment adjacent to SH6. Some survey information was available and has been used in the modeling of these bunds, which are predicted to largely contain river flows during a 1 in 10 AEP event, but are largely overpeaked in larger events such as a 1 in 100 AEP event , where much of the land adjacent to Wai-iti is shown to be inundated.
Land north of Brightwater is extensively flooded under most of the modeled scenarios from Wai-iti and Wairoa. The frequent flooding of the land adjacent to Pitfure is typical of this type of minor stream draining a series of small steep catchments. The raised height of SH6 is expected to cause floodwaters from the Pitfure to a dam upstream of the motorway, overland flow then occurs eastwards along SH6.
Under a 1 in 10 AEP scenario, the model predicts that most flood flows will be confined to Wairoa's main channel. A number of small but well-defined overland flow paths are predicted, some of which are adjacent to SH6 and may cause some road flooding. Typically suitable freeboard margins are developed from a sensitivity analysis of a range of variables in hydrology and hydraulics modelling.
In this study, a simplified approach has been taken to provide an indication of the effects of using freeboard. A comparison of the results from the modeled 1 in 100 AEP event with and without freeboard inclusion is shown in Figure 19 and Figure 20. The nature of the topography means that much of the floodplain is already inundated in the 1 in 100AEP event and therefore the inclusion of freeboard most observed in areas on the edge of the floodplain.
Today's 1 in 100 AEP flood event was compared to a 1 in 500 AEP event to provide an indication of the potential impacts of climate change should this rare event become more frequent. The results show that in a 1 in 100 AEP event, a large part of the floodplain is already inundated and most of the man-made defenses such as sluices have already been breached. Changes in the geomorphology of rivers and streams have another impact on future flood risk.
The primary purpose of this study was to provide TDC with an understanding of the flood risk posed by the Wai-iti and Wairoa Rivers during various storm events. These two streams seem to cause much of the more common flooding problems as well as having.
Glossary
APPENDIX A
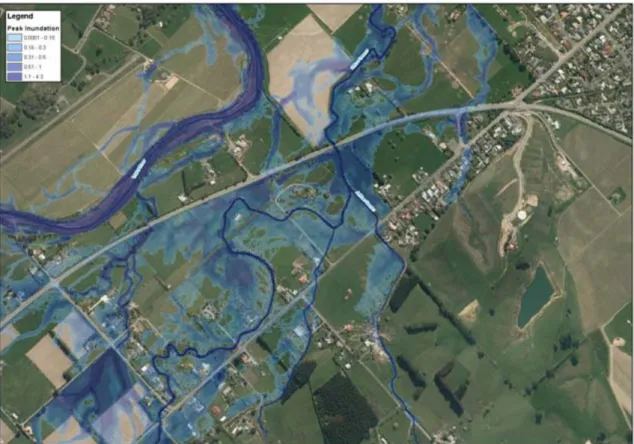
Flood Depth (m)
APPENDIX B