Background: Global Climate Change - Science and Impacts 2 2.1 Physical Science Basics (IPCC Working Group I): 2 2.2 Impacts, Adaptation and Vulnerability (IPCC Working Group 2): 3 2.3 Climate Change Mitigation (IPCC Working Group 3): 4 3. Impacts and Vulnerability: The potential impacts of climate change are likely to be significant without further adaptation.
Sectoral Impacts
New Zealand is likely to be more susceptible to the establishment of new horticultural pests. Flows in New Zealand's major rivers are likely to increase, benefiting hydropower generation and irrigation supply.
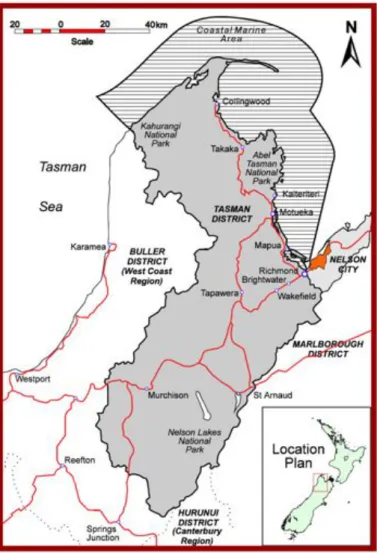
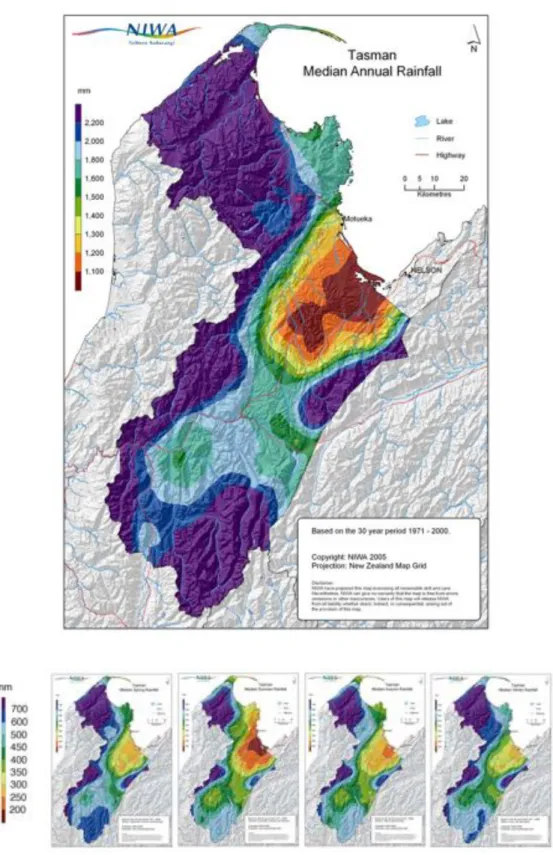
Present Climate
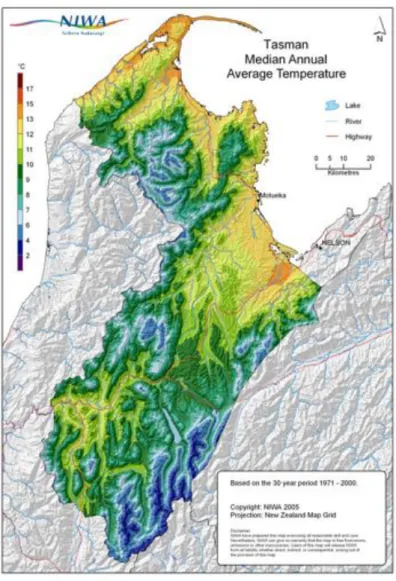
- Spatial Patterns in Tasman’s Climate
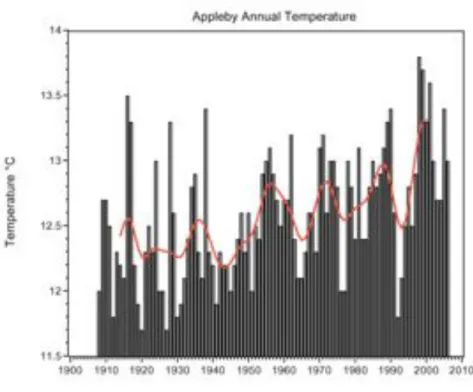
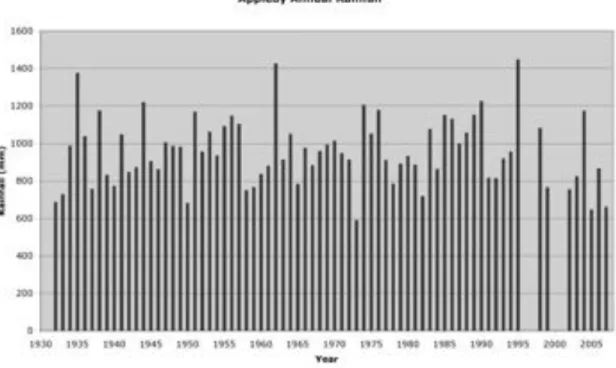
- Temporal Variability in Tasman’s Climate
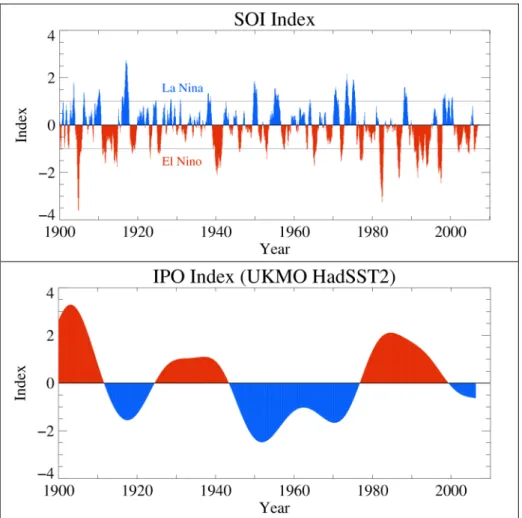
- Natural factors causing fluctuation in climate patterns over New Zealand
- New Zealand Sea Level Trends and Variability
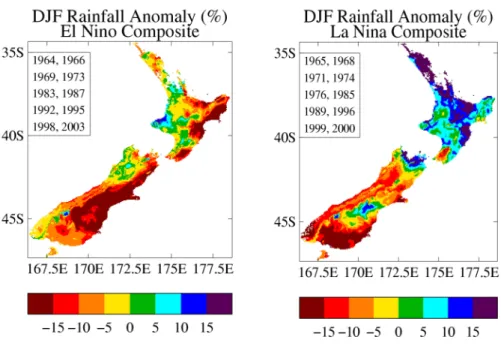
Two factors that influence rainfall in New Zealand (Ministry for the Environment, 2008) are the El Niño-Southern Oscillation (ENSO), and the Interdecadal Pacific Oscillation (IPO). Differences between El Niño and La Niña periods are most clearly seen in the tropics, but there are also related changes in New Zealand rainfall and temperature patterns. The general pattern during El Niño events is for New Zealand to experience stronger than normal southwesterly airflow, lower than average seasonal temperatures and drier than normal conditions in the northeast of the country.
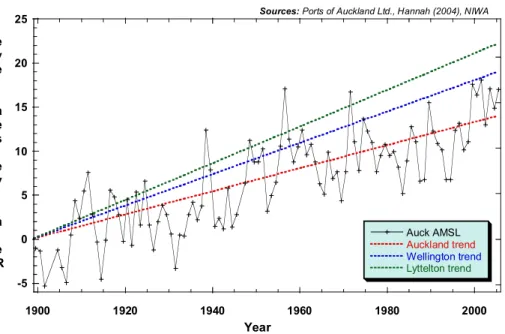
During La Niña conditions, New Zealand generally experiences more northeasterly flows, higher temperatures and wetter than normal conditions in the north and east of the North Island. While the long-term trend in sea-level rise in New Zealand is consistent with global climate change, Figure 9 shows that (as with precipitation and temperature) there are also shorter-term fluctuations.
Projections of Tasman’s Future Climate
Storm surge is the result of a drop in atmospheric pressure (reverse barometric effect) and the influence of wind on the sea surface. In a New Zealand context, maximum storm surge on the open coast is unlikely to exceed about 1 m, but may be higher in estuarine and harbor environments. are set up. This is a local phenomenon and can be highly variable along even a short stretch of shoreline depending on wave conditions and configurations of offshore sandbars and beach slope.
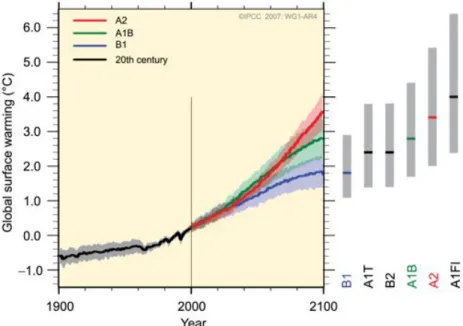
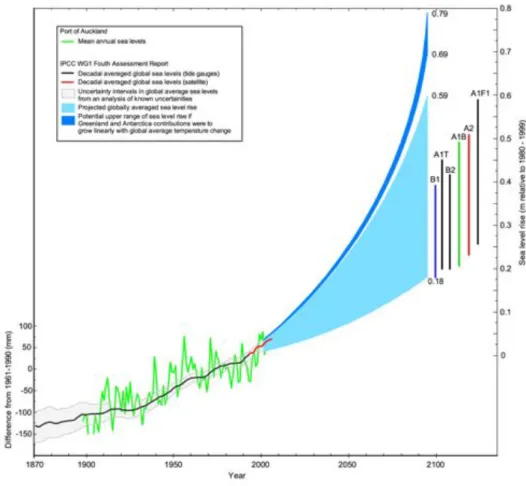
Note that none of the IPCC emissions scenarios assume global policy actions to specifically reduce greenhouse gas emissions. The temperature increase at 2100 relative to the average over varies from +1.1°C (least sensitive model combined with the lowest emission scenario B1) to +6.4°C (most sensitive model with the highest emission scenario A1FI).
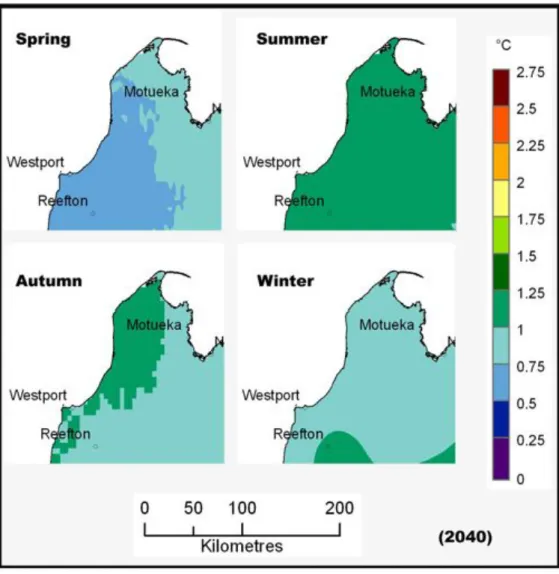
Tasman Climate Change Temperature Projections
Figures 11 and 12 show an expected future warming in the Tasman district of approx. 0.2°C per decade for the A1B emissions scenario when averaged over the 12 global climate models analyzed by NIWA. The "middle range" projection in Table 1 is the temperature increase averaged over all 12 global climate models analyzed by NIWA, and also averaged over the six illustrative emissions scenarios used by the IPCC. The upper limit is set by the most sensitive climate model under the highest emission scenario (A1FI).
However, observed emissions are already increasing faster than the lowest (B1) scenario, and the slowest temperature increase to 2100 projected by the B1 scenario is less than the linear extrapolation of the observed New Zealand temperature increase over the 20th century. It is therefore the opinion of NIWA scientists that the actual temperature increase this century will most likely be more than the.
Projections for Frosts and Hot Days under Climate Change
The lower limit for warming is determined by the climate model with the lowest climate sensitivity (i.e. least warming) that is run under the lowest emission scenario (B1). The IPCC is hesitant to say whether any of their emission scenarios are more likely to pan out than others. Under the mid-range scenario for 2090, a 2.0°C increase in average temperature would represent the annual average temperature in coastal Tasman in 2090, similar to current temperatures in the coastal Bay of Plenty.
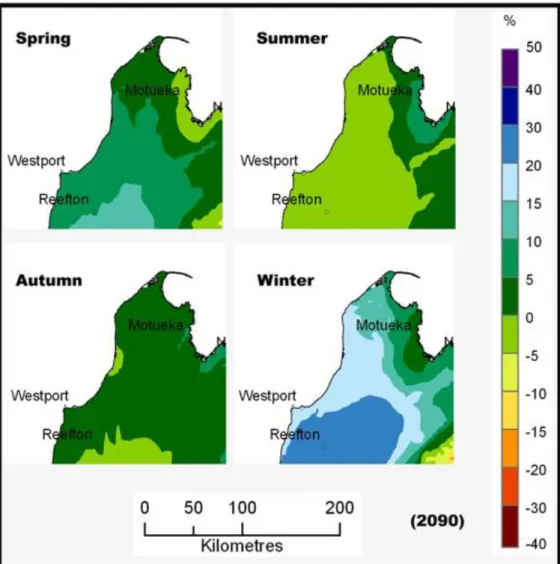
Tasman Climate Change Rainfall Projections
From these 12-model averages, the western part of the Tasman District is projected to experience slightly less summer rainfall (by less than 5%) but significantly more winter rainfall, particularly in 2090. The average picture hides significant variations between individual models on the expected seasonal rainfall changes. For this ranking, although the models disagree on the expected magnitude of changes, most agree.
The first number is the “mid-range” rating, with numbers in parentheses indicating the lower and upper limits. The vertical colored bars show the range for all climate models used and the stars show the predicted change for each model separately.
Scenarios for Changes in Extreme Rainfall
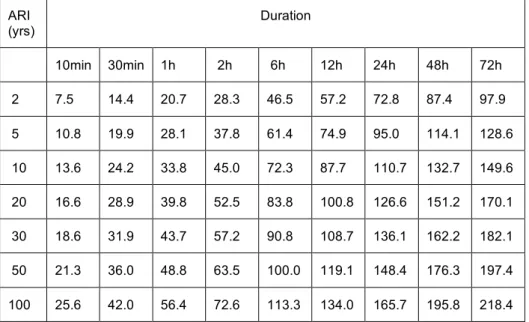
A summary of the process for producing heavy precipitation statistics for screening analyses, with a detailed example of its application to Richmond, is provided in the appendix of this report. Statistics for the screening studies under mid-range temperature change scenarios for 2040 and 2090 are given in Tables 4a and 4b. Table 4(a): Projected precipitation depth-duration-frequency statistics for Richmond in 2040, for a mid-range temperature scenario (0.9°C warming).
Table 4(b): Projected precipitation depth-duration-frequency statistics for Richmond in 2090, for a mid-range temperature scenario (2.0°C warming). Forecast rainfall depth-duration-frequency tables for other locations in the Tasman District can be produced using the HIRDS software package and the process illustrated in the Appendix and described in the revised Local Government Guidance Manual (Ministry of the Environment, 2008) .
Evaporation, Soil Moisture and Drought
Wind
More details are provided in the revised Local Government Guidance Manual (Ministry for the Environment, 2008). An increase in the mean westerly wind component does not necessarily mean an increase in total wind speed, or in wind speed extremes. However, some very preliminary work with the NIWA regional climate model (Ministry for the Environment, 2008) suggests that there may be a relatively small increase in stronger winds over most of the country by 2100 (on average an increase of 2.3% over the soil points in the model).
We conclude that not enough research and modeling has yet been done to allow a reliable projection of how wind extremes may change in the Tasman District, but a small increase by 2100 cannot be ruled out.
Climate Change and Sea Level 8
- Effect of Sea-Level Rise on High Tide Exceedance Frequency
The light blue shading shows the range in projected mean sea level to the 2090s. The dark blue line shows the potential additional contribution from the Greenland and West Antarctic ice sheets if the contributions to sea level rise were to grow linearly with global mean temperature change. This includes updated guidance on changes in mean sea level for use in future planning and decisions.
As such, it is assumed that storm surge height will increase at the same rate as average sea level rise until future projections of changes in storm surge become more certain. An example of the effect that future sea level rise has on the frequency of high tides at Tarakohe and Little Kaiteriteri is shown in Figure 17.
Climate Change Impacts on Other Coastal Hazard Drivers
Perigee spring tide: Occurs when a full or new moon coincides with perigee, the point when the moon is closest to Earth. For each plot, the black line shows the percentage of tides that exceed specified levels above mean sea level for today's sea level. Considering the Mean High Water Perigean Spring (MHWPS) level, at Tarakohe it is exceeded by about 3.5% of high tides.
Considering both Anthropogenic and Natural Changes
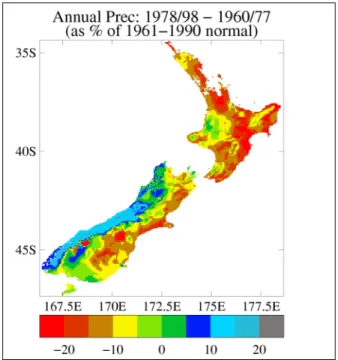
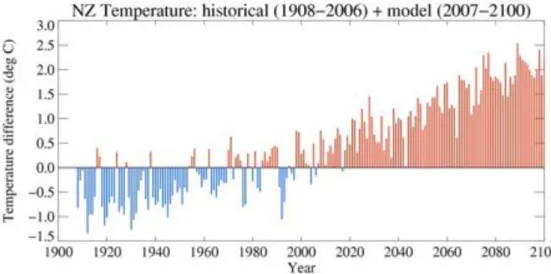
The bars after 2006 are New Zealand averages of year-to-year reduced temperatures from one of the IPCC Fourth Assessment Report models that simulated natural year-to-year variability together with long-term trends due to anthropogenic greenhouse gas emissions. For rainfall, the fact that we appear to have recently moved into a negative phase of the Interdecadal Pacific Oscillation (Figure 7, bottom panel) may be as important for the Tasman region over the next 2-3 decades as the effects of anthropogenic. A subsequent further reversal of the IPO in 20-30 years could have the opposite effect, counteracting part of the anthropogenic trend in rainfall for several decades.
In the projections we have discussed, these anthropogenic trends become the dominant factor at the local level as the century progresses. But we must bear in mind that in some cases natural variability will add to human-induced trends, while in others it may offset part of the anthropogenic effect.
Tasman District – Impacts, Vulnerability and Adaptation
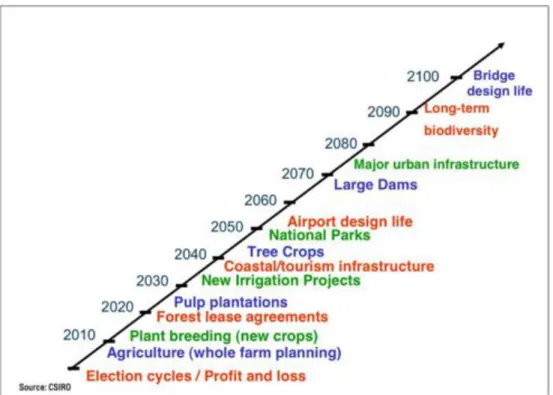
As Figure 19 illustrates, attention to climate change becomes particularly important for the design of climate-sensitive infrastructure or assets that are likely to last for many decades to come, and for resource use and land use planning over similar time scales. Planning for human-induced climate change becomes increasingly important as one moves to the right along this line. Opportunities that climate change can bring to new horticultural crops - and infrastructure and land use issues that may arise.
Implications of climate change (including potential changes in flood frequency and coastal hazards) for land use planning. Integrating climate change impacts and adaptation into municipal planning as described in the MFE Guidelines.
Contribution of Working Group 1 to the Fourth Assessment Report of the Intergovernmental Panel on Climate Change [Solomon, S., D. Contribution of Working Group II to the Fourth Assessment Report of the Intergovernmental Panel on Climate Change [M.L. Contribution of Working Group III to the Fourth Assessment Report of the Intergovernmental Panel on Climate Change [B.
Ministry of the Environment, 2004: Preparing for Climate Change – A guide for local authorities in New Zealand. Contribution of Working Group I to the Fourth Assessment Report of the Intergovernmental Panel on Climate Change [Solomon, S., D.
APPENDIX: Rainfall depth-duration-frequency statistics and scenarios
This appendix first provides current rainfall depth-duration-frequency statistics for Richmond obtained from the NIWA HIRDS V2.0 software package (Thompson, 2002) and depth-duration-frequency "scenario" tables for 2040 and 2090. Changes of The future temperature projections are then used with Table A1 to provide factors by which to multiply the entries in the current rainfall depth-duration-frequency table for Richmond, to produce projected depth-duration-frequency tables for 2040 and 2090.