It was found that the climatic and physical characteristics of the location are suitable for maintaining a feedlot to the extent proposed by the proponent. A beef feedlot is a beef (meat) supply management system designed to take energy and protein from crops grown in two (2) months of the year (November and December in Australia) and meter that nutrient in other ten (10) months. years.
Background
Applicant and property details
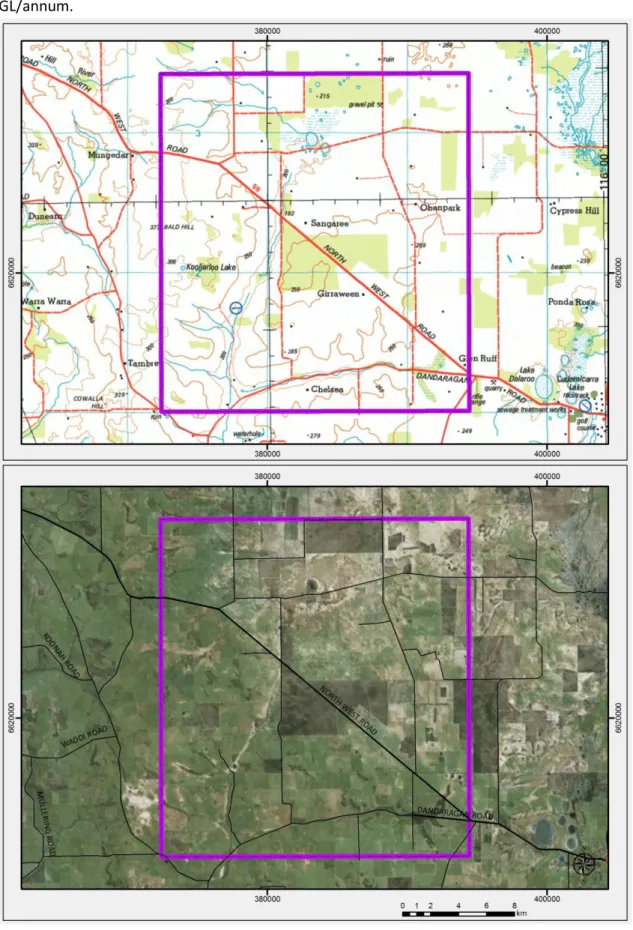
The premises will be on the east side of Coalara Road and on the north side of Boothendarra Road. The land in question is currently designated as 'Rural' under the Shire of Dandaragan Town Planning Scheme.
Objectives of the development
The area to the north, south and east is a park and recreation area (Watheroo National Park).
Feedlot site options considered and final selection
Current land-use on Sendem Downs
State & Local Government consultation
It was noted that an environmental assessment would be required and that the environmental assessment should be prepared and informed by the requirements of the works approval application form. DPIRD has communicated that the Works Approval Application Form has been recently updated and that the April 2020 Form IR F09 was the correct form to complete.
Documentation requirements
Claire Coffey from DPIRD outlined the process of completing a works approval application with DWER and the elements required to obtain approval. DPIRD has extensively outlined the key requirement to ensure that evaporation ponds are lined with clay or artificial liner to meet the National Feedlot Guidelines for infiltration of 1 x 10⁻⁹m/s.
State regulations relevant to feedlot development
The site characteristics, general layout of the trunk, cattle color, milling options and the irrigation element of the feed production business model were described. Other acts may be relevant, however in addressing the requirements of the acts listed above the requirements of other state law will be met.
Scope, size and scale of proposed feedlot development
Following approval and prior to commencement of development, DWER will issue a building permit for construction, construction registration and, following construction of the works to certified standards, a license to operate under Part V of the EP Act 1986.
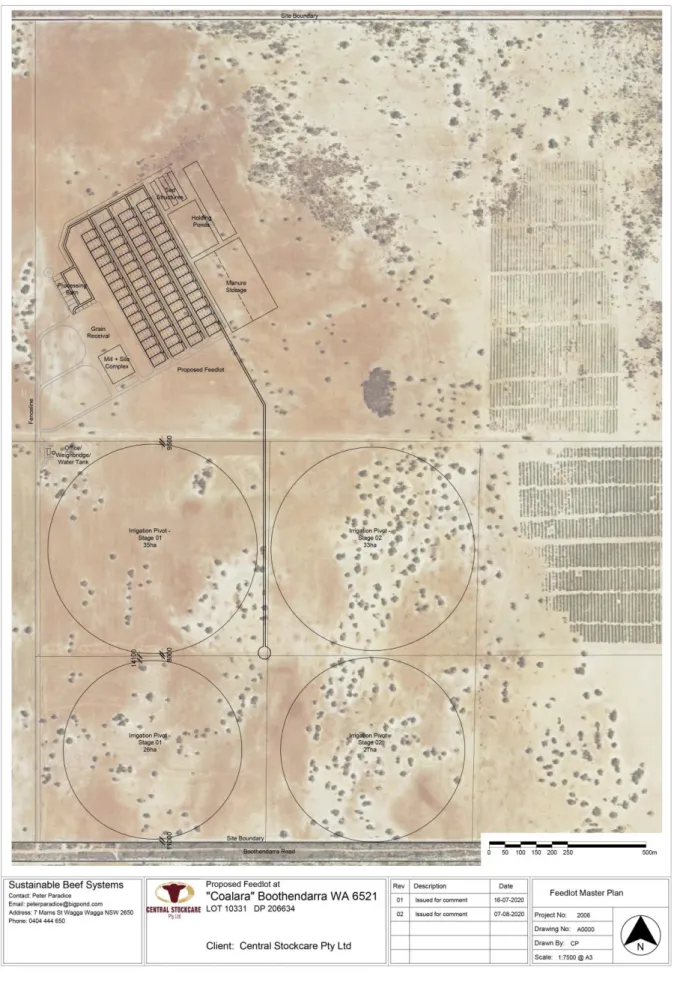
Staged development of the proposed feedlot
Pens and drainage layout
Earthworks, borrow pits and ponds
Feedroad, bunkline and manure haulage
Water supply, troughs and trough wastewater
Row configurations
Shade in cattle pens
Dust control
Hospital facility
Processing shed
Arrival and dispatch
Feedmill
The mill will be placed in the southwest corner of the feedlots. The hay and straw required for the fiber component of the ration will be cut to length during the baling process during hay harvesting.
Mobile plant and equipment
Grain will be loaded into the grain receiving system and delivered directly to storage silos via enclosed elevators. In the discharge sector of the mill, augers from the "prepared ingredient" holding silos will be used to transfer the stored ingredients of grain, lupins and grains to a bulk bin before being transported to the ration mixer truck.
Office & weighbridge facilities
The office will be a prefabricated former mining administration building, but will be placed on the piers. Operations will take place on a second floor than the grain testing stand with an open deck and offices.
Livestock
An automatic grain tester will be installed on the weighbridge so that operators do not need to mount trucks to take grain samples. The configuration of the road past the office will be set up so that in the future, electronically controlled barrier gates/gates can be effectively installed if it is determined that such control is required.
Animal welfare
The office will have a security fenced porch that will stand next to the weigh bridge so that cattle on the upper level can be seen coming and going and grain/goods trucks when discovered can be visually assessed from the control platform on office bridge. The requirements of this accreditation will inform and shape feedlot management systems.
Feedstuff and rations
Manure and pen floor management
Effluent
Heat risk analysis and managing heat load
Power & Energy
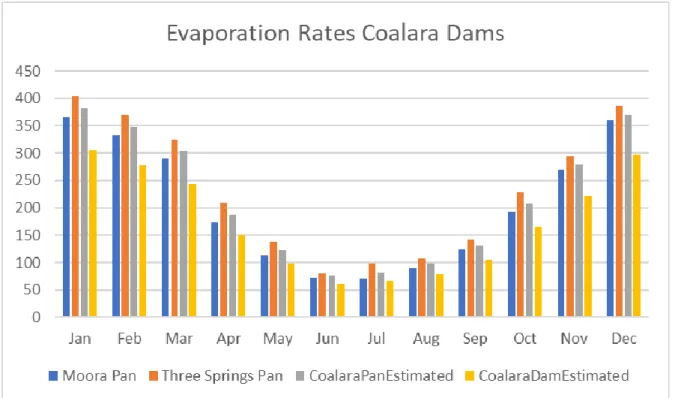
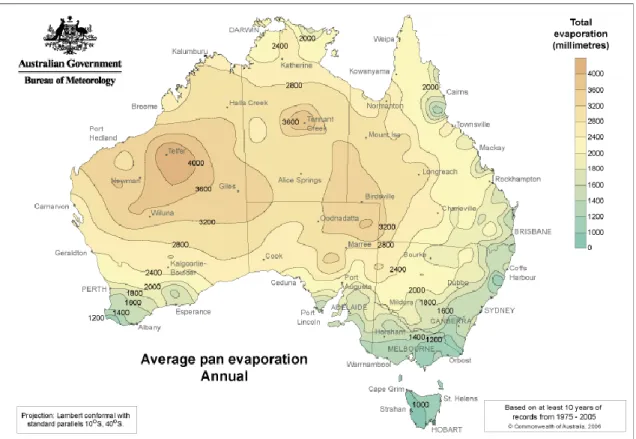
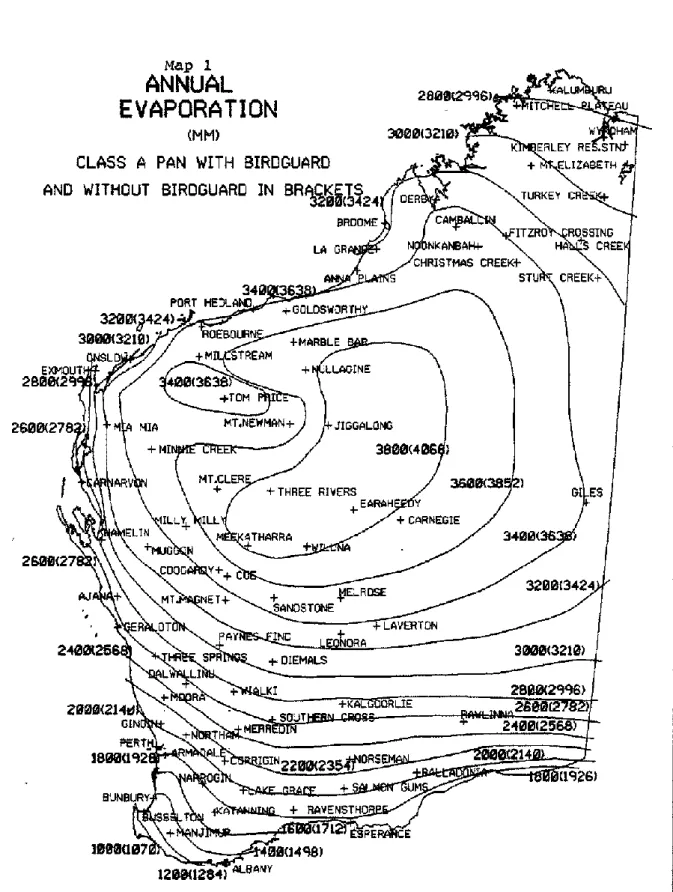
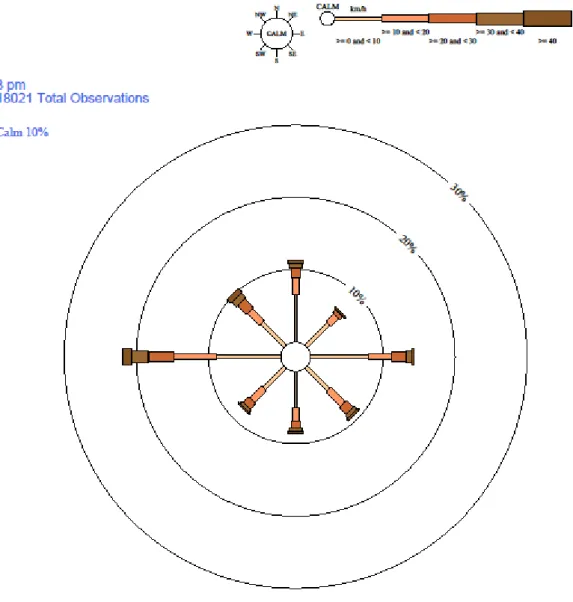
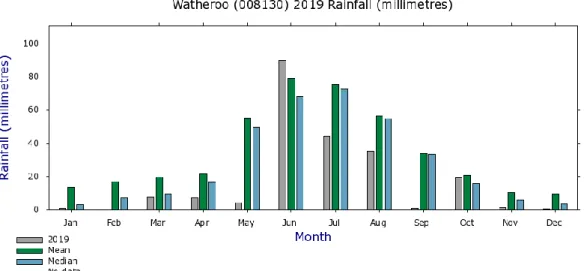
Climate
The feedlot is in the same rainfall and evaporation band as the towns of Moora and Watheroo. 107 years of historical rainfall data from Moore and 120 years of rainfall data from Watheroo were used to model expected conditions at the Coalara Feedlot.
Landform
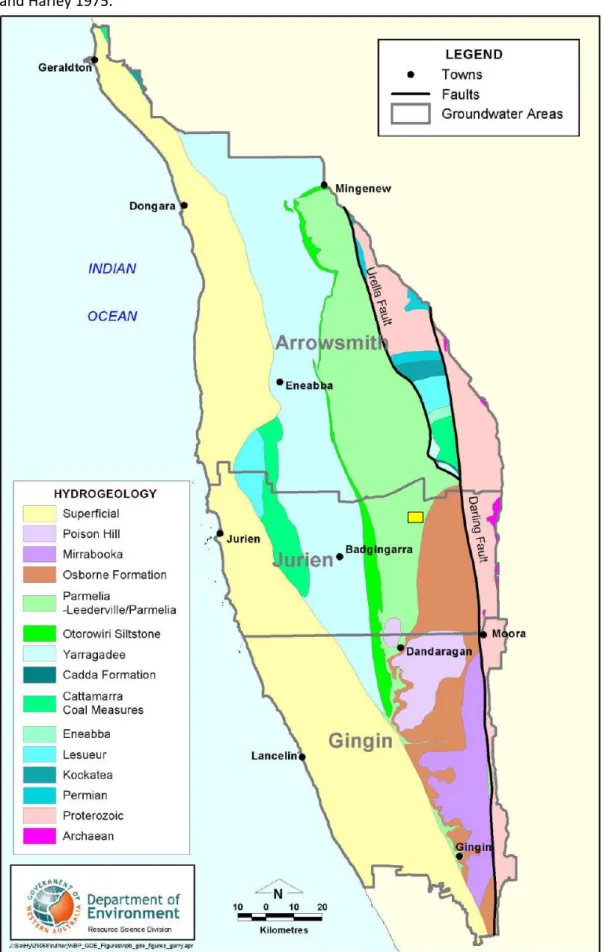
Hydrogeology
Geology
Groundwater
Soil and subgrade
Biodiversity
The proponent answered a series of questions to understand the potential impact on biodiversity and local waterways, wetlands and proximity to the Watheroo National Park boundary. After discussion of the location and situation of the proposed development, Ms. Donovan stated that she could not foresee any material impact on animals, vegetation or other aspects of concern to the ministry in the vicinity of the development.
Road and transport infrastructure
All the land on which the development is to take place has been regularly cultivated for winter grain production.
Aboriginal cultural heritage and native title
Local Government Region City of Wanneroo, Shire of Chittering, Shire of Coorow, Shire of Dalwallinu, Shire of Dandaragan, Shire of Gingin, Shire of Goomalling, Shire of Moora, Shire of Toodyay, Shire of Victoria Plains, Shire of Wongan-Ballidu. Given the location of the proposed feedlot in an area of significant disturbance and change, it is considered a low risk of issues of Aboriginal cultural heritage arising or artifacts being discovered.
Odour and dust
Noise
Manure
Feedwater will be added to the compost to start and facilitate the composting process. Therefore, once gross soil nutrient deficits at the facility are addressed using old manure and compost, the primary strategy will be to export material from the farm premises to neighboring CSC farmland.
Surface water
The system will consist of 3 shallow flat ponds (in series) for settling solids with a compacted clay floor to facilitate pond cleaning and to mitigate against infiltration. A key element of the effluent management design will be the evaporation of a portion of the effluent by seasonal application (irrigation) of a portion of the available manure compost production liquid to the manure storage and composting area. Effluent holding ponds will be constructed with a holding capacity depth of 2.5 m with freeboard as recommended by the Guidelines.
Groundwater protection
Flora and fauna preservation
Traffic flows and hours of operation
It is estimated that the average livestock truck will be a B/Double configuration with an average payload of 36 tons. Feedlot normal operating hours will be 7 a.m. to 5 p.m. seven days a week. Work routines (including livestock arrival and dispatch) are scheduled within normal working hours.
Pesticides & chemicals
During construction of the feedlot, there will be additional traffic at irregular times, but this will be short-term and the local road network infrastructure is in place to handle the volume of traffic. During this time the office will be open to provide livestock feeding. All chemicals will be managed in accordance with the provisions of NFAS accreditation, which will be provided and maintained by the company.
Pest and vermin control
CSC is also aware that antibiotic resistance is a growing problem for users of antimicrobials. CSC will develop animal health management programs that are sensitive to the need to slow the rate of development of antimicrobial resistance. The company will use the MLA (2018) report “Antimicrobial Stewardship Guidelines for the Australian Feedlot Industry” as the guide in formulating regimes and procedures to achieve this goal.
Visual amenity
Pollution incident response management plan (PIRMP)
Environmental monitoring and complaints register
Backhouse, J., 1984, Revised Late Jurassic and Early Cretaceous Stratigraphy in the Perth Basin, Geological Survey of Western Australia, Report 12, Professional Papers for 1982, pp. Briese, E.H., 1979, The Geology and hydrogeology of the Moora Line en aangrensende gebied, Geologiese Opname van Wes-Australië, Rekord 1979/12. P., 1996, Stratigraphy and Structure of the onshore Northern Perth Basin, Geological Survey of Western Australia, Report 46.
Appendix 1: The Authors
Appendix 2: Feedlot design drawings
Appendix 3: Feedlot effluent pond dimension calculations
Precipitation Watheroo Jan Feb Mar Apr May Jun Jul Aug Sep Oct Nov Dec Annual. Pond size - mid year with irrigation to compost Jan Feb Mar Apr May Jun Jul Aug Sep Oct Nov Dec Annually.
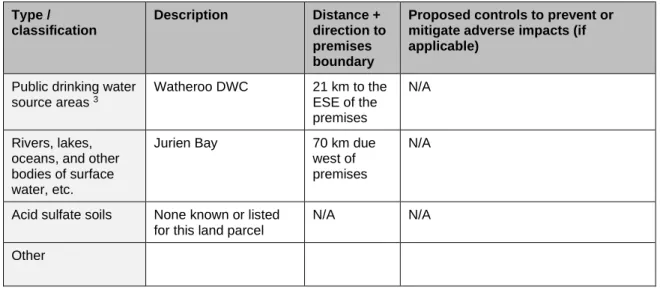
Appendix 4: Guideline separation distances
The nearest receptor is Lot 2297, Coalara Road, Boothendara, also referred to as Boomplaas in Figure 18.
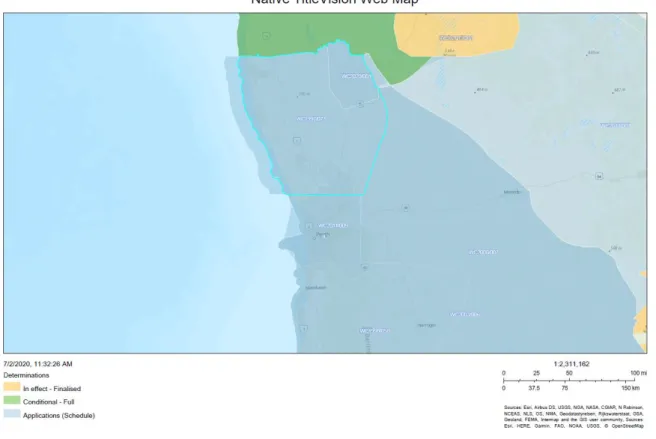
Appendix 5: WA Dept. of Planning, Lands and Heritage interactive planning data
Appendix 6: Bore log data Agaton 12 (AG12)
CLAY 98% CLAY, a dark gray clay that looks slightly scaly; 2% sand, fine to very fine sand quartz grains, subangular in shape. 90% SAND, a grayish sand with brown to colorless quartz grains very fine to very coarse in size but fairly well sorted, grains are angular to subangular in shape, a fair amount of feldspar and some pyrite grains, 10% silt, light gray colored clayey silt with small amount of mica flakes and some very fine quartz grains in it. SAND, greyish sand with various colored quartz grains, ranging in size from fine to very coarse but fairly well sorted, rounded to subrounded grains, some feldspars.
Appendix 7: Soils investigation
Appendix 8: Clay material infiltration test laboratory data
Appendix 9: Coalara Feedlot “Animal Care Statement”
Upon receipt, the cattle are placed on edible hay for 1 to 2 days and then lined up. Cattle that meet health and weight specifications are initiated. Induction Clostridial Vax, Resp Vax, worm and lice control, possibly HGP, if necessary Cattle are scanned and individually identified with ear tags. ii) Records (of health treatment). All treated cattle are individually tagged with the treatment and date entered in the feed log and written on the tag.
Appendix 10: Heat risk assessment
Appendix 11: Coalara Feedlot Odour Management
As described earlier in this paper, effluent water will be used in the compost production processes at the feedlot site. Weather forecasts for potential impact on receptor homes will be considered by the Feedlot Manager when planning the timing of composting activity. Weather forecasts for potential impact on receptor homes will be considered by the Feedlot Manager when planning the timing of dispersal activity.
Appendix 12: Effluent drains and sedimentation structures
Below are the calculations for the drainage that runs along the north end of the yard pencils to the sedimentation structures. Once a detailed study is carried out, then an accurate estimate can be made regarding flow rates and drain sizes required. Allowing that the entire area draining to the sedimentation pond, including the manure storage and treatment area, but not the evaporation ponds, the peak flow rate, Qp = 1.7 m3/sec (assuming an area of 30 ha is poured into the sedimentation ponds).
Appendix 13: Premises & CSC properties manure utilisation areas
Appendix 14: Feedmill conceptual design (AF Systems 04/08/20)
Appendix 15: ASIC Certificates of Registration for the Applicant
Appendix 15: Proof of occupier status