1
Cockburn Sound Management Council
Summary of Cockburn Sound monitoring and
research programs 2018
i
Cockburn Sound Monitoring and Research Programs 2018Produced and published by
Cockburn Sound Management Council Prime House, 8 Davidson Terrace Joondalup, Western Australia 6027 Telephone +61 8 6364 7000 Facsimile +61 8 6364 7001 National Relay Service 13 36 77
© Government of Western Australia April 2019
This work is copyright. You may download, display, print and reproduce this material in unaltered form only (retaining this notice) for your personal, non-commercial use or use within your organisation. Apart from any use as permitted under the Copyright Act 1968, all other rights are reserved. Requests and inquiries concerning reproduction and rights should be addressed to the Department of Water and Environmental Regulation.
Acknowledgements
The Cockburn Sound Management Council would like to thank the Australian Department of Defence, the Department of Water and Environmental Regulation, the Department of Health, the Department of Primary Industries and Regional Development, the Department of Biodiversity, Conservation and Attractions, Fremantle Ports, Water Corporation, LandCorp, the Western Australian Museum, the Cities of Cockburn, Kwinana and Rockingham, Tronox Management, the Conservation Council of Western Australia, CSIRO, Curtin University, Edith Cowan University, Murdoch University and The University of Western Australia for providing information on the monitoring programs and research studies included in this report.
Disclaimer
This document has been published by the Department of Water and Environmental Regulation. Any representation, statement, opinion or advice expressed or implied in this publication is made in good faith and on the basis that the Department of Water and Environmental Regulation and its employees are not liable for any damage or loss whatsoever which may occur as a result of action taken or not taken, as the case may be, in respect of any representation, statement, opinion or advice referred to herein. Professional advice should be obtained before applying the information contained in this document to particular circumstances.
This publication is available at the Cockburn Sound Management Council’s website:
www.der.wa.gov.au/about-us/cockburn-sound-management-council
For people with special needs, the report can be made available in alternative formats such as audio, large print or braille.
ii
Cockburn Sound Monitoring and Research Programs 2018
Contents Summary of Cockburn Sound monitoring and research programs 2018 ... 1
Abbreviations ... 1
Abbreviation ... 1
Full term ... 1
CHRMAP ... 1
Coastal Hazard Risk Management and Adaptation Plan ... 1
CSMC ... 1
Cockburn Sound Management Council ... 1
DoD ... 1
Department of Defence ... 1
DPIRD ... 1
Department of Primary Industries and Regional Development ... 1
DWER ... 1
Department of Water and Environmental Regulation ... 1
EPA Act ... 1
Environmental Protection Act 1986 (WA) ... 1
MAFRL ... 1
Marine and Freshwater Research Laboratory (Murdoch University) ... 1
NATA ... 1
National Association of Testing Authorities ... 1
SOFAR ... 1
Status Reports of the Fisheries and Aquatic Resources of WA ... 1
UWA ... 1
The University of Western Australia ... 1
WA 1 Western Australia ... 1
WAMSI ... 1
Western Australian Marine Science Institution ... 1
1. Introduction ... 2
2. Monitoring programs in the Cockburn Sound marine area ... 3
2.1 Summary of monitoring programs in the Cockburn Sound marine area ... 3
2.2 Metadata for monitoring programs in the Cockburn Sound marine area ... 13
iii
Cockburn Sound Monitoring and Research Programs 20183. Research and Investigative Studies in the Cockburn Sound marine area .... 34
3.1 Summary of research and investigative studies in the Cockburn Sound marine area34
3.2 Metadata for research and investigative studies in the Cockburn Sound marine area 36
1
Cockburn Sound Monitoring and Research Programs 2018Abbreviations
Abbreviation Full term
CHRMAP Coastal Hazard Risk Management and Adaptation Plan CSMC Cockburn Sound Management Council
DoD Department of Defence
DPIRD Department of Primary Industries and Regional Development DWER Department of Water and Environmental Regulation
EPA Act
Environmental Protection Act 1986 (WA)MAFRL Marine and Freshwater Research Laboratory (Murdoch University)
NATA National Association of Testing Authorities
SOFAR Status Reports of the Fisheries and Aquatic Resources of WA UWA The University of Western Australia
WA Western Australia
WAMSI Western Australian Marine Science Institution
2
Cockburn Sound Monitoring and Research Programs 20181. Introduction
The Cockburn Sound Management Council (CSMC) is an advisory council to the Minister for Environment established under s.25 of the Environmental Protection Act
1986 (EP Act). Under its terms of reference, the CSMC is responsible for the oversightand coordination of environmental monitoring and research/investigative studies in Cockburn Sound.
In 2016 the CSMC initiated a project to compile available metadata information on:
monitoring that is currently being undertaken within the Cockburn Sound marine
area; and
current and recent (previous three years) research and investigative studies being
undertaken within the Cockburn Sound marine area.
This information was collated into the report Summary of Cockburn Sound monitoring
and research programs 2016 (Cockburn Sound Management 2016). The CSMC willregularly review and update the information included in the report.
The updated information provided by stakeholders and which is collated in this report includes:
a summary of the monitoring programs currently being undertaken in the
Cockburn Sound marine area (s.2.1);
metadata provided by individual organisations on the monitoring programs being
undertaken in the Cockburn Sound marine area (s.2.2);
a summary of research and investigative studies currently or recently undertaken
in the Cockburn Sound marine area (s.3.1); and
metadata provided by individual organisations on research and investigative
studies in the Cockburn Sound marine area (s.3.2).
3
Cockburn Sound Monitoring and Research Programs 20182. Monitoring programs in the Cockburn Sound marine area
2.1 Summary of monitoring programs in the Cockburn Sound marine area
The monitoring that is currently being undertaken in the Cockburn Sound marine area and the organisations responsible for that monitoring are summarised in Tables 1a and 1b. The locations of the monitoring sites are shown in Figure 1 (nutrient and chlorophyll a concentrations), Figure 2 (physical–chemical parameters), Figure 3 (contaminants in marine waters), Figure 4 (sediment quality), Figure 5 (bathing beach microbiological quality), Figure 6 (seafood quality) and Figure 7 (seagrass health).
For further information on the monitoring programs refer to the metadata in s.2.2.
4 Cockburn Sound Monitoring and Research Programs 2018
Table 1a. Summary of monitoring currently being undertaken in the Cockburn Sound marine area.
Ag en cy /O rg an is at io n un de rt ak in g/ fu nd in g th e m on ito rin g ( X ) o r o ve rs ee in g th e m on ito rin g (X )
Water quality Phyto-
plankton Sediment
quality Seafood quality Seagrass health
Seagrass/benthic habitat mapping Benthic communities Benthic habitat Crabs (abundance/catch-effort) Octopus(abundance/ catch-effort)
Fish
Shark hazard monitoring
Birds
Nutrients Chlorophyll/Phytoplankton biomass Physical–chemical parameters Chemical contaminants Microbiological (enterococci) Microbiological (total coliforms, thermotolerant coliforms,E. coli) Intake water Continuous monitoring (temperature) Phytoplankton (biotoxins) Physical–chemical parameters Chemical contaminants Microbiological Biotoxins Chemical contaminants Shoot density Lower depth limit Abundance/catch/effort Distribution Little penguins (health and ecology) Caspian and bridled tern ecology/population dynamics Exposure to metal contamination (little penguins, Caspian terns) Cockburn Sound Management
Council (CSMC)/Department of Water and Environmental Regulation (DWER)
X X X X X X
Department of Primary Industries
and Regional Development (DPIRD)
X X X X X X X
Department of Health
X X X X X X
City of Cockburn
X
City of Rockingham
X X
City of Kwinana
X
Australian Department of Defence
(DoD)
X
Water Corporation
X X
Fremantle Ports
X X X X X X X
Kwinana Industries Council
X
Tronox Management Pty Ltd
X X
Conservation Council WA
X X
The University of Western Australia
(UWA)
X X X X
Murdoch University Department of Transport
5 Cockburn Sound Monitoring and Research Programs 2018
Table 1b. Summary of monitoring currently being undertaken in the Cockburn Sound marine area.
Ag en cy /O rg an is at io n un de rt ak in g/ fu nd in g th e m on ito rin g ( X ) o r o ve rs ee in g th e m on ito rin g (X )
Coastal geomorphology
Introduced marine pests
Beach profiles Multibeam/LIDAR Aerial imagery Coastline movements CHRMAP performance Cockburn Sound Management
Council/DWER
DPIRD
X
Department of Health
City of Cockburn
X X
City of Rockingham
X X
City of Kwinana
X
Department of Defence (DoD)
X
Water Corporation
Fremantle Ports
X
Kwinana Industries Council Tronox Management Pty Ltd Conservation Council WA
The University of Western Australia Murdoch University
Department of Transport
X
6
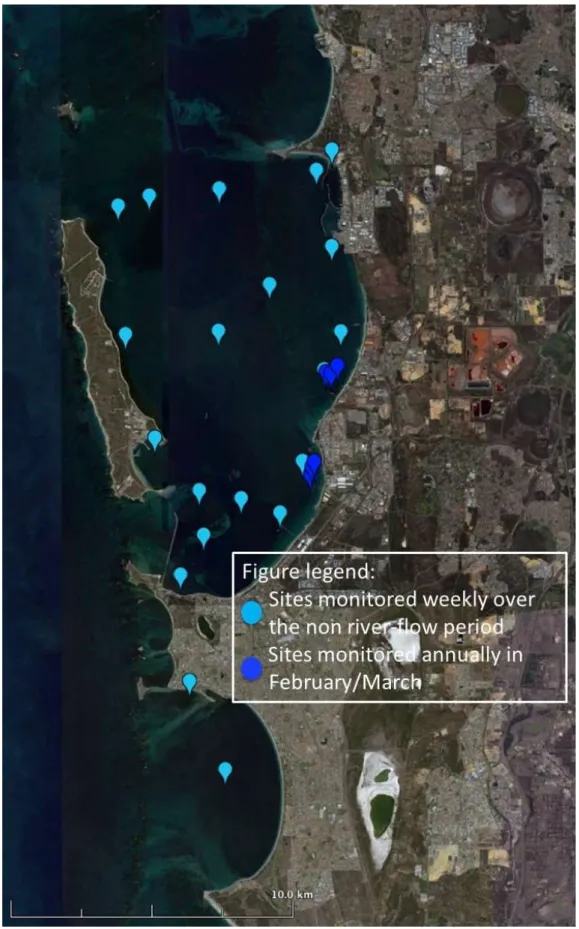
Cockburn Sound Monitoring and Research Programs 2018Figure 1. Location of nutrient and chlorophyll a water quality monitoring sites.
7
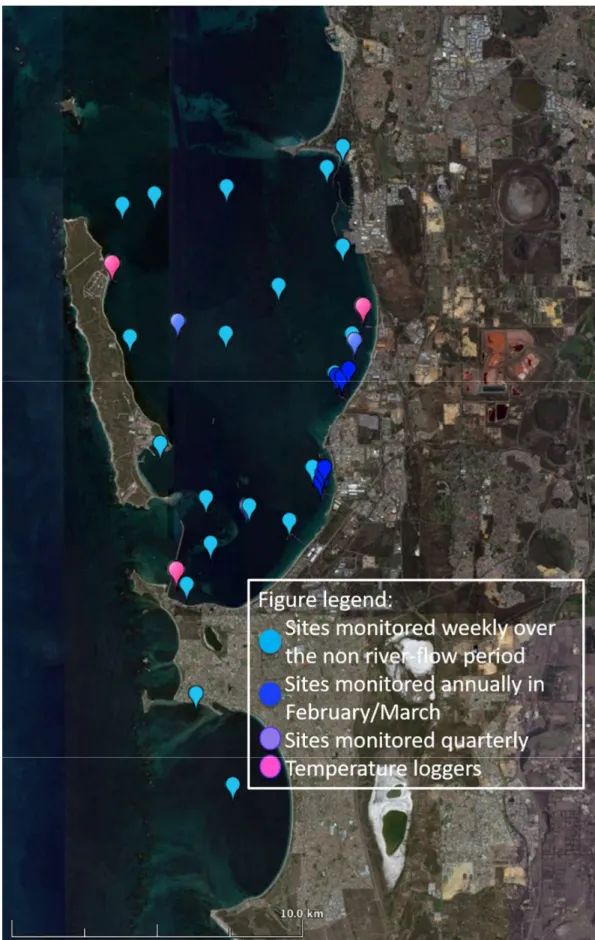
Cockburn Sound Monitoring and Research Programs 2018Figure 2. Location of physical–chemical water quality monitoring sites.
8
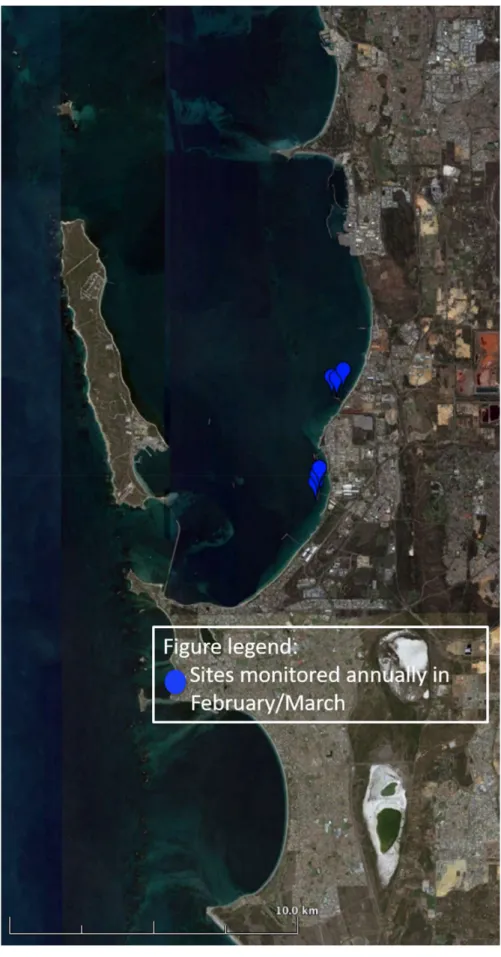
Cockburn Sound Monitoring and Research Programs 2018Figure 3. Location of contaminants in marine waters monitoring sites.
9
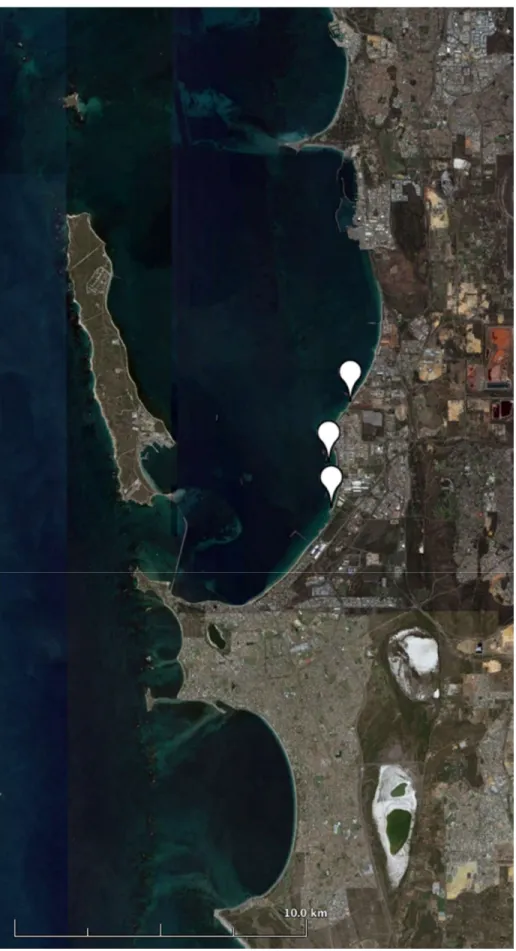
Cockburn Sound Monitoring and Research Programs 2018Figure 4. Location of sediment quality monitoring sites.
10
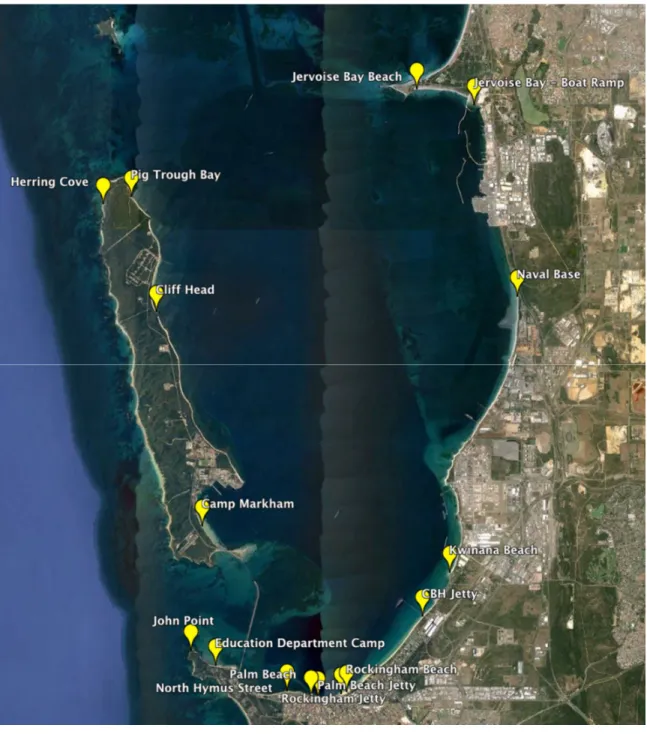
Cockburn Sound Monitoring and Research Programs 2018Figure 5. Location of bathing-beach (microbiological) monitoring sites.
11
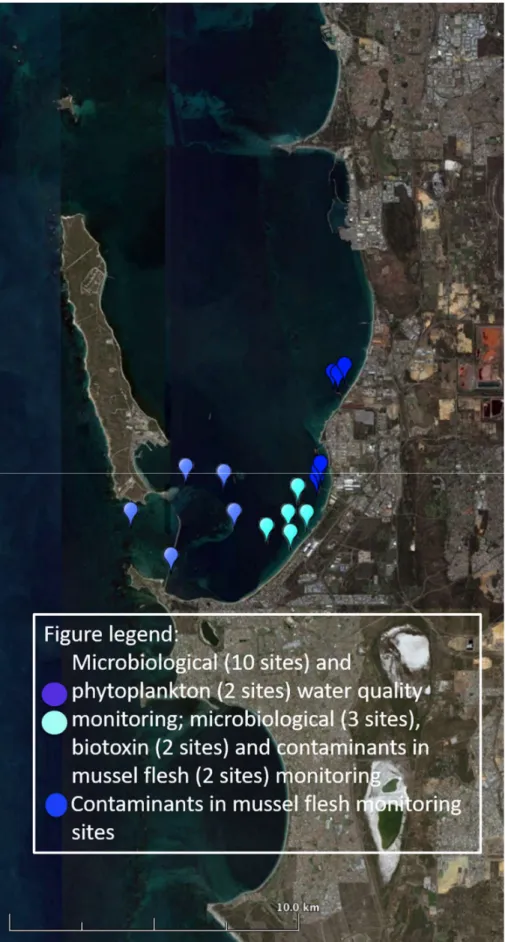
Cockburn Sound Monitoring and Research Programs 2018Figure 6. Location of seafood quality monitoring sites.
12
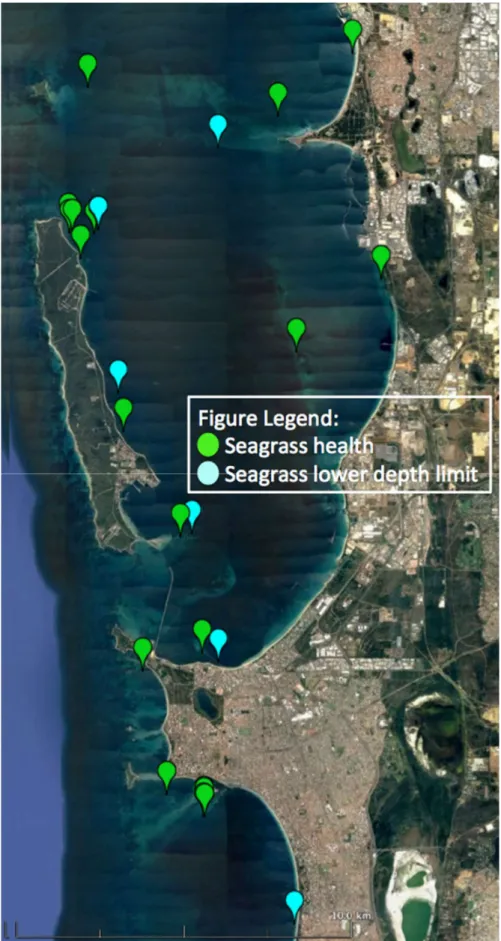
Cockburn Sound Monitoring and Research Programs 2018Figure 7. Location of seagrass health monitoring sites.
13
Cockburn Sound Monitoring and Research Programs 20182.2 Metadata for monitoring programs in the Cockburn Sound marine area
Further information on the monitoring programs currently being undertaken in the Cockburn Sound marine area is provided in:
Table 2
City of Cockburn
Table 3
City of Kwinana
Table 4
City of Rockingham
Table 5
Australian Department of Defence
Table 6
Department of Water and Environmental Regulation/CSMC
Table 7
Department of Primary Industries and Regional Development
Table 8
Department of Health
Table 9
Fremantle Ports
Table 10
Tronox Management Pty Ltd
Table 11
UWA
Table 12
Water Corporation
Table 13 provides a summary of the monitoring required by conditions of Ministerial Statements issued under Pt IV of the EP Act relating to discharges to Cockburn Sound.
Table 14 provides a summary of the monitoring required by conditions of licences
granted by DWER Regulation under Pt V of the EP Act relating to discharges to
Cockburn Sound.
14 Cockburn Sound Monitoring and Research Programs 2018
Table 2. City of Cockburn (contact person: Jonathan McKay).
Monitoring program Objective/Purpose Sites Parameters monitored Method Standard used Frequency and timing of monitoring
When monitoring started
Monitoring undertaken
by and team leader(s) Additional information City of Cockburn Beach
Monitoring and Analysis
To better understand coastal processes and the impact on beaches and coastal reserves.
From immediately south of the Island Street groyne in North Coogee to the southern extent of the Naval Base Holiday Park. (Refer to the map below for 20 locations of beach profiles).
Beach profiles Land and
hydrographic surveys of 3 profiles
(perpendicular to the shoreline).
Profiles extend from a minimum of 20 m behind the top of the primary dune or cliffs to about 500 m offshore from the waterline at mean sea level.
Elevations taken at 5 m intervals and at every change in grade.
Profiles show location of vegetation line and approximate
waterline at time of survey.
A full-coverage hydrographic multibeam and terrestrial Dynascan survey dataset covering the City of Cockburn coastline captured in March/April 2017.
Will serve as baseline for future ‘full- coverage’ monitoring.
Profiles: previously twice per year (Mar. and Oct.). From 2018, it will be once per year in Oct.
Full-coverage multibeam/LIDAR:
intention to complete in Mar./Apr. every 3 years.
Oct. 2012 City of Cockburn
engages consultants (previously MP Rogers &
Associates, drawing in part on coastal monitoring data provided for Cockburn Cement and for the Port Coogee development from Fraser Property Australia. The most recent (2017) survey and report were undertaken by EvoCoast Pty Ltd on contract to the City of Cockburn).
Survey data available on request
Beach Bacterial
Monitoring To undertake bacterial water quality
monitoring from November through to May each year including conducting and
reviewing sanitary inspections of popular beaches in partnership with the Department of Health, as part of the Metropolitan Oceans Bacterial Water Quality Monitoring Program
Sites monitored include:
Robbs Jetty; Port Coogee Beach; Coogee Beach; John Graham Reserve Beach;
Woodman Point Camp Beach; Jervoise Bay Beach; Jervoise Bay Woodman Point; and the Jervoise Bay Boat Ramp
Refer to Figure 5
Water quality Water samples taken from each of the beaches in accordance with Health Department guidelines
Health Department
guidelines Weekly from November
to May each year Unknown City of Cockburn
environmental health officers
Site classifications are updated annually and published on the Department of Health (and City of Cockburn as appropriate) website ww2.health.wa.gov.au/
Articles/A_E/Beach- grades-for-Perth- metropolitan-ocean- sites
15 Cockburn Sound Monitoring and Research Programs 2018
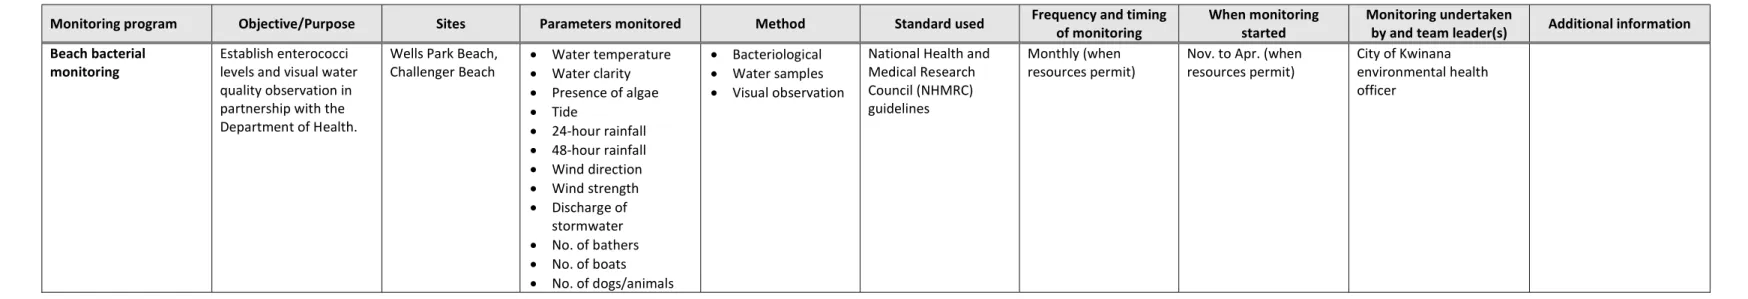
Table 3. City of Kwinana (contact person: Jarod Griffiths).
Monitoring program Objective/Purpose Sites Parameters monitored Method Standard used Frequency and timing of monitoring
When monitoring started
Monitoring undertaken
by and team leader(s) Additional information Beach bacterial
monitoring
Establish enterococci levels and visual water quality observation in partnership with the Department of Health.
Wells Park Beach, Challenger Beach
Water temperature
Water clarity
Presence of algae
Tide
24-hour rainfall
48-hour rainfall
Wind direction
Wind strength
Discharge of stormwater
No. of bathers
No. of boats
No. of dogs/animals
Bacteriological
Water samples
Visual observation
National Health and Medical Research Council (NHMRC) guidelines
Monthly (when resources permit)
Nov. to Apr. (when resources permit)
City of Kwinana environmental health officer
16 Cockburn Sound Monitoring and Research Programs 2018
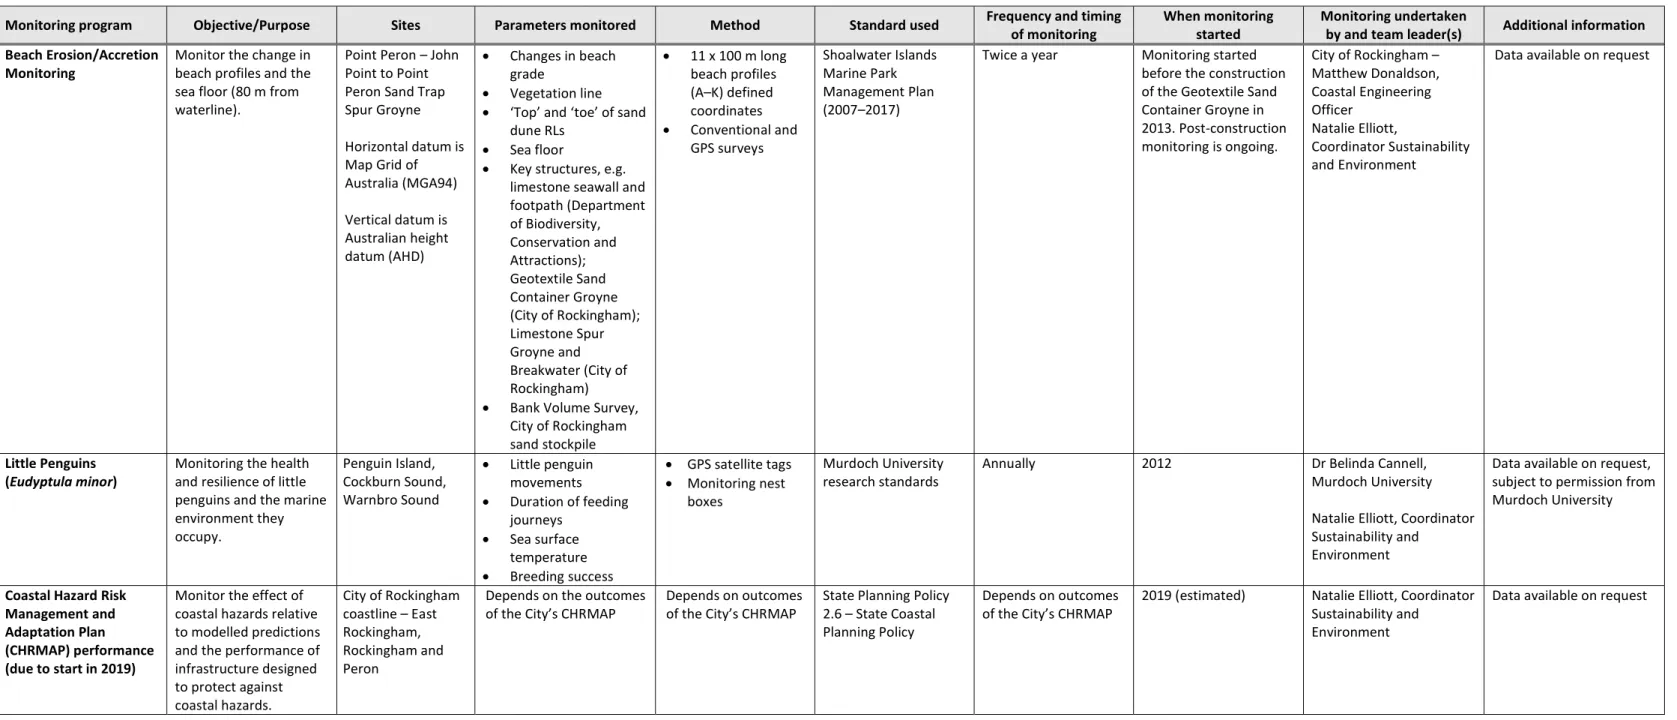
Table 4. City of Rockingham (contact person: Brett Ashby).
Monitoring program Objective/Purpose Sites Parameters monitored Method Standard used Frequency and timing of monitoring
When monitoring started
Monitoring undertaken
by and team leader(s) Additional information Beach Erosion/Accretion
Monitoring
Monitor the change in beach profiles and the sea floor (80 m from waterline).
Point Peron – John Point to Point Peron Sand Trap Spur Groyne Horizontal datum is Map Grid of Australia (MGA94) Vertical datum is Australian height datum (AHD)
Changes in beach grade
Vegetation line
‘Top’ and ‘toe’ of sand dune RLs
Sea floor
Key structures, e.g.
limestone seawall and footpath (Department of Biodiversity, Conservation and Attractions);
Geotextile Sand Container Groyne (City of Rockingham);
Limestone Spur Groyne and Breakwater (City of Rockingham)
Bank Volume Survey, City of Rockingham sand stockpile
11 x 100 m long beach profiles (A–K) defined coordinates
Conventional and GPS surveys
Shoalwater Islands Marine Park Management Plan (2007–2017)
Twice a year Monitoring started before the construction of the Geotextile Sand Container Groyne in 2013. Post-construction monitoring is ongoing.
City of Rockingham – Matthew Donaldson, Coastal Engineering Officer
Natalie Elliott,
Coordinator Sustainability and Environment
Data available on request
Little Penguins
(Eudyptula minor) Monitoring the health and resilience of little penguins and the marine environment they occupy.
Penguin Island, Cockburn Sound, Warnbro Sound
Little penguin movements
Duration of feeding journeys
Sea surface temperature
Breeding success
GPS satellite tags
Monitoring nest boxes
Murdoch University
research standards Annually 2012 Dr Belinda Cannell,
Murdoch University Natalie Elliott, Coordinator Sustainability and
Environment
Data available on request, subject to permission from Murdoch University
Coastal Hazard Risk Management and Adaptation Plan (CHRMAP) performance (due to start in 2019)
Monitor the effect of coastal hazards relative to modelled predictions and the performance of infrastructure designed to protect against coastal hazards.
City of Rockingham coastline – East Rockingham, Rockingham and Peron
Depends on the outcomes
of the City’s CHRMAP Depends on outcomes
of the City’s CHRMAP State Planning Policy 2.6 – State Coastal Planning Policy
Depends on outcomes
of the City’s CHRMAP 2019 (estimated) Natalie Elliott, Coordinator Sustainability and
Environment
Data available on request
17 Cockburn Sound Monitoring and Research Programs 2018
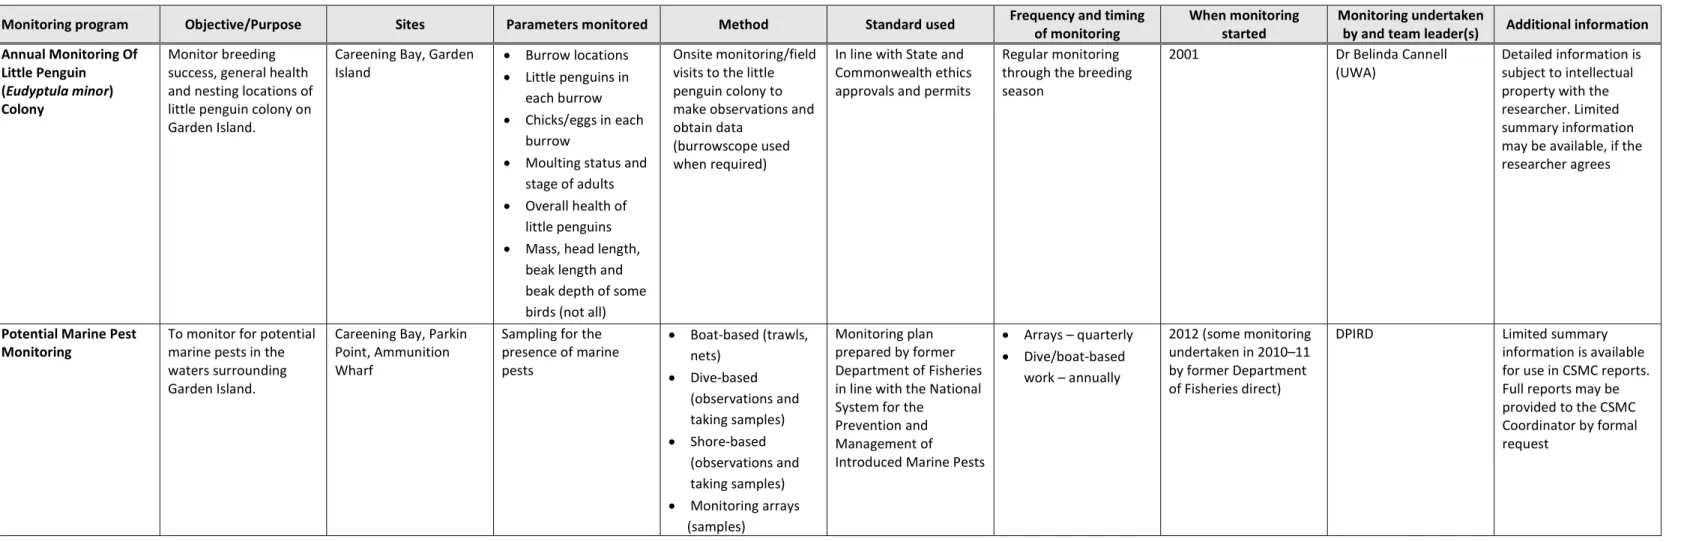
Table 5. Australian Department of Defence (contact person: Mark Sweetman).
Monitoring program Objective/Purpose Sites Parameters monitored Method Standard used Frequency and timing of monitoring
When monitoring started
Monitoring undertaken
by and team leader(s) Additional information Annual Monitoring Of
Little Penguin (Eudyptula minor) Colony
Monitor breeding success, general health and nesting locations of little penguin colony on Garden Island.
Careening Bay, Garden Island
Burrow locations
Little penguins in each burrow
Chicks/eggs in each burrow
Moulting status and stage of adults
Overall health of little penguins
Mass, head length, beak length and beak depth of some birds (not all)
Onsite monitoring/field visits to the little penguin colony to make observations and obtain data
(burrowscope used when required)
In line with State and Commonwealth ethics approvals and permits
Regular monitoring through the breeding season
2001 Dr Belinda Cannell
(UWA)
Detailed information is subject to intellectual property with the researcher. Limited summary information may be available, if the researcher agrees
Potential Marine Pest
Monitoring To monitor for potential marine pests in the waters surrounding Garden Island.
Careening Bay, Parkin Point, Ammunition Wharf
Sampling for the presence of marine pests
Boat-based (trawls, nets)
Dive-based (observations and taking samples)
Shore-based (observations and taking samples)
Monitoring arrays (samples)
Monitoring plan prepared by former Department of Fisheries in line with the National System for the
Prevention and Management of
Introduced Marine Pests
Arrays – quarterly
Dive/boat-based work – annually
2012 (some monitoring undertaken in 2010–11 by former Department of Fisheries direct)
DPIRD Limited summary
information is available for use in CSMC reports.
Full reports may be provided to the CSMC Coordinator by formal request
18 Cockburn Sound Monitoring and Research Programs 2018
Table 6. Department of Water and Environmental Regulation/Cockburn Sound Management Council (contact person: Coordinator, CSMC).
Monitoring program Objective/Purpose Sites Parameters monitored Method Standard used Frequency and timing of monitoring
When monitoring started
Monitoring undertaken
by and team leader(s) Additional information Water Quality
Monitoring
To meet the monitoring and reporting
requirements of the State Environmental (Cockburn Sound) Policy
18 sites in Cockburn Sound and two reference sites in Warnbro Sound Refer to Figure 1 and Figure 2
Chlorophyll a
Nutrients
(ammonium, nitrate + nitrite, filterable reactive phosphorus, total nitrogen, total phosphorus)
Total suspended solids and
particulate organic carbon
Physical–chemical parameters:
temperature, salinity, pH, turbidity, dissolved oxygen, fluorescence
Secchi disc depth
Light attenuation
Depth integrated water sample
Depth integrated water sample and discrete surface and bottom samples at two sites
Sea-Bird Electronics SBE19plus V2 vertical profiling conductivity–
temperature–
depth (CTD)
Secchi disc
Simultaneous measurement using 2 underwater light sensors (1 m and 7 m below surface)
Manual of standard operating procedures for environmental
monitoring against the Cockburn Sound environmental quality criteria (EPA 2005)
About weekly on 16 occasions over the non-river flow period (Dec. to Mar.)
Monitoring at some sites started in 1983 (additional sites incorporated since that time)
Murdoch University’s Marine and Freshwater Research Laboratory (MAFRL); Mr Kris Wienczugow
State of Cockburn Sound reports published on the CSMC website
Data/data reports available on request from
Seagrass Health
Monitoring To meet the monitoring and reporting
requirements of the State Environmental (Cockburn Sound) Policy.
11 sites in Cockburn Sound
5 sites outside Cockburn Sound
6 depth transect sites (Garden Island North and South, Southern Flats, Mangles Bay, Woodman Point, Warnbro Sound)
5 reference sites in Warnbro Sound Refer to Figure 7
Shoot density
Shoot height
Percentage cover
Lower depth limit and depth along depth transects
Counts in permanent quadrats
Measurements in permanent quadrats
Photograph of quadrat and point count analysis
Field
measurements along transect line
Manual of standard operating procedures for environmental
monitoring against the Cockburn Sound environmental quality criteria (EPA 2005)
Annually (generally in
Jan. to Feb). Current program started 2003–06
Historical monitoring undertaken since 1994
The Western Australian Marine Science
Institution (WAMSI); Dr Matthew Fraser/Prof.
Gary Kendrick/
Dr Michael Rule
State of Cockburn Sound reports published on the CSMC website
Recent data reports published on the CSMC website
Data available on request from
Seagrass Mapping To provide information on the current extent and distribution of seagrass (and other benthic habitat) in Cockburn Sound and to assess changes in seagrass area over time.
Cockburn Sound-wide Distribution of seagrass
habitat Classification of WorldView–3 satellite imagery
Field surveys (towed video)
None applicable Every 5 years Mapping previously undertaken in 1999 and 2012
UWA; Dr Renae Hovey/Dr Matthew Fraser
Report published on the CSMC website
Data available on request from
19 Cockburn Sound Monitoring and Research Programs 2018
Table 7. Department of Primary Industries and Regional Development (contact person: Dr Dan Gaughan).
Monitoring program Objective/Purpose Sites Parameters monitored Method Standard used Frequency and timing of monitoring
When monitoring started
Monitoring undertaken
by and team leader(s) Additional information Garden Island Early
Warning Surveillance
Surveillance of introduced marine pests.
4 sites within
Department of Defence (DoD) port area at Garden Island – details in unpublished reports (see ‘Additional Information’ column)
Temperature (see crab monitoring)
Introduced pest presence/absence only
Shoreline surveys
Passive arrays
Crab traps
Crab condos
In situ data loggers (please refer to crab monitoring data)
Unpublished internal Department of Fisheries Standard Operating
Procedure (SOP)
Seasonally (every 3 months)
Crab traps and shoreline every 6 months (summer–
winter)
2012 Marine Biosecurity
Science and Surveillance Section – Dr Justin McDonald
Unpublished report
Garden Island National Introduced Marine Pest Monitoring
Surveillance of introduced
marine pests. 4 sites within
Department of Defence port area at Garden Island, plus one site at the Ammunitions Jetty – details contained in unpublished reports (see ‘Additional Information’ column)
Temperature (see crab monitoring)
Introduced pest presence/absence only
Crab traps
Benthic sleds
Beam trawls
Phytoplankton and zooplankton tows
Subtidal infrastructure surveys
Shoreline searches
Australian Marine Pest Monitoring Guidelines version 2.0 (Cwlth of Australia 2009) Unpublished Internal Department of Fisheries SOP
Once a year (Feb.) 2012 Marine Biosecurity
Science and Surveillance Section – Dr Justin McDonald
Unpublished report
Port of Fremantle National Introduced Marine Pest Monitoring
Surveillance of introduced
marine pests. 4 sublocalities within Cockburn Sound – details contained in unpublished reports (see ‘Additional Information’ column)
Introduced pest
presence/absence only Crab traps
Benthic sleds
Beam trawls
Phytoplankton and zooplankton tows
Subtidal infrastructure surveys
Shoreline searches
Australian Marine Pest Monitoring Guidelines Version 2.0 (Cwlth of Australia 2009) Department of Fisheries SOP
Once a year (Mar. to
Apr.) 2011 Marine Biosecurity
Science and Surveillance Section – Dr Justin McDonald
Unpublished reports:
AUFRE PIR 2013 PIR AUFRE 2015
Port of Fremantle Early
Warning System Surveillance of introduced
marine pests. 6 sites within Cockburn Sound – details contained in unpublished reports (see Additional Information column)
Introduced Pest
presence/absence only Shoreline surveys
Passive arrays
Crab traps
Crab condos
Unpublished internal Department of Fisheries SOP
Seasonally (every 3 months)
Crab traps and shoreline every 6 months (summer–
winter)
2013 Marine Biosecurity
Science and Surveillance Section – Dr Justin McDonald
Unpublished reports:
South Australia FPA 2012 final draft
FPA final report 2011–12 EWS Fremantle final report 2013–14
FPA annual report 2015 West Coast Nearshore
Finfish Monitoring Monitoring of nearshore finfish species as part of the management regime for the Cockburn Sound (Fish Net) Managed Fishery, and West Coast Nearshore Estuarine Finfish Resource.
Jetski Beach, Mangles Bay (netting);
numerous sites for commercial and recreational fishing
Temperature
Salinity
Juvenile finfish abundance
Blue swimmer crab (Portunus armatus) abundance
Herring and garfish skeletons (from commercial and recreational fishers)
Commercial catch/effort
Handheld
temperature/salinity probe
Beach seine netting
Statutory logbook returns
Refer to Fisheries research reports and relevant Status Reports of the Fisheries and Aquatic Resources (SOFAR) section for details (see
‘Additional Information’
column)
Juvenile fish and environmental data one day per month mostly between Sept.
and Feb. each year Commercial catch/effort and skeletons monthly
Fish abundance 1994–
2016; crabs 2005–16 Temperature and salinity off beach 1999–2016 Herring/garfish 2009–10
Nearshore/Estuarine Finfish Section – Dr Kim Smith
Fisheries research reports 246, 247, 248, 271 SOFAR
West Coast Demersal
Scalefish Monitoring Monitoring of demersal finfish species as part of the Cockburn Sound (Line and Pot) Managed Fishery.
Numerous sites (see details in Fisheries research reports and peer reviewed publications) (see
‘Additional information’
Pink snapper (Pagrus auratus) egg abundance
Pink snapper tagging
Baited remote video (BRUV) surveys
Finfish tag and release sampling
Refer to Fisheries research reports, peer reviewed journal articles, and relevant SOFAR section for details
Annual surveys Tagging and egg surveys conducted in Nov. spawning period, one day every year
Biological 2002 BRUV sampling 2009 Temperature and salinity data
West Coast Demersal Finfish Section – Dr David Fairclough
Fisheries Research Reports 174, 181, 186, 187, 191, 250, 261
Breheny NB, Beckley LE &
Wakefield CB 2012,
20 Cockburn Sound Monitoring and Research Programs 2018
Monitoring program Objective/Purpose Sites Parameters monitored Method Standard used Frequency and timing
of monitoring When monitoring
started Monitoring undertaken
by and team leader(s) Additional information
column) Finfish abundance
Juvenile recruitment
Skeletons from recreational fishers
Commercial catch /effort
Ichthyoplankton sampling (bongo net)
(Trawl surveys – as part of blue swimmer crab sampling)
Statutory logbook returns
(see ‘Additional Information’
column) BRUV sampling
conducted once annually (Apr. to May) Monthly logbook returns
associated with egg sampling from 2002 (2005 and 2009 missing)
‘Ichthyoplankton assemblages associated with pink snapper (Pagrus auratus) spawning aggregations in coastal embayments of south- western Australia’, Journal of the Royal Society of Western Australia, vol. 95, pp. 103–114.
Wakefield CB 2010, ‘Annual, lunar and diel reproductive periodicity of a spawning aggregation of snapper Pagrus auratus (Sparidae) in a marine embayment on the lower west coast of
Australia’, Journal of Fish Biology, vol. 77, pp. 1359–
78.
Wakefield CB, Fairclough DV, Lenanton RCJ & Potter IC 2011, ‘Spawning and nursery habitat partitioning and movement patterns of Pagrus auratus (Sparidae) on the lower west coast of Australia’, Fisheries Research, vol. 109, pp. 243–
51.
Wakefield CB, Lewis PD, Coutts TB, Fairclough DV &
Langlois TJ 2013, ‘Fish assemblages associated with natural and
anthropogenically-modified habitats in a marine embayment: comparison of baited videos and opera- house traps’, PLOS ONE, http://journals.plos.org/plos one/article?id=10.1371%2Fj ournal.pone.0059959 SOFAR
(a) Map showing location of sites sampled for pink snapper egg abundance
(b) Map showing locations where BRUVs are deployed
Cockburn Sound Blue Swimmer Crab Monitoring
Monitoring of blue swimmer crab as part of the Cockburn Sound Crab Fishery and West Coast Blue Swimmer Crab Fishery
Details contained in Fisheries research reports (see ‘Additional information’ column)
Temperature (logger) (Refer to Figure 2)
Temperature (handheld)
Dissolved oxygen (handheld)
pH (handheld)
Salinity (handheld)
In situ temperature data loggers
Handheld sensor
Otter trawl surveys
Commercial crab trap surveys
Statutory logbook returns
Refer to Fisheries research reports and relevant SOFAR section for details (see ‘Additional information’
column)
Monthly during spawning (Sept. to Dec.) and recruitment (Apr. to Jun.) period annually
In situ data loggers collect data hourly, other ad hoc/
occasional water
Commercial crab monitoring 1999 Independent breeding stock 2001
Independent juvenile recruitment trawls 2002
Crab section – Dr Danielle Johnston
SOFAR
21 Cockburn Sound Monitoring and Research Programs 2018
Monitoring program Objective/Purpose Sites Parameters monitored Method Standard used Frequency and timing
of monitoring When monitoring
started Monitoring undertaken
by and team leader(s) Additional information
Temperature (in situ loggers)
Blue swimmer crab juvenile abundance
Blue swimmer crab adult abundance
Commercial catch/effort
quality sampling as detailed in next column
Monthly deployment of commercial crab traps
Monthly logbook returns
Handheld data 2007–
10 (large gaps in dataset)
In situ temperature data loggers from 2007 (two sites have been discontinued)
Octopus (Octopus tetricus) fishery Monitoring
Monitoring as part of the Cockburn Sound (Line and Pot) Managed Fishery and the Octopus Fishery Management
Details contained in Fisheries research reports (see ‘Additional information’ column)
Commercial
catch/effort Statutory logbook returns Refer to Fisheries research reports and relevant SOFAR section for details (see ‘Additional information’
column)
Monthly logbook
returns 2001 Mollusc Section – Dr
Anthony Hart Fisheries Research Report 270
SOFAR
Shark hazard
monitoring Monitoring for shark biology and hazard mitigation
Details contained in Fisheries research reports (see ‘Additional Information’ column)
Movement Metro array of passive acoustic telemetry shark monitoring network was dismantled on 10 February 2016
Refer to Fisheries research reports (see ‘Additional Information’
column)
Daily monitoring by
acoustic data loggers 2009 Shark Section – Dr Matias
Braccini Fisheries Research Report 273
Statewide recreational fishing
Monitoring of statewide boat-based recreational fishing
Details contained in Fisheries research reports (see ‘Additional information’ column)
Recreational fishing effort
Phone surveys
Boat ramp surveys
Refer to Fisheries research reports (see ‘Additional information’
column)
Two yearly (after 2011) Occasional sampling prior to 2011–12 sampling (detailed in Fisheries research reports)
1996 Surveys Section – Dr
Karina Ryan
Fisheries Research Reports 249, 268, 287
Fisheries Research Contract Report 023
22 Cockburn Sound Monitoring and Research Programs 2018
Table 8. Department of Health (contact person: Tracey Stamp).
Monitoring program Objective/Purpose of
monitoring program Sites Parameters monitored Method Standard used Frequency and timing of
monitoring When monitoring started Monitoring undertaken
by and team leader(s) Additional information Western Australia
Shellfish Quality Assurance Program (WASQAP) – shellfish (mussel) monitoring
To minimise the level of risk and protect the health of consumers from foodborne illness
10 monitoring sites in 2 areas of Cockburn Sound (Kwinana Grain Terminal and Southern Flats) (refer to map below and Figure 6)
10 microbiological water sampling sites (total coliforms, thermotolerant coliforms, E. coli)
Water sample WASQAP/Australian Shellfish Quality Assurance Program (ASQAP)
13 times per year at Kwinana Grain Terminal and 6 times per year at Southern Flats, with sampling spread over the year
Pre-2004 Glenn Dibbin – industry representative
All results contained in Cockburn Sound Shellfish Harvesting Area – Annual Reviews. Reports available on request.
Two water phytoplankton monitoring sites – microalgae species enumerated as per the Marine Biotoxin Monitoring and Management Plan
Depth integrated water sample
WASQAP/ASQAP Twice monthly Pre-2004 Glenn Dibbin – industry
representative
All results contained in Cockburn Sound Shellfish Harvesting Area – Annual Reviews. Reports available on request.
3 microbiological flesh sampling sites (E. coli)
Mussel sample WASQAP/ASQAP Food Standards Code
13 times per year at Kwinana Grain Terminal and 6 times per year at Southern Flats, with sampling spread over the year
Pre-2004 Glenn Dibbin – industry
representative All results contained in Cockburn Sound Shellfish Harvesting Area – Annual Reviews. Reports available on request.
Two biotoxin flesh monitoring sites (amnesic shellfish poisoning (ASP)/diarrhoetic shellfish poisoning (DSP)/paralytic shellfish poisoning (PSP))
Mussel sample Food Standards
Code Monthly Prior to April 2016,
monitoring for biotoxin levels in flesh samples occurred only when phytoplankton trigger levels had been exceeded.
During May 2015 and April 2016 quarterly monitoring was undertaken. Since May 2016 monthly testing is a requirement
Glenn Dibbin – industry representative
Chemicals (copper, zinc, cadmium, lead, mercury and inorganic arsenic, organochlorine and organophosphate pesticides, polychlorinated biphenyls (PCBs))
Mussel sample Food Standards Code
Annually (during summer) Pre-2004 Glenn Dibbin – industry representative
Bacterial water quality monitoring program for recreational waters
To classify the health risk associated with popular primary contact (e.g.
swimming) at recreational sites and to inform the community
10 sites: Jervoise Bay Beach, Naval Base, Kwinana Beach, Rockingham Jetty, Palm Beach Jetty, North Hymus Street, Cliff Head, Pig Trough Bay, Herring Cove, Camp Markum
Enterococci (in some
instances E. coli) Water sample
(grab sample) Fortnightly seasonal (Nov.
to May); Infrequent/
occasional/sporadic/
response monitoring (May to Nov.)
Established in the 1960s City of Rockingham, City of Kwinana, City of Cockburn and
Department of Defence
Site classification summaries published on Department of Health website
23 Cockburn Sound Monitoring and Research Programs 2018
Monitoring program Objective/Purpose of
monitoring program Sites Parameters monitored Method Standard used Frequency and timing of
monitoring When monitoring started Monitoring undertaken
by and team leader(s) Additional information Six reference sites:
Jervoise Bay – Boat Ramp, CBH Jetty, Rockingham Beach, Palm Beach, Education
Department Camp, John Point
Refer to Figure 5
24 Cockburn Sound Monitoring and Research Programs 2018
Table 9. Fremantle Ports (contact person: Denis Doak).
Monitoring program Objective/Purpose Sites Parameters monitored Method Standard used
Frequency and timing of monitoring
When monitoring started
Monitoring undertaken by and
team leader(s) Additional information Water Quality
Monitoring Assess impacts to the environment of various port- related activities.
Satisfy the requirements of ISO 14001.
Integrate and support existing environmental monitoring carried out by other agencies.
Meet current environmental licence requirements.
Kwinana Bulk Terminal Site Easting Northing KBT1 383575 6435777 KBT2 383178 6435540 KBT3 383349 6435488 Kwinana Bulk Jetty
Site Easting Northing KBJ1 382783 6432386 KBJ2 383178 6432179 KBJ3 383349 6431899 Refer to Figure 1, Figure 2 and Figure 3
Temperature
Salinity
Dissolved oxygen
pH
Secchi disc depth
Total suspended solids
Nutrients (total nitrogen, total phosphorus, ammonium, nitrate + nitrite, filterable reactive
phosphorus)
Dissolved organic carbon
Alkalinity
Chlorophyll a, b, c and phaeophytin
Total petroleum hydrocarbons (TPH)
BTEX (benzene, toluene, ethylbenzene, xylenes)
Dissolved copper
Profiles using a Sea- bird 19 Multiprobe Logger
Secchi disc
Surface (~ 0.5 m below surface) samples (all parameters) and bottom (~ 0.5 m from seabed) samples (nutrients)
Australian and New Zealand guidelines for fresh and marine water quality
(ANZECC/ARMCANZ 2000) The State Environmental (Cockburn Sound) Policy;
Environmental Quality Criteria Reference Document for Cockburn Sound (EPA 2015)
Annually from Jan.
to Mar. 2001 BMT Western Australia
Pty Ltd and Murdoch University’s MAFRL
Data available annually (May to Jun.)
Sediment Monitoring Assess the impacts to the environment of various port- related activities.
Satisfy the requirements of ISO 14001.
Integrate and support existing environmental monitoring carried out by other agencies.
Meet current environmental licence requirements.
Kwinana Bulk Terminal and Kwinana Bulk Jetty
Refer to Figure 4
Total Kjeldahl nitrogen, total phosphorus
Total organic carbon
Arsenic, cadmium, chromium, copper, lead, mercury, zinc, selenium
Organotins (TBT, DBT, MBT)
Polycyclic aromatic hydrocarbons (PAH)
TPH
(1) Diver collected sediment cores (100 mm diameter) (2) 5 cores collected
within same square metre (3) Top 2 cm from
each core separated and homogenised to make up one composite sample (4) One composite
sample collected at each site.
(5) Each core
photographed and described (colour, type of sediment, oxidation layer, presence of biota).
Australian and New Zealand guidelines for fresh and marine water quality
(ANZECC/ARMCANZ 2000) The State Environmental (Cockburn Sound) Policy;
Environmental Quality Criteria Reference Document for Cockburn Sound (EPA 2015)
Annually (Jan. to
Mar.) 2001 BMT Western Australia
Pty Ltd and MAFRL Data available annually (May to Jun.)
Sentinel Mussels Assess the impacts to the environment
Kwinana Bulk Terminal and
Kwinana Bulk Jetty Inorganic arsenic, cadmium,
chromium, copper,
Sentinel mussels (50–90 mm length) deployed on
Australian and New Zealand guidelines for fresh and marine water
Annually (Jan. to
Mar.) 2001 BMT Western Australia
Pty Ltd and MAFRL Data available annually (May to Jun.)
25 Cockburn Sound Monitoring and Research Programs 2018
Monitoring program Objective/Purpose Sites Parameters monitored Method Standard used Frequency and
timing of monitoring
When monitoring started
Monitoring undertaken by and
team leader(s) Additional information of various port-
related activities.
Satisfy the requirements of ISO 14001.
Integrate and support existing environmental monitoring carried out by other agencies.
Meet current environmental licence requirements.
Refer to Figure 6 lead, mercury, zinc, selenium
Organotins (TBT, DBT, MBT)
PAH
mussel lines in mesh baskets suspended ~ 1 m below the surface from a fixed jetty
Mussels deployed for 6 weeks
quality
(ANZECC/ARMCANZ 2000) The State Environmental (Cockburn Sound) Policy;
Environmental Quality Criteria Reference Document for Cockburn Sound (EPA 2015)
Marine Pests Surveillance of introduced marine pests.
2 shoreline search sites and 2 array deployment sites in Cockburn Sound
Introduced pest
presence/absence Shoreline searches
Settlement arrays and next
generational sequencing
Department of Fisheries’
State Wide Array Surveillance Program, technical manual (Department of Fisheries 2016)
Settlement arrays deployed for ~2 month soak period, twice a year (summer and winter)
Shoreline searches conducted twice a year at the same time as array collection
New format implemented since August 2016
Fremantle
Ports/DPIRD Early warning system implemented prior to August 2016
Seagrass Mapping To provide information on the current extent and distribution of seagrass (and other benthic habitat) in Cockburn Sound and to assess changes in seagrass area over time
Cockburn Sound-wide Distribution of seagrass
habitat Classification of WorldView–3 satellite imagery
Field surveys (towed video)
None applicable Every 5 years Mapping previously undertaken in 1999 and 2012
UWA – Dr Renae Hovey/Dr Matthew Fraser
Report published on the CSMC website
Data available on request from
26 Cockburn Sound Monitoring and Research Programs 2018
Table 10. Tronox Management Pty Ltd, Tronox Kwinana Pigment Plant (contact person: Miranda Robinson).
Monitoring program Objective/Purpose Sites Parameters monitored Method Standard used Frequency and timing
of monitoring
When monitoring started
Monitoring undertaken by
and team leader(s) Additional information Sediment Monitoring DWER licence
compliance L5320/1988/14
Site Easting Northing 25N 382785 6433123 25S 382787 6433070 25E 382815 6433099 25W 382769 6433096 25NW 382768 6433121 50W 382734 6433098 50NW 382763 6433145 200N 382784 6433302 200E 382815 6433099 200W 382589 6433096 Refer to Figure 4
Total organic carbon
Particle size distribution
Aluminium
Iron
Lead
Mercury
Manganese
Titanium
Vanadium
Sediment cores (100 mm diameter) collected by divers
Australian and New Zealand guidelines for fresh and marine water quality (ANZECC/ARMCANZ 2000) ISQG levels Environmental quality criteria reference document for Cockburn Sound (EPA 2005)
3-yearly (last round 2015)
Current program started in 2006 Historical monitoring has occurred since plant commissioning in 1991
BMT Western Australia Pty Ltd
Reports are submitted to DWER as required by the licence
Loss on ignition [LOI]
Total Kjeldahl nitrogen
Total phosphate
Antimony
Arsenic
Cadmium
Chromium
Cobalt
Copper
Nickel
Silver
Zinc
Radium-226
Radium-228
Thorium-228
6-yearly (last round 2012)
27 Cockburn Sound Monitoring and Research Programs 2018
Table 11. The University of Western Australia (contacts: Professor Gary Kendrick, Dr Matthew Fraser, Dr Belinda Cannell).
Monitoring program Objective/Purpose Sites Parameters monitored Method Standard used Frequency and timing of monitoring
When monitoring started
Monitoring undertaken
on behalf of Additional information Seagrass Health
Monitoring
(currently undertaken by Dr Matthew Fraser, Prof. Gary Kendrick (both UWA) and Dr Michael Rule (Department of Biodiversity, Conservation and Attractions)
To meet the monitoring and reporting
requirements of the State Environmental (Cockburn Sound) Policy.
16 potential impact sites; 11 in Cockburn Sound, 5 outside Cockburn Sound
5 reference sites in Warnbro Sound
6 depth transect sites (Garden Island North and South, Southern Flats, Mangles Bay, Warnbro Sound and Woodman Point) Refer to Figure 7
Seagrass (Posidonia sinuosa) shoot density
Seagrass canopy height
Percentage cover
Lower depth limit of seagrass meadows at depth transects
Standardised methodology that consists of:
counts and measurements in permanent quadrats;
photograph of quadrat and point count analysis; and
field measurements along transect line
Manual of standard operating procedures for environmental monitoring against the Cockburn Sound environmental quality criteria (EPA 2005)
Annually (generally in Jan. to Feb.)
Current program started 2003–06
Historical monitoring undertaken since 1994
WAMSI (Prof. Gary Kendrick/Dr Michael Rule) under a Service Level Agreement with DWER
State of Cockburn Sound reports published on the CSMC website
Recent data reports published on the CSMC website
Data available on request from
Seagrass Mapping To provide information on the current extent and distribution of seagrass (and other benthic habitat) in Cockburn Sound and to assess changes in seagrass area over time.
Cockburn Sound-wide Distribution of seagrass
habitat Classification of WorldView–3 satellite imagery
Field surveys (towed video)
None applicable Every 5 years Mapping previously undertaken in 1999 and 2012
UWA – Dr Renae Hovey/Dr Matthew Fraser
Report published on the CSMC website
Data available on request from
Health of Little Penguins (Eudyptula Minor) on Garden Island
To determine the health of the little penguin colony on Garden Island.
Garden Island Timing of breeding
Breeding success
Foraging habitat
Diet
Causes of mortality
Population estimates
Regular monitoring of all burrows and nest boxes within the colony
Deployment of tags (GPS, 3D)
Collection of faecal samples
Necropsies
Counts of active burrows
None applicable Burrows monitored once a month
Tags attached to birds guarding chicks. Young chicks are found May to Nov. so tags are potentially deployed and retrieved in any of these months
Population estimate annually
2001 UWA and DoD No funding available for the
diet analysis or foraging habitat. Diet samples have been collected in some years but not analysed. Foraging habitat determined in some years but not funded.
28 Cockburn Sound Monitoring and Research Programs 2018
Table 12. Water Corporation (contact person: Grant Griffith).
Monitoring program Objective/Purpose
Sites Parameters
monitored Method Standard used Frequency and
timing of monitoring
When monitoring started
Monitoring undertaken by and team leader(s)
Additional information Routine Water
Quality Monitoring
To observe if there are any irregular changes in water quality.
To fulfil obligations of Ministerial Statement no.
655.
50H 380136 6431053
Water Corporation site reference: South (the historical location of the Southern RTMS station). This site is in deep water in the southern part of the Sound and was used for calibration of real-time sensors and for response monitoring based on low dissolved oxygen trigger. Data are still collected from this location to observe irregular changes and to record seasonal patterns. (Refer to adjacent map for site locations and Figure 2).
50H 377680 6437341
Water Corporation site reference: Central (the historical location of the Central RTMS station).
This site is in deep water in the central part of the Sound and was used for calibration of real- time sensors and for response monitoring based on low dissolved oxygen trigger. Data are still collected from this location to observe irregular changes and to record seasonal patterns.
50H 377334 6444407
Water Corporation site reference: Parmelia. A historical location used to monitor dissolved oxygen in shallow water as a reference site for water just outside the Sound.
50H 379071 6446878
Water Corporation site reference: OA2. A deep- water reference site in Owen Anchorage that is designed to show natural dissolved oxygen variation in a reference embayment location outside of Cockburn Sound. This site is a historical water quality site for Owen Anchorage that has previously been monitored by the CSMC.
50H 383769 6436757
Water Corporation site reference: DIFF50W.
Site added in June 2014. It is 50 m west, off the end of the diffuser. Used to calibrate against online seawater intake monitors onsite.
Redundant sites. Data collection ceased in June 2014.
Causeway
50 H 377927 6431583
North RTMS location 50 H 377175 6441257
Depth profiling for:
temperature
salinity
conductivity
dissolved oxygen (percentage and milligrams per litre)
A calibrated handheld Sea- bird Logger
Refer to Murdoch University’s MAFRL
Jul. 2015 – current:
quarterly (Jan. Apr.
Jul. and Oct.) Jun. 2014 – Jun.
2015: monthly Dec. 2010 – May 2014: fortnightly and during low dissolved oxygen (DO) events Pre-Dec. 2010:
weekly/fortnightly and during low DO events
Operational marine monitoring started in 2006
MAFRL; Mr Kris Wienczugow
Data available on request from the Water Corporation
Real-Time, Online Water Quality Monitoring Of Intake
Seawater quality determines the level of pretreatment required to
Seawater Intake Building at the Perth Seawater
Desalination Plant pH
Conductivity
Turbidity
Onsite instrumentation which feeds into the site’s SCADA system
Instruments are calibrated to Australian
Continuous during
Plant operation 2006 proAlliance staff Data
available on request
29 Cockburn Sound Monitoring and Research Programs 2018
Monitoring program Objective/Purpose Sites Parameters
monitored Method Standard used Frequency and
timing of monitoring When monitoring
started Monitoring undertaken
by and team leader(s) Additional information Seawater ensure optimal
performance of the reverse osmosis system and to prevent fouling and scaling.
Oxidation reducing potential (ORP)
Hydrocarbons
Temperature
Oxygen
Silt density index (SDI)
Standards from the
Water Corporation
Laboratory Water Quality Analysis of Intake Seawater
Seawater quality determines the level of pretreatment required to ensure optimal
performance of the reverse osmosis system and to prevent fouling and scaling.
Seawater Intake Building at the Perth Seawater
Desalination Plant Bacteria Samples are collected by
proAlliance staff using the Water Corporation’s internal sampling procedures which incorporate
requirements from the Australian Standard for Water Quality Sampling (AS/NZS 5667.1:1998) and the Standard methods for the examination of water and wastewater (21st edn).
Samples couriered to an external National Association of Testing Authorities (NATA) registered laboratory for analysis
Standard methods for the examination of water and wastewater – APHA AWWA WEF
Weekly sampling 2006 Sample collection by proAlliance staff, analysis by external laboratory
Data available on request from the Water Corporation
Laboratory Water Quality Analysis of Intake Seawater
Seawater quality determines the level of pretreatment required to ensure optimal
performance of the reverse osmosis system and to prevent fouling and scaling
Seawater Intake Building at the Perth Seawater
Desalination Plant Phytoplankton Samples are collected by
proAlliance staff using the Water Corporation’s internal sampling procedures that incorporate
requirements from the Australian Standard for Water Quality Sampling (AS/NZS 5667.1:1998) and the Standard methods for the examination of water and wastewater (21st edn).
Samples couriered to an external NATA
registered laboratory for analysis
Standard methods for the examination of water and wastewater – APHA AWWA WEF
Monthly sampling 2006 Sample collection by proAlliance staff, analysis by external laboratory
Data available on request from the Water Corporation
Laboratory Water Quality Analysis of Intake Seawater
Seawater quality determines the level of pretreatment required to ensure optimal
performance of the reverse osmosis system and to prevent fouling and scaling
Seawater Intake Building at the Perth Seawater
Desalination Plant Hydrocarbons
Nutrients
Antimony
Cadmium
Copper
Chromium
Lead
Samples are collected by proAlliance staff using the Water Corporation’s internal sampling procedures that incorporate
requirements from the Australian Standard for
Standard Methods for the Examination of Water and Wastewater – APHA AWWA WEF
Quarterly sampling 2006 Sample collection by proAlliance staff, analysis by external laboratory
Data available on request from the Water Corporation
30 Cockburn Sound Monitoring and Research Programs 2018
Monitoring program Objective/Purpose Sites Parameters
monitored Method Standard used Frequency and
timing of monitoring When monitoring
started Monitoring undertaken
by and team leader(s) Additional information
Nickel
Zinc
Arsenic
Barium
Beryllium
Boron
Mercury
Molybdenum
Selenium
Silver
Uranium
pH
Conductivity
Colour
Alkalinity
Aluminium
Calcium
Filterable organic carbon
Hardness
Iron
Magnesium
Manganese
Potassium
Silicon
Sulfur
Sulfate
Turbidity
Bromine
Fluorine
Suspended solids
Total filterable solids
Water Quality Sampling (AS/NZS 5667.1:1998) and the Standard methods for the examination of water and wastewater (21st edn).
External NATA registered laboratory
Laboratory Water Quality Analysis of Intake Seawater
Seawater quality determines the level of pretreatment required to ensure optimal
performance of the reverse osmosis system and to prevent fouling and scaling
Seawater Intake Building at the Perth Seawater
Desalination Plant Iodine
Cyanide
Pesticides
Samples are collected by proAlliance staff using the Water Corporation’s internal sampling procedures that incorporate
requirements from the Australian Standard for Water Quality Sampling (AS/NZS 5667.1:1998) and the Standard methods for the examination of water and wastewater (21st ed.).
External NATA registered laboratory
Standard methods for the examination of water and wastewater – APHA AWWA WEF
Annual sampling 2006 Sample collection by proAlliance staff;
analysis by external laboratory
Data available on request from the Water Corporation
31 Cockburn Sound Monitoring and Research Programs 2018
Table 13. Monitoring required by Ministerial Statements issued under Pt IV of the Environmental Protection Act 1986 relating to discharges to Cockburn Sound.
Proposal/Proponent Ministerial
Statement no. Condition Monitoring requirements/commitments Other information
Kwinana Gas-Fired Power Station (Water- Cooled Condenser) NewGen Power Kwinana Pty Ltd
698 (Nov. 2005)
6. Marine Environment
The Marine Environment Temperature Elevation Management Plan (amended Sept. 2014) provides information on the monitoring of temperature limits (s.7.1), diffuser performance (s.7.2) and temperature elevations (s.7.3). The management plan is available at:
newgenpowerkwinana.com.au/environment.html 6-7, 6-8, 6-9, 6-10. Marine Environment
Temperature Elevation Management Plan
Plan to address specific measures to monitor:
cooling water effluent temperature;
mixing performance of the diffuser to the edge of the near-field mixing zone;
and
temperature elevation field in Cockburn Sound.
Monitoring plan to be in accordance with the Manual of standard operating procedures 2005 which supports the State Environmental (Cockburn Sound) Policy 2005, and its updates
6.12. Measurement of free chlorine residual concentrations
Measure free chlorine residual concentrations at the discharge and at the edge of the near-field mixing zone under representative range of known plant operating conditions and biocide dosing regimes
Perth Metropolitan Desalination Plant Water Corporation
655 (Jul. 2004) 832 (Jun. 2010)
8. Marine water quality Monitoring to include dissolved oxygen levels of the bottom waters (defined as
≤0.5 m above the seabed) and other parameters related to dissolved oxygen levels
Not applicable
Staged Expansion of Tiwest Pigment Plant Tronox Management Pty Ltd
452 (Jun. 1997)
Environmental Management Commitment
2. Environmental Management The Environmental Management Plan will address monitoring and management of effluent discharge to Cockburn Sound
Not Applicable Environmental Management Commitments
15–17. Wastewater Discharge
Discharge to Cockburn Sound of wastewaters, which permit the maintenance of environmental quality objectives of the receiving waters, outside the mixing zone.
Conduct further investigations to better define extent of enrichment of metals in marine sediments adjacent to outfall and address likely
consequences of increased discharge resulting from proposed expansion.
Report of findings of investigations submitted to Department Environmental Protection by 1 February 1998.
In event monitoring results demonstrate increasing trend with potential to cause unacceptable impact to the marine environment, undertake
appropriate investigations and, if necessary, corrective measures.
Kwinana Ammonia Project
CSBP Limited
648 (Apr. 2004)
Wastewater discharged through the Cape Peron Outlet managed under Ministerial Statement no. 665 Water quality discharge limits managed under a Pt V licence issued under the EPA Act.
CSBP Ltd normally discharges wastewater to the Sepia Depression Ocean Outlet Landline (SDOOL). In emergency situations or unavailability of the SDOOL, CSBP Ltd discharges to Cockburn Sound.
Ammonium Nitrate Production Facility Expansion
CSBP Limited
689
(Sept. 2005)
Ammonium Nitrate Production Expansion Project: Phase 2 CSBP Limited
875 (Oct. 2011)