The Consequences of Bank Loan Growth: Evidence from Asia
Chaiporn Vithessonthi
Sunway University Business School, Sunway University No. 5, Jalan Universiti, Bandar Sunway
47500 Selangoor Darul Ehsan, Malaysia Tel: +60 3 7491 8622 Ext 7104; Fax: +60 3 5635 8633
Email: [email protected] www.chaiporn.com
The Consequences of Bank Loan Growth: Evidence from Asia
ABSTRACT
How much of non-performing loans can be explained by loan growth? If an increase in loan growth leads to higher profitability but does not necessarily cause non-performing loans to increase in the short run, banks with (managerial) short-termism will be ex ante incentivized to grant more loans to increase short-run profitability. Using a sample of publicly listed banks in 18 countries in Asia during the period 1990-2014, I show that in the short run, loan growth has a negative effect on non-performing loans and a positive effect on profitability. As expected, loan growth increases non-performing loans in the long run. Overall, I provide comprehensive empirical evidence for the relationships between loan growth, profitability, and non-performing loans for public banks in Asia.
JEL Classification: F4; G1; G2; G3
Keywords: Asia; financial crisis; loan growth; managerial short-termism; non-performing loans; profitability
1 Introduction
The starting point of this paper is that banks may ex ante attempt to maximize their profits by increasing revenues (through raising the supply of bank loans). However, there is a tradeoff between short- and long-term profitability because, as discussed in the literature (see e.g., Mayordomo et al., 2014), when the bank provides more loans, especially to low credit quality (or opaque) borrowers, it will subsequently experience a higher level of non-
performing loans, which will naturally reduce profits of the bank in following periods. If expanding bank loans results in higher profitability in the short run but does not necessarily lead to larger non-performing loans in the short run, the bank with (managerial) short- termism1 is ex ante incentivized to grant more loans to increase short-term profits at the costs of the bank’s higher loan losses in the long run. This issue is a standard moral hazard problem of banks.2 Two fundamental questions to be addressed in this paper are: (1) whether expanding bank loans leads to larger non-performing loans in the short run and the long run and (2) whether increasing bank loans results in higher profitability in the short run.
Since the global financial crisis of 2007-2009, there is a strong view that many banks engage in higher risk-taking, which causes them not only to be more exposed to economic and financial shocks but also to increase systemic risk in the banking/financial systems that subsequently cause banking and/or financial crises. For example, Farhi and Tirole (2012) note that the global financial crisis of 2007-2009 shows that commercial banks became more sensitive to market conditions and that there is a large maturity mismatch in the financial systems. This view has been debated among policy makers and researchers (see e.g., Acemoglu et al., 2015; Allen et al., 2012; Freixas et al., 2000; Gauthier et al., 2012), leading to various changes in banking/financial regulations around the world. These debates also raise several empirical questions.
To answer the main research questions and empirically test the predictions that the effect of loan growth on non-performing loans is negative in the short run and is positive in the long
1 See, e.g., Bannier et al. (2013) for a discussion of implications of remuneration systems for risk-taking of banks.
2 See, e.g., Morrison and White (2005) and Feess and Hege (2012) for a discussion of how
run, I primarily use two estimation techniques: (1) ordinary least squares (OLS) regressions and (2) two-stage least squares (2SLS) regressions.
I address two major challenges to the estimation of the effect of loan growth on non- performing loans. First, one might be concerned that loan growth and non-performing loans are largely driven by macroeconomic conditions. That is, non-performing loans increases during economic downturns. Likewise, loan growth should be lower during economic downturns. Second, one might be worried that if non-performing loans are persistent, the observed relationship between loan growth and non-performing loans might disappear after controlling for past non-performing loans. To address the first concern, I include a set of macroeconomic variables in the models. In addition, I estimate two-stage least squares (2SLS) regressions that would alleviate the endogeneity concerns. To address the second challenge, I estimate a series of dynamic OLS regressions, which include a lag of non- performing loans as an explanatory variable.
Based on the final sample of 3,059 bank-year observations, involving with 271 publicly listed banks in 18 countries in Asia and Oceania (consisting of 15 developing countries and 3 developed countries) during the period 1990-2014, I obtain three major sets of key findings.
First, the results show that banks with higher loan growth rates tend to have lower ratios of non-performing loans to total loans (NPLTL) in the following year, after controlling for bank-specific characteristics and country-level factors. This result is robust to several robustness checks and is in sharp contrast to the findings of prior studies. For example, Foos et al. (2010) find that loan growth is positively associated with loan loss provisions in a sample of 16 advanced economies during the period 1997-2007. In addition to illustrating that the growth of loans has a negative effect on non-performing loans, I show that this effect is stronger for banks in developing countries than for banks in developed countries. My results provide support to a conjecture of Peek and Rosengren (2005), Caballero et al. (2008)
and Bruche and Llobet (2014), who suggest that banks might be engaging in providing credit supply to insolvent borrowers in order to delay or avoid the realization of loan losses. A competing explanation is that by providing new loans to borrowers, banks practically increase the size of loan portfolio. In general, the new loans do not quickly become bad loans; therefore, when holding the amount of non-performing loans constant, an increase in total loans immediately leads to a fall in NPLTL. However, I empirically rule out this explanation by finding that the results remain qualitatively unchanged when I replace NPLTL with the ratio of non-performing loans to a one-year lag of total loans (NPLTL1). Another plausible explanation is that banks have improved their risk management and increased lending standards over time, leading to a larger share of high quality loans and a reduction in non-performing loans. This explanation is supported by recent studies such as Ağca et al.
(2013) and Lee and Hsieh (2014), showing that financial reforms in the aftermath of financial crises improve banks’ lending standards.
Second, the results indicate that loan growth has a positive effect on non-performing loans in the long run; however, this positive relationship is not robust. Generally speaking, this finding is consistent with the traditional view in the literature that as banks increase the size of their loan portfolio, they provide new loans to lower quality borrowers. The low quality loans become non-performing loans in subsequent years. The finding that loan growth does not increase non-performing loans in the short run but has the positive effect on non- performing loans in the long run provides strong evidence to a current debate on new regulations on compensation (see e.g., Chaigneau, 2013; Hakenes and Schnabel, 2014; John et al., 2010; Murphy, 2013). For example, it has been argued that compensation schemes (e.g., deferred compensation) should incorporate long-term performance so as to mitigate the moral hazard problem in risk-taking and lending decisions (see e.g., Cole et al., 2015).
Third, the results indicate that banks with higher loan growth rate tend to have higher profitability, measured as the return on asset (ROA), after accounting for bank-specific characteristics and country-level factors. In addition, the effect of loan growth on profitability is non-linear; that is, it has an inverted U-shaped relationship. My findings are in line with prior studies (see e.g., Onali, 2014) that document a positive association between bank risk- taking and dividends. When banks expect the government or the central bank to bail them out when a banking or financial crisis occurs (due to e.g., a too-many-too-fail effect and/or a too- big-too-fail effect), banks might be more willing to have an (excessive) appetite for risk- taking. For instance, Farhi and Tirole (2012) argue that leverage choices (e.g., of banks) are dependent on central banks’ expected policy response to the overall maturity mismatch in the financial systems (e.g., financial institutions). Dam and Koetter (2012) find that in the context of Germany, an increase in bailout expectations of banks increases the probability of distress, suggesting that levels of risk taking by banks are dependent on safety nets in the banking system. In addition, Brown and Dinç (2011) find evidence for a too-many-too-fail effect (e.g., when the banking system is weak) in a sample of 21 emerging market countries in the 1990s. Based on a sample of Euro-area and the U.S. bank lending standards, Maddaloni and Peydró (2011) show that when short-term interest rates are low, lending standards for both household and corporate loans are also softened.
The reminder of this paper is organized as follows. I briefly discuss closely related studies in Section 2. In Section 3, I describe my data and summary statistics. In Section 4, I present empirical results for the short-run effect of loan growth on non-performing loans. In Section 5, I present empirical results for the long-run effect of loan growth on non- performing loans. Section 6 presents empirical results for the impact of loan growth on profitability. I conclude the paper in Section 7.
2 Related literature and hypothesis development
In this section, I first provide a brief overview of related literature on the relationships between loan growth, profitability and non-performing loans. I then discuss the intuition for two testable hypotheses.
2.1 Related literature
There is a growing body of the banking literature on the determinants of non-performing loans (see e.g., Chang et al., 2008; Lepetit et al., 2012; Louzis et al., 2012; Vithessonthi, 2016). Variation in non-performing loans can be explained by both bank-level and macro- level factors. Scholars such as Acharya and Naqvi (2012) and Bruche and Llobet (2014) argue that key internal factors that affect non-performing loans are lending standards and risk management processes of banks. Loans that are ex ante provided to high-risk borrowers (as a result of higher-risk taking of banks) are more likely to become problem loans and eventually non-performing loans3. Economic conditions (e.g., economic shocks) exacerbate the rate (as well as the speed) at which high-risk loans become non-performing loans. For instance, Pesola (2011) examines the impact of financial fragility and macroeconomic shocks on loan losses of banks in Europe at the aggregate level and shows that the indicator for indebtedness (the ratio of total outstanding lending of banks to GDP) has a positive effect on loan losses (the ratio of loan losses to lending). Furthermore, the recognition of non-performing loans also depends on the existence of loan evergreening or so-called zombie lending (see e.g., Bruche and Llobet, 2014; Caballero et al., 2008).
3 Please see, e.g., Maddaloni and Peydró (2011), Farhi and Tirole (2012), Acharya and Naqvi
The literature on bank profitability/efficiency (see e.g., Bolt et al., 2012; Bolt and Humphrey, 2010; Foos et al., 2010) has been growing over the past decades. The bank’s risk- taking has been identified as one of key factors influencing profitability. For example, Onali (2014) shows that the degree of bank risk-taking is positively associated with dividend payouts. Foos et al. (2010) find that abnormal loan growth has a negative effect on the change in relative interest income, suggesting that banks attempt to grow by providing more loans to borrowers with lower credit ratings. Bolt et al. (2012) find that long-term interest rates increase bank profitability (measured as the ratio of net interest income to total loans).
2.2 Hypothesis development
Suppose that a borrower has one of two distinct credit worthiness ratings: (1) a low rating, which implies high credit risk, and (2) a high rating, which indicates low credit risk.
Borrowers with low ratings have to pay higher interest rates on loans than those with high ratings, all else being equal. Firms with low ratings tend to default on loans more often (or have a higher default probability) than firms with high ratings. When firms fail to service their debt obligations, there is an increase in non-performing loans on the bank’s balance sheet. Non-performing loans and subsequent write-offs have downward pressures on the bank’s profitability and charter value.
The bank can choose to provide new loans to firms with low ratings or those with high ratings. Banks that emphasize more on short-term profitability objectives are more likely inclined to allocate more new loans to firms with low ratings in their loan portfolio so as to generate higher profits in the short run. Banks that are more risk-averse are more likely to allocate a larger weight to providing loans firms with high ratings in their loan portfolio, thereby having lower profits in the short run. Thus, a composition of loans plays an important
role in the bank’s non-performing loans. Several studies (e.g., Acharya and Naqvi, 2012;
Demirgüç-Kunt and Huizinga, 2010; Festić et al., 2011; Maddaloni and Peydró, 2011) have focused on the role of loan growth as a profit-driving strategy and its consequences.
For simplicity, suppose that any loan can be classified into two groups based on the default probability: a high quality loan with a low default probability or a low quality loan with a high default probability. Consider, for the moment, the high quality loan, which typically has a lower default probability and takes a longer time to become a non-performing loan than the low quality loan. Suppose that the average time for the low quality loan to default is two years and the average time for the high quality loan to default is longer than two years. Having a larger share of low-quality loans shortens the time to default, but the average time to default would still be longer than two years. As a consequence, there should be a negative association between loan growth and non-performing loan in the short run (i.e., within one year). That is, an increase in the size of the loan portfolio reduces the NPL ratio (e.g., NPLTL). When the proportion of the new low quality loans increases, loan growth should have a positive effect on non-performing loans in the long run.
If the bank increases its profitability in the short run by increasing loan growth with higher weights on new loans to low quality borrowers and by not experiencing larger non- performing loans in the short run (as discussed above), the bank will naturally increase the supply of loans. This issue will be more evident in banks with (managerial) short-termism.
That is, a non-positive contemporaneous relationship between loan growth and non- performing loans will encourage banks with short-termism to grant more loans.
During periods of credit booms, the bank may provide new loans to existing or new borrowers to finance riskier projects. Loans associated with high-risk investments have a higher probability of becoming non-performing loans than those used to finance low-risk investments. Hence, under these circumstances, loan growth will subsequently lead to non-
performing loans in the long run. Foos et al. (2010) provide evidence for the positive effect of loan growth on future loan losses in a sample of banks in 16 major countries during the period 1997-2007. Likewise, Vithessonthi (2016) shows that prior to the global financial crisis of 2007, loan growth is positively associated with non-performing loans of banks in Japan. Ellul and Yerramilli (2013) argue that other factors such as bank-specific risk management activities might mitigate the positive effect of loan growth on non-performing loans. Peek and Rosengren (2005), Caballero et al. (2008) and Bruche and Llobet (2014) suggest that banks may keep providing loans to insolvent borrowers in order to delay or avoid the realization of loan losses.
Based on the above discussion, I propose the following testable hypotheses.
Hypothesis 1: Ceteris paribus, loan growth has a negative impact on non-performing loans in the short run.
Hypothesis 2: Ceteris paribus, loan growth has a positive impact on non-performing loans in the long run.
Hypothesis 3: Ceteris paribus, loan growth has a positive impact on profitability in the short run.
3 Data, sample selection and descriptive statistics
To examine whether bank loan growth affects profitability and non-performing loans and whether the effects are time varying, I first construct my sample by obtaining a list of all publicly listed commercial banks in all countries in Asia (including Australia and New Zealand) during the sample period spanning from 1990 to 2014 from Thompson Reuters Datastream. I exclude banks that were not listed by the end of 2010 from the sample in order
to have at least a minimum of four annual observations for each bank in the sample for subsequent regression analyses.
I retrieve annual bank- and country-level data over the sample period from Thomson Reuters Datastream and Worldscope. Based on the selection procedure discussed above, I have an initial sample of 366 commercial banks that are publicly listed in 21 countries in Asia. After excluding observations for which data on key variables, which will be discussed below4, were missing or not reported, I have the final sample of 3,059 bank-year observations, involving with 271 banks in 18 countries (Australia, China, Hong Kong, India, Indonesia, Japan, Malaysia, Oman, Pakistan, Philippines, Qatar, Saudi Arabia, Singapore, South Korea, Sri Lanka, Taiwan, Thailand, United Arab Emirates), for the main regression analyses. The number of banks for each country in my sample is largely similar to that of Beltratti and Stulz (2012).5
Following Chang et al. (2008), Banker et al. (2010), Festić et al. (2011), and Mayordomo et al. (2014), I measure the non-performing loans ratio (NPLTL) as the ratio of non- performing loans to total loans. Following scholars such as Flannery and Giacomini (2015)
4 A key challenge is to have an appropriate tradeoff between having a comprehensive specification that includes an extensive list of control variables but leads to a small sample size and having a parsimonious specification that leads to a larger sample size. Due to different banking regulations across countries, data on several variables are not available for banks in all countries. A case in point is that for banks in Vietnam in the sample, values of non-performing loans are missing/unreported in the database but values of reserves for loan losses are available, resulting in the removal of all banks in Vietnam from the sample when bad loans are measured as non-performing loans. If reserves for loan losses, rather than non- performing loans, are used as a measure of bad loans (see e.g., Bikker and Metzemakers, 2005), banks in Vietnam will be included in the sample but several banks in other countries with missing values of reserves for loan losses will be excluded from the sample.
5 Beltratti and Stulz (2012) examine stock returns of large banks during the global financial
and Vithessonthi (2016), I use the ratio of non-performing loans to total assets (NPLTA) as an alternative measure of non-performing loans.
The bank’s loan growth (LOANGROWTH) is computed as the first difference in the natural logarithm of a bank’s total loans. To check the robustness of my findings, I use the bank’s excess loan growth rate (LG) as an alternative proxy for loan growth.
To control for other bank-specific factors that might determine levels of non-performing loans, I include a large set of bank-level control variables. Bank size (LNTA) is measured as the natural logarithm of total assets in millions USD. The loan-to-asset ratio (LOANTA) is measured as the ratio of total loans to total assets. The capitalization ratio (CAPTA) is measured as the ratio of total capital to total assets. The revenue diversification ratio (BRD) is computed as the ratio of non-interest income to net revenue. The cash-to-deposit ratio (CASHDEP), which is computed as the ratio of cash to total deposit, is used as a measure of liquidity against a run on banks. Banks with a high degree of liquidity will be more likely to withstand systemic shocks to the banking system. To measure a bank’s profitability, I use return on assets (ROA), which is computed as the ratio of earnings before interest and taxes (EBIT) to total assets. Operating risk (SDROA), which is measured as the three-year moving standard deviation of ROA, captures a bank’s (unobservable) ex ante risk-taking appetite.
Banks that provide loans to riskier borrowers (or low credit-quality borrowers) are more likely to have larger variation in profitability than those that provide loans to high credit- quality borrowers. Stock price performance, which is measured as the first difference in the natural logarithm of stock prices, is a market-based measure of bank performance.
To control for country-level factors that affect non-performing loans of banks, I include three country-level variables: (1) GDP growth (ΔGDP), which is computed as the first difference in the natural logarithm of real GDP in US dollar, (2) the inflation rate (INFLATION), which is the percentage year-on-year change in average consumer prices, and
(3) the investment rate (INVESTMENT), which is the share of investment as a percentage of GDP. All three variables measure different aspects of economic conditions of a country.
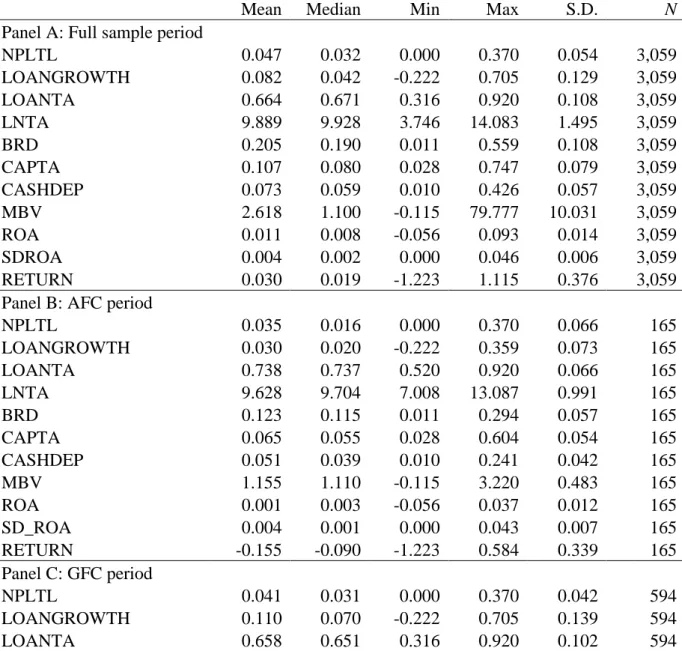
[Insert Table 1 about here]
Table 1 presents summary statistics for a number of bank-specific variables used in the final sample of this study after winsorizing all variables at the 1% and 99% percentiles in order to minimize the effects of outliers and eliminate any data recording errors. Panel A of Table 1 reports summary statistics for the full sample period. The mean value of the ratio of non-performing loans to total loans (NPLTL) is 4.7%, which is slightly smaller than the mean value of NPLTA of 6.7% for a sample of 224 banks in Europe over the period 1994-2005 reported by Lepetit et al. (2012). The mean value of loan growth (LOANGROWTH) is 13.4%, while the mean value of the loan-to-assets ratio (LOANTA) is 64.8%, which is larger than the mean value of LOANTA of 61.8% for the European banks reported by Lepetit et al.
(2012). There is a significant difference in non-performing loans of banks in developing countries and banks in developed countries; that is, the mean value of NPLTL for the developing countries sample is 5.7% while the mean value of NPLTL for the developed countries sample is 3.7%. The difference in the mean value of NPLTL is statistically significant (p-value < 0.001). In addition, the mean value of LOANGROWTH for the developing countries sample is 14.5% while the mean value of LOANGROWTH for the developed countries sample is 2.3%; the difference in the mean value of LOANGROWTH is statistically significant (p-value < 0.001).
Panels B and C of Table 1 present summary statistics for the Asian financial crisis (AFC) period (i.e., 1997-1998) and the global financial crisis (GFC) period (i.e., 2007-2009), respectively. The mean value of NPLTL for the AFC period and the GFC period is 3.5% and
4.1% respectively. The mean value of LOANGROWTH for the AFC period and the GFC period is 3.0% and 11.0%, respectively. One likely explanation for the higher loan growth rate during the GFC period relative to the AFC period is that during the GFC period firms draw down on credit lines committed by banks, forcing banks to involuntarily increasing their lending. This view is supported by the finding of Campello et al. (2012) who show that small and financially constrained firms in Europe used more funds from credit lines during the global financial crisis than large and less-financially-constrained firms.
Panel D of Table 1 presents summary statistics for the non-crisis period (i.e., 1992-1996, 1999-2006, and 2010-2014). The mean value of NPLTL for the non-crisis period is 4.9%, which is roughly similar to the mean value of NPLTL for the full sample period. However, compared with the full sample period, the mean value of LOANGROWTH for the non-crisis period is smaller (7.9% vs. 13.4%). As expected, stock price performance of banks is poor during the crisis periods, relative to the non-crisis period. That is, the mean value of stock returns (RETURN) is -15.5% and -7.9% for the AFC period and the GFC period, respectively, whereas the mean value of RETURN is 7.2% during the non-crisis period.
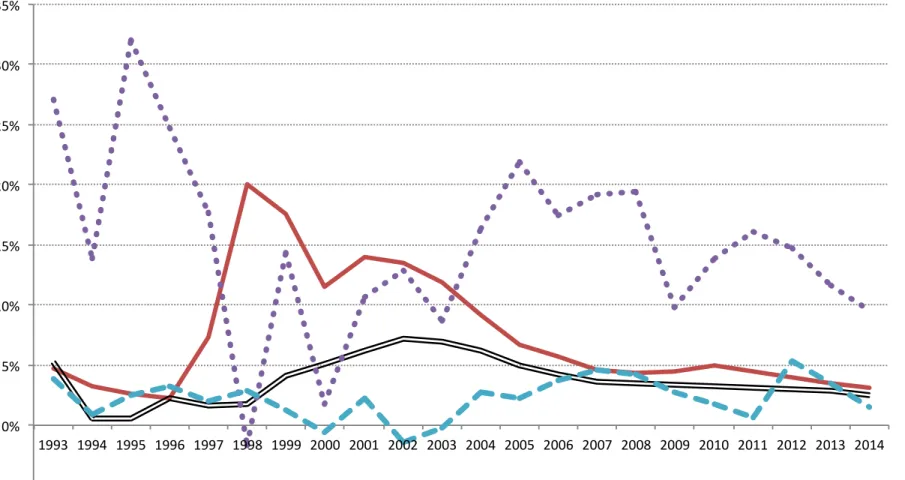
To understand variation in loan growth and non-performing loans of Asian banks in the sample over time, I plot the time-series of the mean value of loan growth (LOANGROWTH) and the ratio of non-performing loans to total loans (NPLTL) for the developing countries sample (DEV = 0) and the developed countries sample (DEV = 1) over the period 1993-2014 in Figure 1. The figure clearly shows that non-performing loans for banks in developing countries are much larger than those for banks in developed countries. The non-performing loans for the developing countries increase substantially during the Asian financial crisis and remain high until 2005. Loan growth is higher for the developing countries than for the developed countries throughout the sample period. One plausible interpretation of this figure is that given the substantially higher loan growth rate for the developing countries than for
the developed countries, the non-performing loans for banks in the developing countries are higher than those in the developed countries but are lower than expected. There are at least two possible explanations for this pattern of the time-series. First, banks in developed countries have had better risk management activities than banks in developing countries.
Second, the existence of zombie lending is more prevalent among banks in developing countries than banks in developed countries.
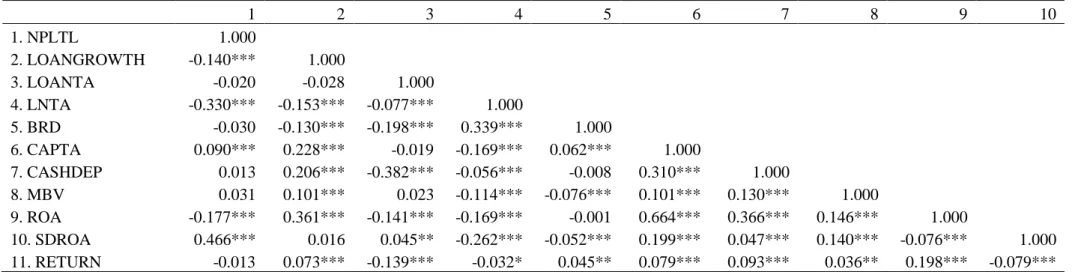
[Insert Table 2 about here]
[Insert Figure 1 about here]
[Insert Figure 1 about here]
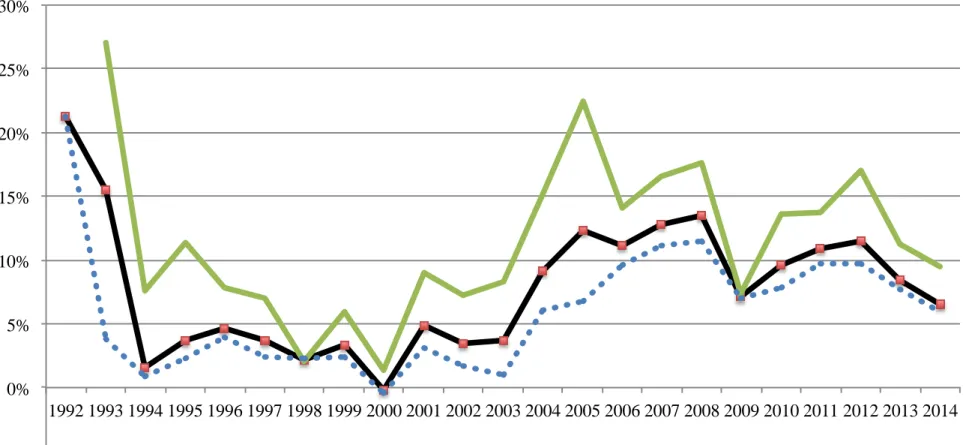
I plot the time-series of the mean value of loan growth (LOANGROWTH) for large and small banks during the period 1992-2014 in Figure 2. I classify a bank-year observation with total assets larger than 10,000 million USD as a large bank. As can be seen, small banks generally have a higher growth rate than large banks. I find that the pattern of loan growth is qualitatively unchanged when I use 1,000 million USD as a threshold for classifying a large bank. Overall, there is evidence to indicate that in the context of Asia, a small bank tends to have a higher loan growth rate than a large bank. If the small bank has a higher share of loans provided to opaque (or low quality) borrowers than the large bank, the small bank will more likely have a higher NPL ratio.
Table 2 reports correlation coefficients of key bank-level variable in the final sample of 3,059 bank-year observations. NPLTL is negatively correlated with LOANGROWTH, LNTA, ROA, DEPTA, and BRD and is positively correlated with MBV, CAPTA, and SDROA. At this point, it is important to note that NPLTL is not correlated with LOANTA, implies that variation in non-performing loans is not associated with the level of total loans.
The positive and significant correlation between LOANGROWTH and ROA is consistent with Becker and Ivashina (2014), who find that a bank’s profitability tends to drive the supply of its loans.
4 The short-run impact of loan growth on non-performing loans
4.1 Empirical framework
In this section, I primarily test whether a bank’s loan growth increases non-performing loans in the short run and whether financial crises affect this relationship. My empirical model of non-performing loans is largely consistent with those used in the empirical banking literature (e.g., Chang et al., 2008; Louzis et al., 2012). A key issue in empirical strategy is that we cannot directly observe the demand and supply of bank credit. I attempt to address this issue in the robustness check by using loan growth that is not driven by macro-economic conditions (e.g., a country’s GDP growth, inflation, investment); that is, I use the macro-level variables as a rough proxy for the demand for bank credit.
4.1.1 Panel OLS regressions
To assess the impact of a bank’s loan growth on non-performing loans, I estimate a series of panel OLS regressions of non-performing loans on loan growth and a set of bank- specific and country-level variables. I include (1) bank fixed effects to control for omitted time-invariant bank characteristics, (2) year fixed effects to control for any unobserved time- variant global (business cycle) influence that affects all banks in the sample, (3) country fixed effects to control for omitted time-invariant country characteristics, and/or (4) country-year interactions to control for the differential impact of unobserved time-variant macroeconomic
factors by country. I attempt to deal with the potential endogeneity and reverse-causality problems (e.g., causal effects running from non-performing loans to independent variables) by lagging all right-hand side variables by one period. My benchmark panel OLS regression is as follow.
yi,j,t =a+b1LOANGROWTHi,j,t-1+gBi,j,t-1+lCj,t+hi+ut+ei,j,t, (1)
where the indices i, j, and t correspond to bank, country, and year, respectively. The outcome variable yi,j,t is a measure of non-performing loans such as the ratio of non-performing loans to total loans (NPLTL). LOANGROWTHi,j,t-1 is the first difference in the natural logarithm of total loans for bank i in country j at time t-1; Bi,j,t-1 is a vector of bank-specific characteristics for bank i in country j at time t-1; Cj,t-1 is a vector of country-level control variables for country j at time t-1; ηi represents the bank fixed effect; νt represents the year fixed effect, and i,j,t is the zero-mean disturbance term. Standard errors that are adjusted for heteroskedasticity and serial correlation are clustered at the bank level.
If an increase in a bank’s loan growth at time t-1 results in an increase in its non- performing loans at time t, the estimated coefficient on LOANGROWTH in Equation (1) should be positive and statistically significant. Of course, an insignificant estimated coefficient on LOANGROWTH cannot rule out the impact of loan growth on non- performing loans; however, it will suggest that loan growth has no direct short-run effect on non-performing loans.
To examine whether financial crises (i.e., the Asian financial crisis (AFC) of 1996-1997 and global financial crisis (GFC) of 2007-2009) moderate the relationship between loan growth and non-performing loans, I add the interaction term between LOANGROWTH and financial crisis dummies (i.e., AFC and GFC) in the specification as follows:
yi,j,t=a+b1LOANGROWTHi,j,t-1+bAFCAFCi,j,t-1+bGFCGFCi,j,t-1
+gBi,j,t-1+lCj,t+hi+ei,j,t, (2)
yi,j,t=a+b1LOANGROWTHi,j,t-1+b2LOANGROWTHi,i,t-1AFCi,t-1
+b3LOANGROWTHi,i,t-1GFCi,t-1+bAFCAFCi,j,t-1+bGFCGFCi,j,t-1 +gBi,j,t-1+lCj,t+hi+ei,j,t,
(3)
where AFCi,t is the Asian financial crisis dummy variable, which takes a value of one during 1997-1998 and zero otherwise. GFCi,t is the global financial crisis dummy variable, which takes a value of one during 2007-2009, and zero otherwise.
The statistically significant estimated coefficients AFC and GFC in Equation (2) would indicate the direct effect of the Asian financial crisis and the global financial crisis, respectively, on the non-performing loans. I expect the estimated coefficients AFC and GFC
in Equation (2) to be positive and statistically significant, which will suggest an increase in the level of non-performing loans during the financial crisis period, relative to the non-crisis period. It should be noted that when the AFC dummy variable and the GFC dummy variable are included in Equation (2), the year fixed effects have to be removed from the specification.
If the financial crises alter the relation between loan growth and non-performing loans (thereby providing evidence for the time-varying effect of loan growth on non-performing loans), the coefficients on the interaction terms in Equation (3) should be statistically significant. When the estimated coefficient on LOANGROWTH is positive, a positive coefficient on the interaction term implies that the financial crises strengthen the positive effect of loan growth on non-performing loans, whereas a negative efficient on the interaction term implies that the financial crises weaken the positive effect of loan growth on non-
performing loans. I first estimate Equation (3) without year fixed effects and subsequently estimate the modified specification of Equation (3) by dropping the direct effects of financial crises dummy variables and including year fixed effects.
4.1.2 Two-stage least square regressions
Skeptical readers may still be concerned with the endogeneity problem and the contemporaneous relationship between the measure of loan growth and other bank-specific characteristics. To address this issue, I apply the two-step regression (2SLS) methodology used by finance scholars such as GarcÍa (2013), Gopalan et al. (2014) and Lemmon et al.
(2014). In the first stage, I estimate the OLS regression of loan growth (LOANGROWTH) on a set of contemporaneous bank-level and country-level variables as follows.
LOANGROWTHi,j,t =a+gBi,j,t+lCj,t+hi+ut+ei,j,t. (4)
I use the residual obtained from the OLS estimation of Equation (4), which is orthogonal to all explanatory variables (including bank fixed effects and year fixed effects), as the instrument for loan growth in the second-stage regression estimation. Hence, in effect, I strip loan growth of any contemporaneous relationship with key bank-specific factors, country- level factors, bank fixed effects, and year fixed effects. The country-level variables (GDP growth, inflation, and investment) are included as a rough measure for the demand side of bank loans.
Using the orthogonalized loan growth measure (i.e., residuals obtained from the OLS estimation of Equation (4)) as a proxy for the excess (unexplained) loan growth rate (LG) for each bank-year in the second-stage least squares regressions, I estimate the main regressions of non-performing loans.
4.2 Empirical results
4.2.1 The short-run impact of loan growth on non-performing loans
Table 3 presents the results of OLS estimation of Equation (1). In column (1) of Table 3, I estimate the baseline OLS regression including only control variables, bank fixed effects, and year fixed effects over the full sample period.6 The dependent variable is NPLTL, which is the ratio of non-performing loans to total loans. I regress NPLTL on the contemporaneous country-level variables and one-year lagged bank-level explanatory variables.
The results in column (1) show that the coefficients on all three country-level variables are statistically significant at the 5% level or better, indicating that the inflation rate is positively associated with non-performing loans and that GDP growth and the investment rate are negatively associated with non-performing loans. The finding of the negative effect of GDP growth is consistent with that of Jiménez et al. (2013) and of Louzis et al. (2012). I find that the market-to-book ratio (MBV), which measures a bank’s growth opportunities, and operating risk (SDROA), which measures a bank’s volatility in profitability, are positively associated with non-performing loans. Revenue diversification (BRD), profitability (ROA), and stock price performance (RETURN) have a negative impact on non-performing loans. Interestingly, the coefficient on the loan-to-asset ratio (LOANTA) is statistically significant at only the 10% level, suggesting that the level of loans has no direct effect on the level of non-performing loans. In addition, the coefficient on CAPTA is statistically insignificant, suggesting that banks with lower capitalization do not have higher levels of non-performing loans. This finding is in line with Louzis et al. (2012).
To test the direct effect of loan growth on non-performing loans, I add LOANGROWTH in column (2) and find that the coefficient on LOANGROWTH is negative and statistically
significant at the 1% level, suggesting the negative impact of loan growth on non-performing loans is counterintuitive and providing empirical support to Hypothesis 1. This finding is inconsistent with prior studies such as Foos et al. (2010), who find that abnormal loan growth has a positive effect on loan losses. The magnitude of the coefficients in column (2) is largely similar to that of column (1), suggesting the stability of the estimation. The coefficient on LOANTA is positive and statistically significant at the 1% level. This result is consistent with the literature (see e.g., Foos et al., 2010). In terms of the economic significance of loan growth, given the estimated coefficient on loan growth is -0.046 (see column (2)), a one- standard deviation (0.129) increase of loan growth (LOANGROWTH) will lead to about a 12.6% (= 0.046 × 0.129/0.087) decrease in non-performing loans (NPLTL) at the mean.
To examine whether the finding is robust to controlling for unobservable time-invariant country effects, I replace bank fixed effects with country fixed effects in column (3). The basic finding that loan growth has a negative effect on non-performing loans remains evident in column (3). I further test the robustness of my findings by replacing country fixed effects with interactions between country dummies and YEAR, which is a time trend variable, in column (4). The results in column (4) still indicate that loan growth has a negative effect on non-performing loans, after controlling for a large set of the bank-specific factors, the country-level variables, and the country-year interactions.
I initially interpret the finding of the negative effect of loan growth on non-performing loans as empirical evidence for the existence of loan evergreening or zombie lending. Banks have incentives to keep providing credit to impaired/insolvent borrowers to avoid the realization of loan losses under some circumstances (see e.g., Bruche and Llobet, 2014;
Caballero et al., 2008; Peek and Rosengren, 2005). In doing so, an increase in loans on banks’ balance sheet is not associated with an increase in non-performing loans. If this practice is prevalent across banks, the relationship between loan growth and non-performing
loans might even become negative. Holding the amount of non-performing loans constant (e.g., as a result of loan evergreening), an increase in total loans leads to a smaller value of the ratio of non-performing loans to total loans (NPLTL). Nevertheless, Figure 1 appears to suggest that although banks might engage in zombie lending in general, they (at least those in developing countries) were unable to avoid the recognition of problem loans during the Asian financial crisis. To empirically test for this explanation, I replace NPLTL with the ratio of non-performing loans to a one-year lag of total loans (NPLTL1). I find that the mean NPLTL1 is only slightly higher than that of NPLTL (0.050 versus 0.047) and that the pattern of the results is qualitatively unchanged, suggesting that this explanation does not fully explain the negative impact of loan growth on non-performing loans.
[Insert Table 3 about here]
[Insert Table 4 about here]
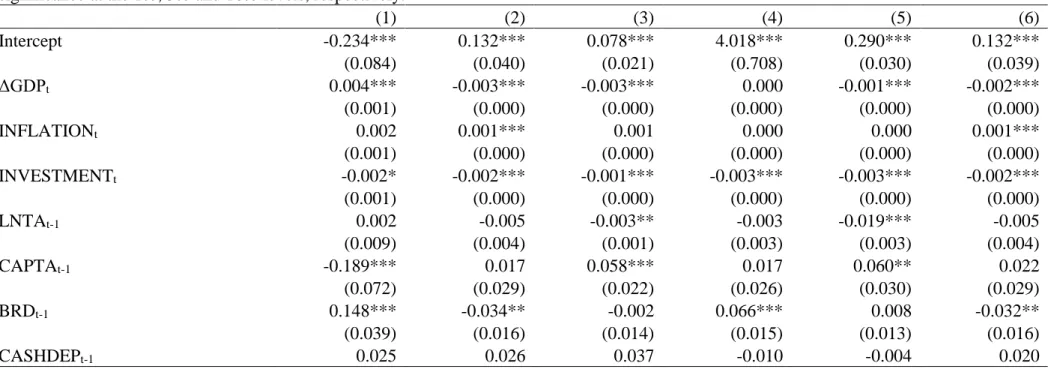
Table 4 presents the results of the 2SLS regression. In column 1, the results of the first- stage regression where LOANGROWTH is the dependent variable indicate that GDP growth (ΔGDP)7, the loan-to-assets ratio (LOANTA), profitability (ROA), and revenue diversification (BRD) are positively associated with loan growth (LOANGROWTH), while the capital-to-asset ratio (CAPTA) is negatively associated with LOANGROWTH. Some of the results are consistent with prior studies. For example, Olivero et al. (2011) document that GDP growth has a positive effect on loan growth for a sample of banks in Asia and Latin America during the period 1996-2006. The adjusted R2 of the first-stage regression is 41.6%,
7 The positive relationship between GDP growth and loan growth is consistent with the literature, which suggests that banks’ behaviors (e.g., lending standards) are influenced by
providing a reasonable level of confidence for the predictive power of the model. I refer to the unexplained variation in LOANGROWATH, that is the first-stage regression residual, LG.
Using the orthogonalized loan growth measure (i.e., the residuals obtained from the OLS estimation of Equation (4)) as a proxy for the excess (unexplained) loan growth rate (LG) for each bank-year in the second-stage least squares regressions, I estimate the second-stage OLS regressions. The second-stage OLS regression results are reported in columns (2) - (6). The independent variable of interest is LG. I find that the pattern of the results remains largely unchanged. Precisely, the coefficient on LG is negative and statistically significant at the 1%
level in all models. These results provide support to Hypothesis 1.
To test the direct impact of financial crises on non-performing loans, I replace year fixed effects with the one-period lagged AFC dummy variable and the one-period lagged GFC dummy variable in column (4). While the coefficient on AFC is not statistically significant, the coefficient on GFC is negative and statistically significant, suggesting that the Asian financial crisis seems to have no direct effect on non-performing loans of banks in Asia but the global financial crisis exerts a direct effect on non-performing loans of the banks in Asia.8 One plausible for this explanation is that only a limited number of countries in Asia (e.g., Malaysia, Thailand, Indonesia, South Korea) had directly suffered from the Asian financial crisis, whereas the effects of the global financial crisis were broader in scope. In a related study, Chen and Kao (2011) show that a financial reforms in Taiwan, which was introduced in 2001, substantially reduced the level of non-performing loans of banks in Taiwan.
In columns (5) and (6), I interact LOANGROWTH with each of the financial crisis dummies variables. The key difference between column (5) and column (6) is that AFC and
8 Using the contemporaneous value of AFC and GFC instead of using the one-year lag of
GFC are included in column (5) to control for the direct impact of financial crises, while I replace both financial crisis variables with year fixed effects in column (6). Overall, the results in both columns (5) and (6) indicate that both financial crises weaken the negative effect of loan growth on the non-performing loans since the coefficients on the interaction terms are positive and statistically significant.
In summary, the results of the OLS regression and 2SLS regressions in Tables 3 and 4, respectively, suggest that loan growth has a negative short-run effect on non-performing loans after controlling for a large set of bank-specific and country-specific factors, which is surprising. This negative effect was weakened during the Asian financial crisis as well as the global financial crisis.
4.2.2 The short-run impact of loan growth on non-performing loans: Developing and developed countries
Since my sample includes banks based in developing and developed countries, it is possible that banks in developed counties behave differently to banks in developing countries due to, for example, different banking regulations. In addition, the main results might be driven by banks in the developing countries. Therefore, I examine whether the basic finding that the bank growth rate has a negative effect on non-performing loans by (1) estimating the model that includes the interaction between LOANGROWTH and a developed country dummy variable (DEV), taking a one of one for a bank in a developed country (i.e., Australia, Japan, and Singapore) and zero otherwise, and (2) estimating the main specifications separately for two subsamples: the developed countries sample the developing countries sample.
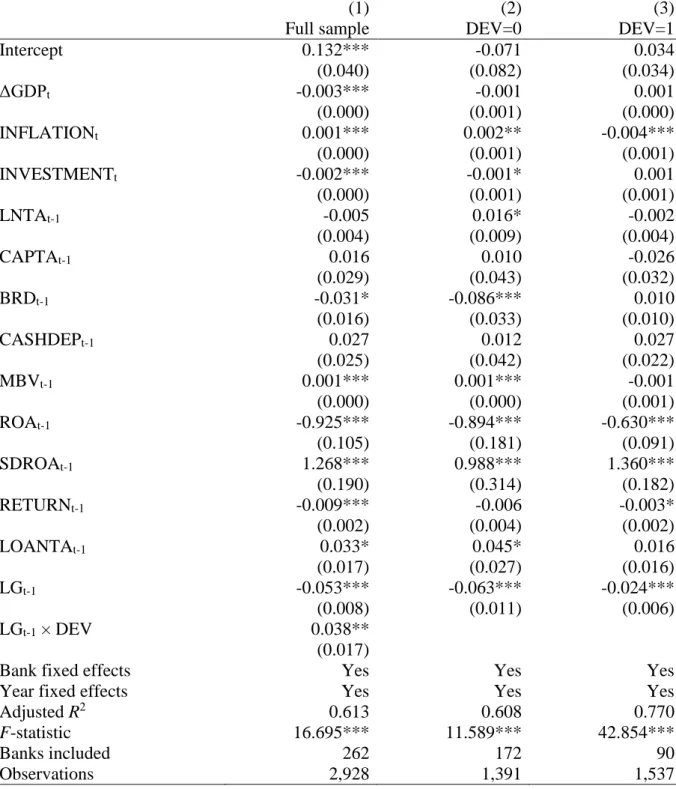
I report the 2SLS regression results in Table 5. The coefficient on the interaction between LOANGROWTH and DEV in column (1) is positive and statistically significant at
the 1% level, implying that the negative effect of loan growth on non-performing loans is weaker for banks in developed countries than those in developing countries. As can be seen in columns (2) and (3), while the coefficient on LOANGROWTH is negative and statistically significant at the 1% levels in both subsamples, the size of coefficient on LOANGROWTH for the developing countries sample is almost three times larger than the size of the coefficient on LOANGROWTH for the developed countries sample.
[Insert Table 5 about here]
Overall, the results in Table 5 suggest that there is a negative relationship between loan growth and non-performing loans for banks in both developing and developed countries.
Compared to banks in developed countries, this negative effect is stronger for banks in developing countries. If banks engage in loan evergreening and developing countries have weaker banking regulations/supervision than developed countries, the finding that the negative effect of loan growth on non-performing loans is stronger for banks in developing countries than for banks in developed countries is consistent with the interpretation that the prevalence of loan evergreening is more substantial in developing countries than in developed countries. This interpretation is based on the fact that prior studies (see e.g., Caballero et al., 2008) show the existence of loan evergreening in Japan in the 1990s.
4.2.3 Robustness tests
I have conducted a number of additional robustness checks for the short-run effect of loan growth on non-performing loans. In this subsection, I highlight some of the robustness checks. First, in the main OLS and the 2SLS regression analyses, I use the ratio of non- performing loans to total loans (NPLTL) as a measure of non-performing loans in the
estimates for the relationship between loan growth and the non-performing loans. I examine whether the basic findings are robust to an alternative measure of the non-performing loans.
Instead of scaling non-performing loans by total loans, I use total assets to scale non- performing loans. That is, the ratio of non-performing loans to total assets (NPLTA) is used as a proxy for problem loans. I estimate my main specifications in Table 3 again using NPLTA as the dependent variable. In untabulated results, I find that the coefficient on LOANGROWTH remains negative and statistically significant as before. While the coefficient on the interaction term between LOANGROWTH and GFC is still positive and statistically significant, the coefficient on the interaction term between LOANGROWTH and AFC is positive and statistically insignificant.
Second, I test whether the results are driven by global economic and credit conditions. I use US corporate bond credit spreads, computed as the difference Moody’s seasoned BAA- rated US corporate bond yield and Moody’s seasoned AAA-rated US corporate bond yield, as instruments for global credit conditions. Since low corporate bond credit spreads indicate strong credit conditions (e.g., credit markets are not under stress), the supply of credit in international markets is likely to be relatively abundant (assuming the relatively high degree of synchronization of business cycles across countries). Tight US credit markets (e.g., a supply shock to the US credit markets) typically coincide with tight credit markets in other countries where controls on capital flows are minimal. I also use US term spreads, computed as the difference between the 10-year treasury constant maturity rate and the 1-year treasury constant maturity rate to proxy for the expected global economic prospect. To conserve space, I do not tabulate the results. I find that the negative effect of loan growth on non- performing loans is robust to controlling for US corporate bond credit spreads and US term spreads.
Last but least, I test whether the negative and significant effect of loan growth on non- performing loans for the full sample period holds for different sub-periods. Thus far, I use year fixed effects to control for time-variant omitted global-level factors that affect all banks in the sample and bank fixed effects to control for time-invariant omitted bank-level factors.
In some specifications, I use country fixed effects to control for time-variant omitted country- level factors. These approaches may not be adequate to control for potential structural shifts at the control level that occur at a certain point in time over the sample period. After the Asian financial crisis, there were major banking/financial reforms in crisis-hit countries such as Thailand and South Korea. Likewise, several countries introduce changes in banking/financial regulations in the aftermath of the global financial crisis of 2007-09.
Hence, there could be sudden changes in unobservable omitted time-invariant bank-level and country-level factors. To address this issue, I divide the full sample period into three sub- periods: the pre-2000 period; the 2000-2010 period, and the 2011-2014 period. I estimate the main specification (i.e. column (2) of Table 3) for each of the three sub-periods. The untabulated results show that the effect of the loan growth on non-performing loans is negative and statistically insignificant for the pre-2000 period, is negative and statistically significant at the 5% level for the 2000-2010 period, and is negative and statistically significant at the 10% level for the 2011-2014 periods. In addition, the positive effect of the level of the loans-to-assets ratio (LOANTA) on non-performing loans is positive and statistically significant at the 1% level for the first two sub-periods and is positive and statistically significant for the last period. These findings appear to suggest that loan growth has no effect on non-performing loans until the end of the Asian financial crisis. In the aftermath of the reforms occurring during/after the Asian financial crisis, loan growth has a negative effect on non-performing loans. This negative effect becomes insignificant after the
global financial crisis, which might be attributable to changes in banking regulations introduced during and/or after the global financial crisis.
5 The long-run impact of loan growth on non-performing loans
5.1 Empirical framework
Thus far, I have shown that a bank’s loan growth rate has a negative short-run effect on non-performing loans. This negative relationship will naturally encourage banks to further increase their loans at the risk of having more bad loans in the long run. As the literature (see e.g., Foos et al., 2010) suggests that abnormal loan growth will lead to a substantial increase in bad loans (e.g., non-performing loans or loan losses) in about two or three years later, in this section I focus my analysis on the relationship between the current non-performing loans and previous loan growth up to three years ago. More specifically, I estimate the following regressions:
yi,j,t =a+b1LOANGROWTHi,j,t-1+b2LOANGROWTHi,j,t-2
+b3LOANGROWTHi,j,t-3+gBi,j,t-1+lCj,t+hi+ut+ei,j,t, (5)
yi,j,t =a+yi,j,t-1+b1LOANGROWTHi,j,t-1+b2LOANGROWTHi,j,t-2
+b3LOANGROWTHi,j,t-3+gBi,j,t-1+lCj,t+hi+ut+ei,j,t, (6)
where all variables are defined as before. If loan growth has a positive long-run effect on non-performing loans, the coefficients β2 and/or β3 should be positive and statistically significant. To control for a possibility that non-performing loans are persistent, I also
estimate a simple dynamic OLS regression of Equation (6) where a one-period lag of the dependent variable is included as an explanatory variable.
5.2 Empirical results
Table 6 presents the results of panel OLS regressions of Equations (5) and (6), where the dependent variable is NPLTL. I estimate regressions in levels in columns (1) and (2) and in first differences in columns (3) and (4). I use ∆ to denote the first difference operator (e.g.,
∆NPLTL = NPLTLt – NPLTLt-1). The results in column (1) provide evidence for the negative short-run effect and the negative long-run effect of loan growth on non-performing loans as the coefficient on the one-year lag of LOANGROWTH is negative and statistically significant and the coefficient on the two-year lag of LOANGROWTH is negative and statistically significant. However, the coefficient on the three-year lag of LOANGROWTH is statistically insignificant.
The simple dynamic OLS regression results in column (2) indicate that after controlling for a one-year lag of non-performing loans9, the negative short-run effect of loan growth disappears. The coefficient on the two-year lag of LOANGROWTH is negative and statistically significant while the coefficient on the three-year lag of LOANGROWTH is positive and statistically significant, suggesting that loan growth on non-performing loans is negative in the intermediate run and is positive in the long run. These results are consistent with Hypothesis 2. The results of first-difference regressions in columns (3) and (4) also reveal that the effect of loan growth on non-performing loans is negative in the short- and intermediate-run.
9 A positive and statistically significant coefficient on the one-year lag of NPLTL implies that
[Insert Table 6 about here]
Overall, the results in this subsection suggest that loan growth does not result in an increase in non-performing loans in the short run but may lead to a hike in non-performing loans in the long run.
6 The short-run impact of loan growth on profitability
6.1 Empirical framework
One important question that has been raised in the literature is whether a bank with higher loan growth is more profitable after controlling for risk. To address this question, I empirically test whether a lagged loan growth rate (i.e. LOANGROWTH at time t-1) has a positive effect on profitability, measured as return on assets (ROA), after controlling for operating risk (SDROA), the level of the loan-to-asset ratio (LOANTA), and other bank- and country-level factors. I use ROA as a measure of profitability in this study since banks’
performance-based compensation scheme (e.g., bonuses) is generally based on profits.
Accordingly, I estimate the following panel OLS regression.
ROAi,j,t =a+b1LOANGROWTHi,j,t-1+gBi,j,t-1+lCj,t+hi+ut+ei,j,t. (7)
where all variables are defined as before. I add year fixed effects to control for time-variant omitted global-level factors and bank fixed effects to control for time-invariant omitted bank-
level factors. If loan growth has a positive effect on profitability, the coefficient β1 should be positive and statistically significant.
6.2 Empirical results
Table 7 presents panel OLS results of Equation (7), where the dependent variable is return on assets (ROA). I add the bank- and year-fixed effects in column (1). The results in column (1) reveal that loan growth has a positive effect on profitability, given that the coefficient on LOANGROWTH is positive and statistically significant at the 1% level. This finding provides empirical support to Hypothesis 3, predicting that loan growth has a positive effect on profitability in the short-run. I find that the results in column (1) are largely consistent with the theory. For instance, GDP growth and the investment rate have a positive effect on banks’ profitability. In addition, banks with better capitalization (CAPTA), more liquidity (CASHDEP), and better stock price performance (RETURN), and higher loan grate rate (LOANGROWTH) tend to be more profitable. Smaller banks with smaller assets (LNTA) and banks with greater operating risk (SDROA) are more likely to be less profitable.
Interestingly, the effect of bank revenue diversification on profitability is insignificant, indicating that the focus on non-interest income strategies (or lack thereof) has no direct effect on profitability of banks in Asia. This finding is in contrast to those of prior studies.
For example, Demirgüç-Kunt and Huizinga (2010) show that revenue diversification is positively associated with ROA. Furthermore, while prior studies such as Bolt et al. (2012) show that the level of loans positively affects profitability, I find that the effect of LOANTA is insignificant, regardless of whether or not loan growth is included in the regression.
[Insert Table 7 about here]
To test whether the finding that loan growth has a positive effect on profitability is robust after controlling for potentially omitted time-invariant country-level factors, I replace bank fixed effects with country fixed effects in column (2), leading to virtually unchanged results.10 That is, the effect of loan growth on profitability is still positive and statistically significant.
I test the non-linear effect of loan growth on profitability by adding the squared term of LOANGROWTH in column (3). The coefficient on the squared term in column (3) is negative and statistically significant at the 1% level. This finding indicates that the effect of loan growth on profitability is positive and non-linear (i.e., inverted U-shaped). Taken together, my findings indicate that an increase in loan growth can improve the bank’s profitability but this positive influence no longer exists when the increase in loan growth reaches a certain level.
7 Conclusion
One of important questions related to financial institutions is whether expanding a bank’s loans increases the level of non-performing loans. From banking supervision’s perspective, this question is crucial since a significant increase in non-performing loans poses a greater risk to the stability of banking/financial systems that might eventually cause a banking/financial crisis. While this question has been addressed extensively in the context of
10 The fact that the results are generally insensitive to bank fixed effects or country fixed effects is supportive of the view of Beltratti and Stulz (2012), who find that there is no correlation between differences in banking regulations across countries and variation in bank
developed countries, empirical evidence for developing countries, especially those in Asia, is still limited. Hence, in this paper I revisit this question using a sample of publicly listed banks in Asia between 1990 and 2014.
The main focus of this paper is to study (1) the short- and long-run effects of loan growth on non-performing loans and (2) the short-run effect of loan growth on profitability. Overall, the results indicate that banks with higher loan growth rate tend to have smaller non- performing loans in the short run. I consider several possible explanations for the finding. For this negative effect to occur, the bank either has good risk management systems (resulting in high quality loan portfolios) or engages in loan evergreening. My analysis further reveals that loan growth has a positive effect on non-performing loans in the long run; however, this long-term effect is not robust. I also find that banks with higher loan growth rate tend to have higher profitability, measured as the return on asset (ROA), after accounting for bank- specific characteristics and country-level factors.
The short-run effect of loan growth on non-performing loans is time varying. That is, the effect is insignificant prior to 2000 (i.e. before the end of the Asian financial crisis), is negative and significant during 2000-2010, and is negative and marginally significant during 2011-2014. The time-varying effects of loan growth might be attributable to unobservable changes in banks’ behaviors (e.g., lending standards) as a result of changes in banking regulations in the aftermath of financial crises.
In summary, my findings highlight new and important insights into the implications of a bank’s loan growth for its profitability and non-performing loans. My results demonstrate one channel through which a bank can improves its profitability and NPL ratios, thereby adding to the policy debate on banking regulations.
References
Acemoglu, D., Ozdaglar, A., Tahbaz-Salehi, A., 2015. Systemic risk and stability in financial networks. American Economic Review 105, 564-608.
Acharya, V., Naqvi, H., 2012. The seeds of a crisis: A theory of bank liquidity and risk taking over the business cycle. Journal of Financial Economics 106, 349-366.
Ağca, Ş., De Nicolò, G., Detragiache, E., 2013. Banking sector reforms and corporate leverage in emerging markets. Emerging Markets Review 17, 125-149.
Allen, F., Babus, A., Carletti, E., 2012. Asset commonality, debt maturity and systemic risk.
Journal of Financial Economics 104, 519-534.
Banker, R.D., Chang, H., Lee, S.-Y., 2010. Differential impact of Korean banking system reforms on bank productivity. Journal of Banking & Finance 34, 1450-1460.
Bannier, C.E., Feess, E., Packham, N., 2013. Competition, bonuses, and risk-taking in the banking industry. Review of Finance 17, 653-690.
Becker, B., Ivashina, V., 2014. Cyclicality of credit supply: Firm level evidence. Journal of Monetary Economics 62, 76-93.
Beltratti, A., Stulz, R.M., 2012. The credit crisis around the globe: Why did some banks perform better? Journal of Financial Economics 105, 1-17.
Bikker, J.A., Metzemakers, P.A.J., 2005. Bank provisioning behaviour and procyclicality.
Journal of International Financial Markets, Institutions and Money 15, 141-157.
Bolt, W., de Haan, L., Hoeberichts, M., van Oordt, M.R.C., Swank, J., 2012. Bank profitability during recessions. Journal of Banking & Finance 36, 2552-2564.
Bolt, W., Humphrey, D., 2010. Bank competition efficiency in Europe: A frontier approach.
Journal of Banking & Finance 34, 1808-1817.
Brown, C.O., Dinç, I.S., 2011. Too many to fail? Evidence of regulatory forbearance when the banking sector is weak. Review of Financial Studies 24, 1378-1405.
Bruche, M., Llobet, G., 2014. Preventing zombie lending. Review of Financial Studies 27, 923-956.
Caballero, R.J., Hoshi, T., Kashyap, A.K., 2008. Zombie lending and depressed restructuring in Japan. American Economic Review 98, 1943-1977.
Campello, M., Giambona, E., Graham, J.R., Harvey, C.R., 2012. Access to liquidity and corporate investment in Europe during the financial crisis. Review of Finance 16, 323-346.