A posthumous prize will only be awarded in the event of the winner's death during the selection process and awarding of the prize. Below are summaries of the main papers that will be presented at the conference.
ASSESSMENT OF EMISSION
CONTROLS FOR A NEW PRODUCTION UNIT AT THE GEELONG OIL REFINERY
INTRODUCTION
Therefore, all possible impacts of the project on the environment were thoroughly examined, various control options were evaluated and optimal solutions were included in the final project.
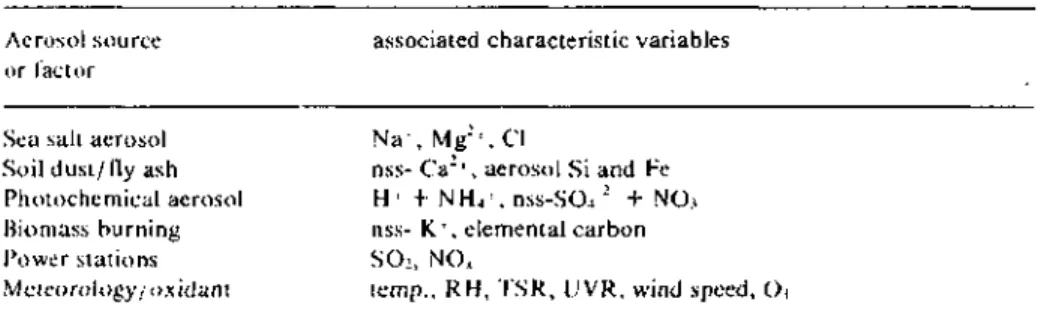
EMISSIONS TO ASR
- Evaluation of options for reduc- tion of SO x emissions
- Option 1. Desulfurisation of some refinery fuel gas streams
- Option 2. Reduction of Claus sulfur recovery unit stack emissions
- Option 3. Desulfurisation pro- cess on the new residue catalytic
- Plume dispersion modelling of NO x /SO 2 emissions to air
Shell has reviewed all of the above information and with the desire to d o p t the most environmentally friendly. This cost is the ongoing purchase of the Desox additive converted to an equivalent capital cost for comparison).
SHELL GEELONG REFINERY
The RCCU emissions of SO3 will be maintained below the SEPP requirement of 0.100 g/m3 through the use of Desox catalyst when processing acid feeds. The predicted emission levels resulting from the refinery with the proposed emission control measures in place were then incorporated into the EPA Ausplume plume dispersion model to generate ground level concentration figures.
SULFUR EMISSION CONTROL SUMMARY
OTHER ENVIRONMENTAL CONSIDERATIONS
- Effluent discharges
Solidification of the waste catalyst by mixing with cement followed by disposal via the current practice of trucking to the local minicipal. Disposal via intimate mixing of small amounts of catalyst in general purpose concrete. Approval must then be obtained from the Road Construction Agency for general use of the catalyst.
Using a conservative extrapolation based on experience with similar projects, the total installation sound power level for the RCCU plot corresponding to these location criteria has been estimated at 118 dB(A). The estimated sound power level was used to generate the resulting sound levels contributed by the RCCU at the two nearest residential points. A number of different options for the increased cooling capacity required by the RCCU project have been investigated and budgeted.
It was therefore decided to maximize the use of air cooling where practical in the project and improve the management of cooling water consumption so that no additional discharge is required.
INDUSTRY/EPA INTERACTION 1 Responsible development
Consideration of the sociological consequences of the project is inextricably linked to EPA requirements regarding air emissions, waste reduction, sewage discharges, noise, etc. The industry adjoins the southern boundary and Corio Bay is located just east of the refinery. There was one objection to planning permission, but after discussions with a third party who received advice from an environmental consultant, it did not proceed.
The cost/effectiveness of the different options was particularly important to achieve a realistic outcome of the proposal. This period would also be used to confirm the understanding of the influence of feed quality on SO2 and NOx emissions and the performance of the "Desox" catalyst. In addition to regular monitoring of emission levels, Shell would continue to monitor ambient air quality with another computerized monitoring system, mounted in a caravan located in a residential area of Corio.
The monitoring requirements will not be finalized until the issuance of a revised EPA discharge license following completion of construction of the RCCU.
CONCLUSION
The result was that there were no third-party objections to the project and the work permit was granted by the EPA. The environmental impacts of replacing the current CCU with the RCCU were systematically assessed and appropriate technological options were evaluated for their effects on pollutants. Shell proposed that monitoring of emissions from the new RCCU stack and all the other operating stacks at the refinery should be carried out via the current system of computerized pollution analyzers in a dedicated caravan.
The convoy would be attached to the RCCU stack for commissioning and acceptance testing of the unit. Similarly, an extended period of stack testing will accompany commissioning and acceptance testing of the new sulfur recovery unit. EPA agreed that such monitoring would be required, but determined that additional facilities be included in the project.
NEW PRODUCTS
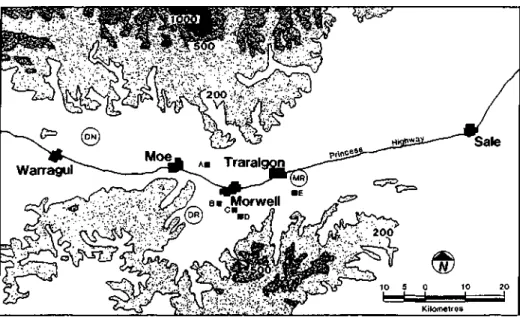
THE LATROBE VALLEY AEROSOL/VISIBILITY STUDY
A SUMMARY OF RESULTS G P Ayers, J L Gras, R W Gillett and
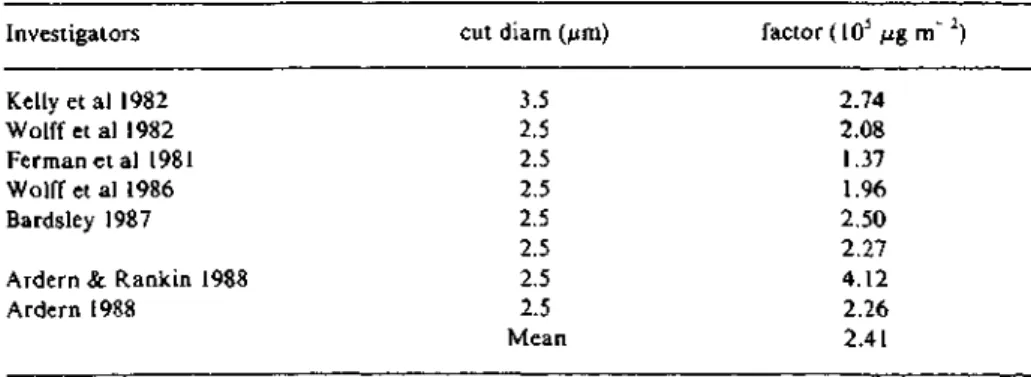
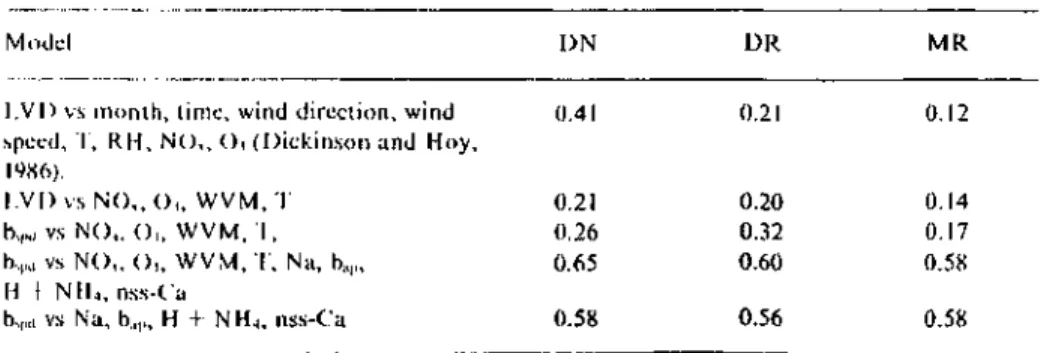
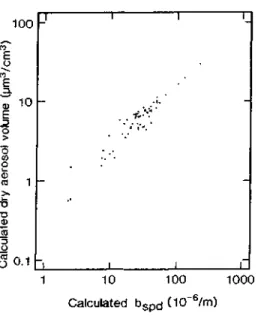
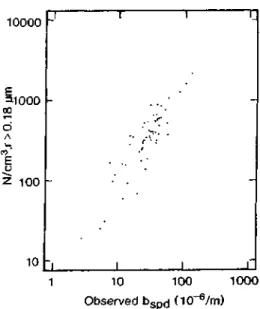
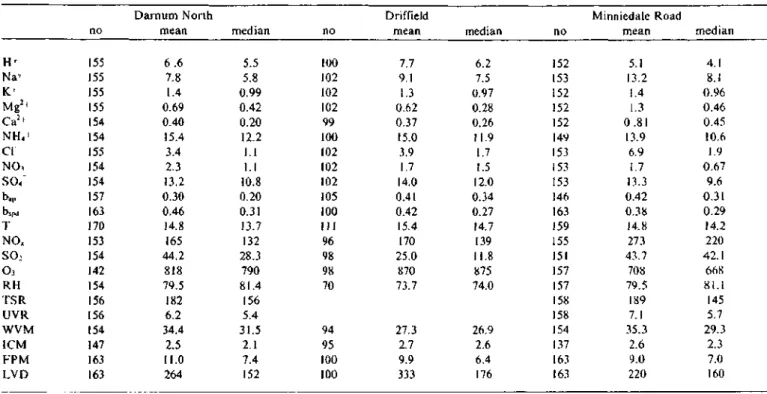
An independent assessment of the mass conversion factor can be made using the LVAVS particle size data, for a known particle composition. Entry four in Table 4 adds four extra, aerosol-related, independent variables obtained in the LVAVS. Sea salt and raw material played no apparent role in variation of bspd in the LVAVS data.
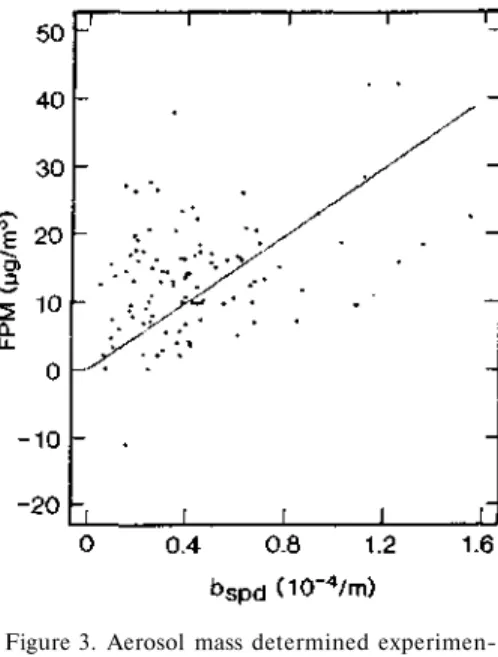
Scatter plot of the unreported mass concentration (FPM - total inorganic components) as a function of elemental carbon concentration. Scatter plot of the unreported mass concentration (FPM - total inorganic components) as a function of the concentration of nss. Direct measurements of chemical and microphysical properties of the sub-2.5 μm diameter fraction of aerosol in the Latrobe Valley provide fol.
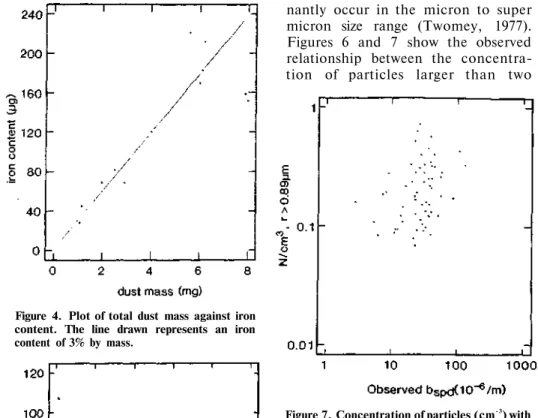
The lack of an influence of soil dust on the variance in bs p d raises questions about the accuracy of the recent emissions inventory for the Latrobe Valley (Marsiglio, 1986a,b).
FLOW COMPUTER
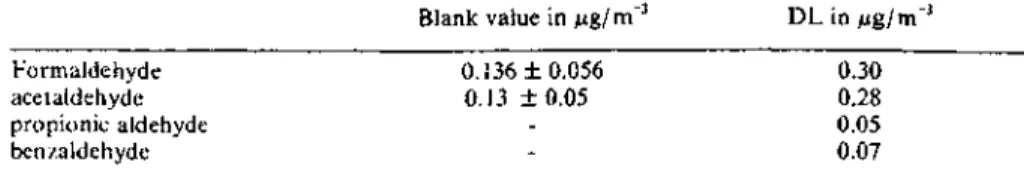
DETERMINATION OF ALDEHYDES IN THE ATMOSPHERE
After sampling, the cartridges are removed from the sampler and taken to the laboratory, where they are extracted with 2 ml of acetonitrile. The average deviation of the average value of the individual test gas from the theoretical value of the interlaboratory test was around minus. Since a 12% lower result than the theoretical value was also found in the calibration gas supplied for the interlaboratory test, no systematic loss occurs in the calibration of the method with the calibration gas (5).
This calibration under the influence of the sampling procedure should be preferred over the calibration with solutions. When comparing this estimated average annual value of the sum of the aldehydes and ketones with the average annual values in the Rhine-Ruhr area of the classic air pollutants such as SO2. As strong reducing agents, the aldehydes also change the oxidative properties of the atmosphere and therefore change its chemical properties.
The basis of the measurement is a new electrochemical cell technique which enables the simultaneous measurement of NOx/SO2.
THE COST OF STONE BUILDING SOILING IN SYDNEY
Mansfield
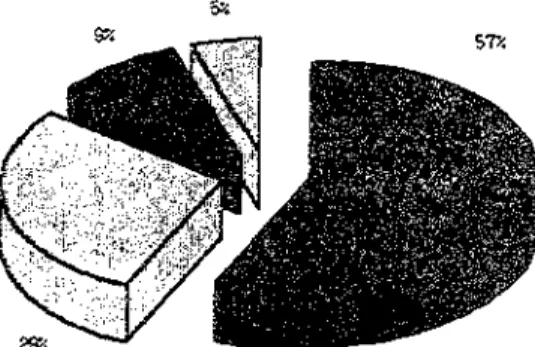
More than 60% of the companies said that a building only needs to be chemically cleaned once and that subsequent cleaning only requires water washing. In response to the question about the recommended cleaning frequency for a stone building in the city centre, more than 40% of the responses gave a time lapse. The main sources of the deposited material on building facades according to the companies are illustrated in Figure 4. Although an emission inventory of polluted particles has not been done for Sydney, the companies' opinions correspond well with the emission inventories carried out in European cities.
More than 60% of respondents predicted an increase in trade in the future and 82% expected their prices to rise no more than the rate of inflation over the next five years. The total value of the stone cleaning and repair industry operating in Sydney is therefore in the order of $26 million per year. However, even if the latter categories accounted for 50%. of the industry's turnover, the cost of air pollution to stone buildings in Sydney would be at least $13 million a year.
The figures obtained by this method are likely to be an underestimate of the total cost of damage because some of the larger companies were unwilling to state their turnover.
SMOG ALARMS IN GERMANY M Suffern
WEATHER REQUIREMENTS The following weather conditions are
POLLUTANT CONCENTRATION VALUES
The declared alert level increases to the next level if pollutant concentrations remain for 72 hours, even if the concentrations do not reach the values normally required for that higher level.
MEASUREMENT REQUIREMENTS The method of collecting data and its
Motorists have two hours from the announcement of the smog alert to park their car correctly. They must inform the competent authority in writing of the means by which they will achieve their reduction. Europe is a heavily polluted region of the world due to its extremely high population density.
Reducing the production of pollutants on days when they cannot be adequately distributed, as well as informing the public about the situation, are to be appreciated as initiatives to combat smog levels. The legislation lacks the bite of the West German Government and requests to the public are all the EPA can do. For example, many municipalities specify two separate days per week, plus any declared smog alert days.
MERCAPTANS IN AIR ANALYZER DJC Scientific has released the CEA Instruments Model TGM 555 Mercaptans in Air Monitor, one of the most sensitive analyzers for mercaptans available.
EQUIPMENT SUPPLIERS INDEX
- AIR SYSTEMS AUSTRALIA PTY. LTD
- ASCOT INDUSTRIAL SALES, 231-233 Elizabeth Street,
- DOBBIE I N S T R U M E N T S (AUSTRALIA) PTY. LTD,
- F O W L E R E X S A L E S PTY LIMITED
- H O S O K A W A M I K R O P U L AUSTRALASIA,
- SELBY ANAX,
- INSULATION PROCESS AND CONTRACTING
- R E I N F O R C E D P L A S T I C / COMPOSITES
- BOTTLE/COM- POSITE SAMPLING
The analog and mechanical signal outputs connect the TLD-1 to strip chart recorders, remote alarm devices or other auxiliary systems, while the rechargeable battery provides continuous monitoring whenever and wherever you need it. It takes less than a minute to switch from one guest to the next, allowing you to handle emergency or temporary monitoring situations quickly, easily and extremely cost-effectively. The TLD-1 Chemkey system detects ammonia, arsine, chlorine, diisocyanates, diborane, hydrazines, HF, HCL, HCN, hydrogen sulfide, phosphine, silane, SO2, and phosgene as well as many other toxic gases.
Program status as well as a review of all programmed settings is easily determined by a single "return" key on the 18-position keyboard. Furthermore, 304 stainless steel refrigerators as well as fiberglass enclosures are available for outdoor applications. An adjustable contact closure output (or optional 4- 20 mA) allows the pacing of external equipment such as samplers in relation to the flow rate.
The Sigma 8100 can be supplied with or without a strip diagram and can be operated on AC as well as battery power.