The follow-up only ends when the graft is lost, or when the patient dies or is lost to follow-up. We thank all our many contributors for their tireless efforts on behalf of ACGR.
OVERVIEW AND CONTRIBUTOR INFORMATION
Current database
- Synopsis of the current database
- Survival of penetrating, lamellar and limbal grafts
Grafts registered from each State and by individuals
- Grafts entered from each Australian state
- Contributors in each state
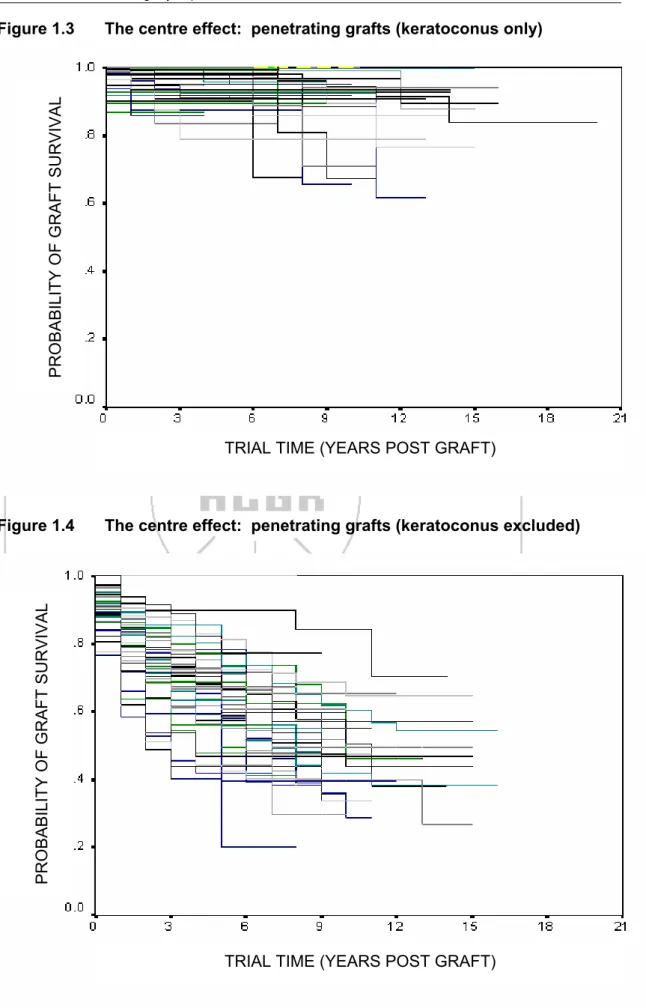
- The centre effect
- Outcome: average number of grafts performed per year
- Outcome: measured in groups of years
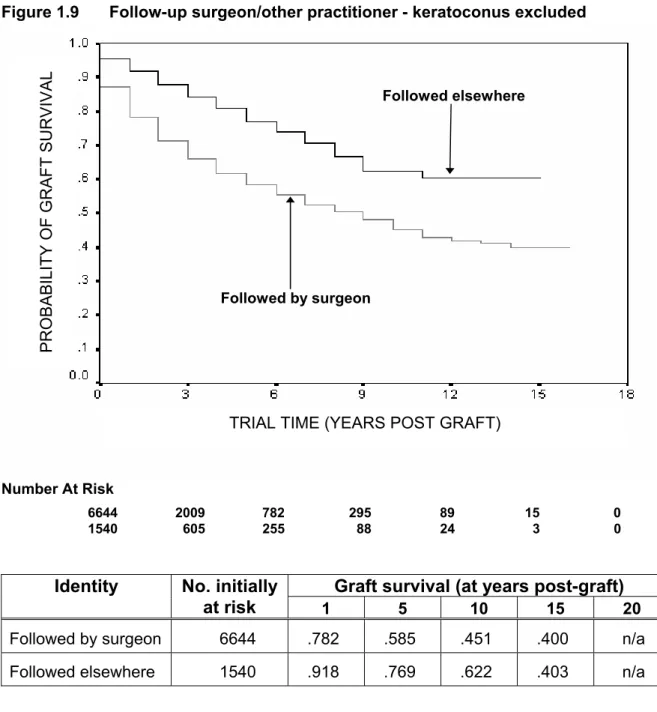
- Outcome: whether followed by surgeon or another practitioner
Summary of overview and contributor data
DONORS AND EYE-BANKING
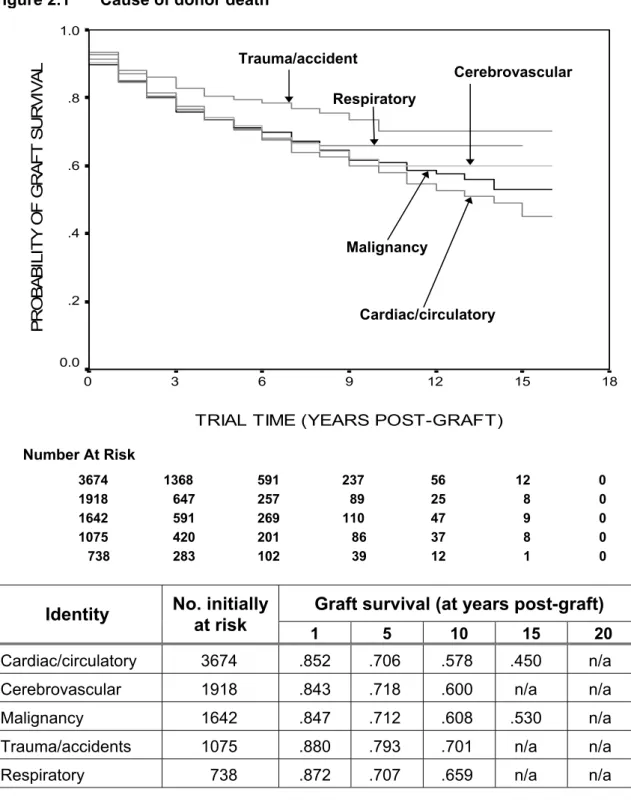
Cause of donor death
Closer investigation revealed that 47% of corneas in the trauma group were used for patients with keratoconus, compared with 26% in the cardiac group, 32% in the cerebrovascular group, 29% in the malignant group, and 26% in the respiratory group. Further, 53% of recipients in the trauma group were 40 years of age or younger at the time of transplantation compared with 27% in the cardiac group, 33% in the cerebrovascular group, 30% in the malignancy group, and 28% in the breathing.
Donor gender
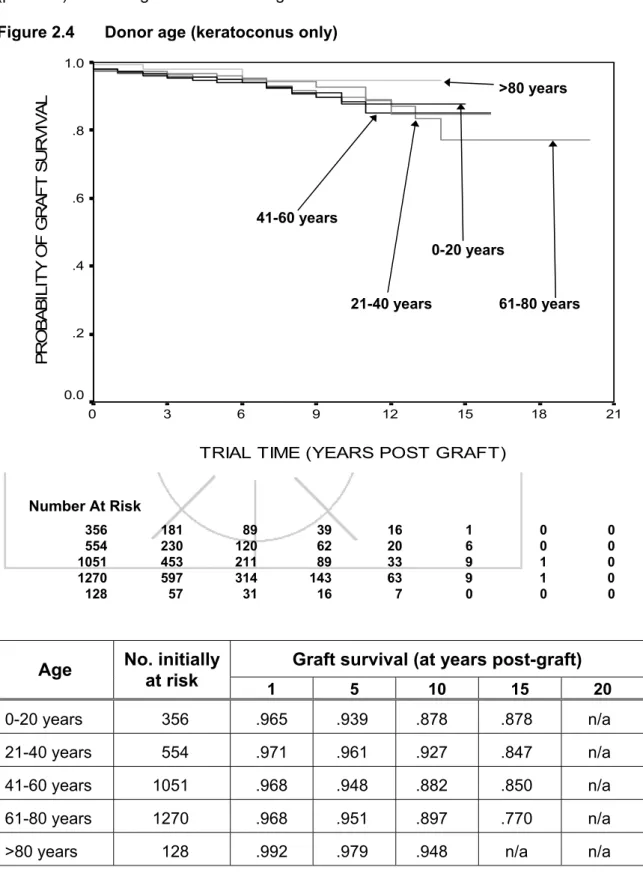
Donor age
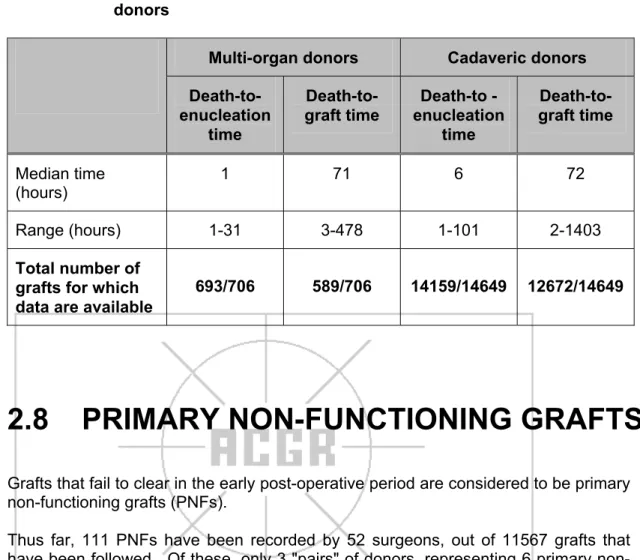
Death-to-enucleation and death-to-graft times
The influence of anterior vitrectomy performed at the time of transplantation on subsequent corneal graft survival is shown in Figure 4.2 (Log Rank Statistic=91.07; df=1; .p<0.00001).

Corneal storage media
- Optisol storage time
Donor procurement source
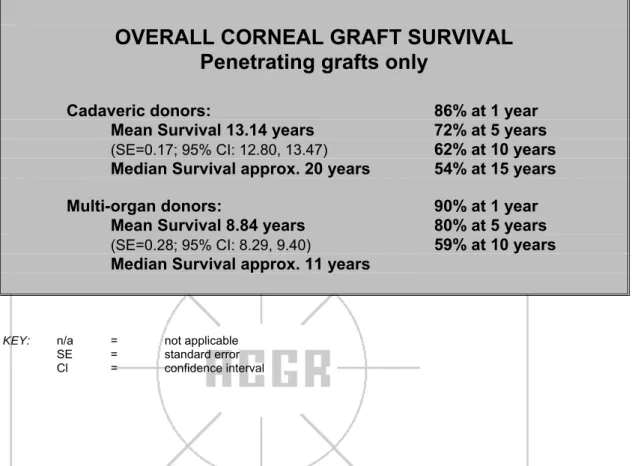
Multi-organ donors
Tables and 2.9 compare the sex, age, cause of death, time of death to enucleation and time of death to transplantation of multi-organ donors and cadaveric donors. Multi-organ donors tend to be relatively younger than cadaver donors and are more likely to have died from cerebrovascular disease or trauma/accident/poisoning.
Primary non-functioning grafts
The results of lamellar and limbal grafts stratified by recipient size are shown in Figure 7.5 (Log Rank Statistic=31.24; df=4; p<0.00001).
Summary of donor and eye-banking information
RECIPIENTS
Recipient age at graft
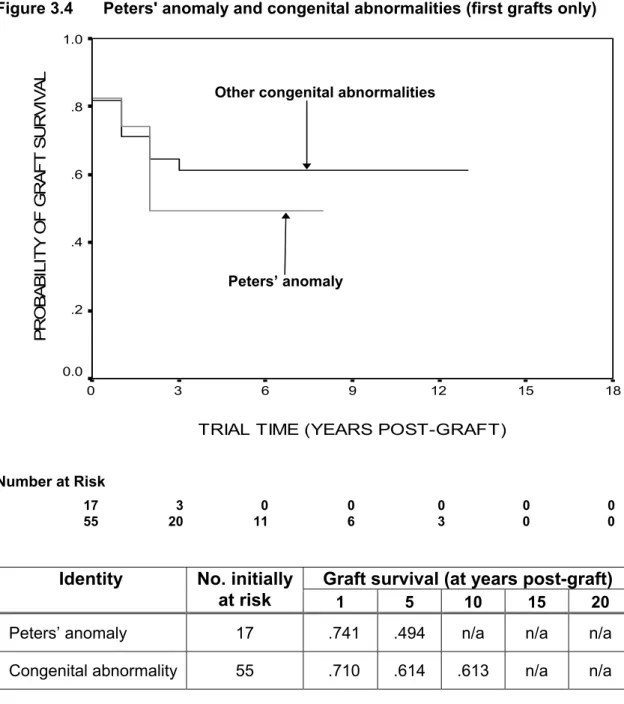
- Congenital abnormalities
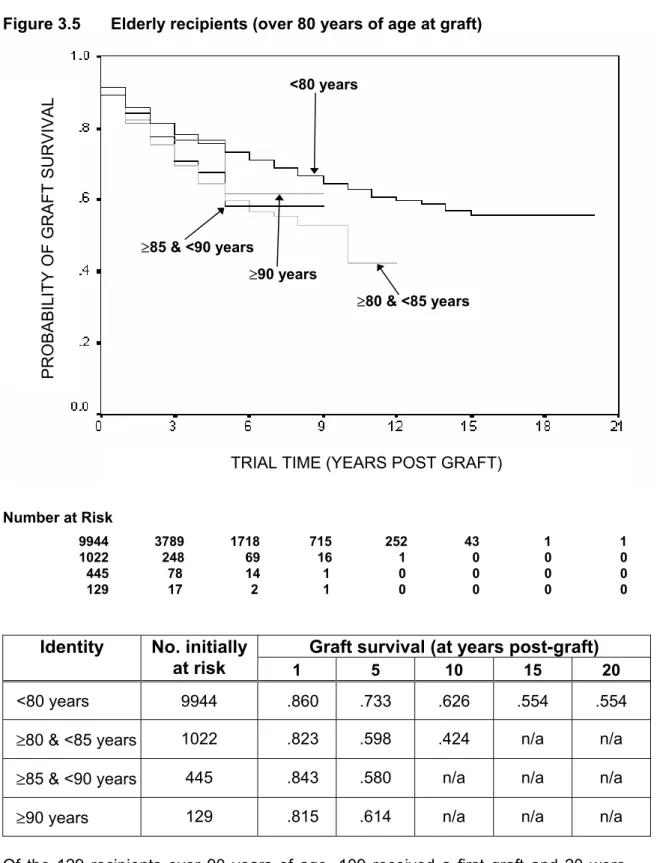
- Elderly recipients
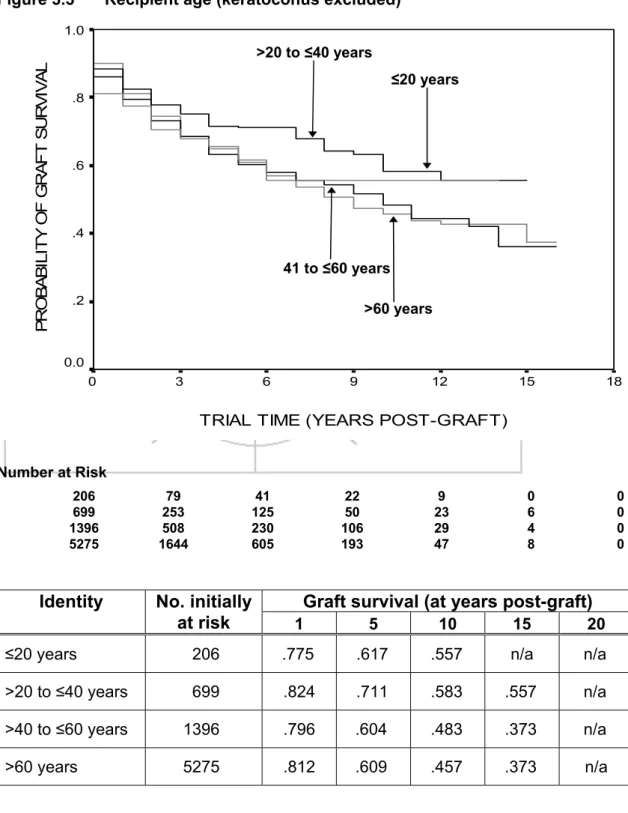
The majority of recipients transplanted for reasons other than keratoconus are over 60 years of age at the time of transplantation. In the cohort excluding recipients grafted for keratoconus, somewhat poorer graft survival is observed for recipients older than 40 years compared to those younger than 40 years (Log Rank Statistic=11.54; df=3; p=0.0092).
Recipient gender
Pre-graft complications
- Vascularisation
- Inflammation
- Intraocular pressure (pre-graft or at graft)
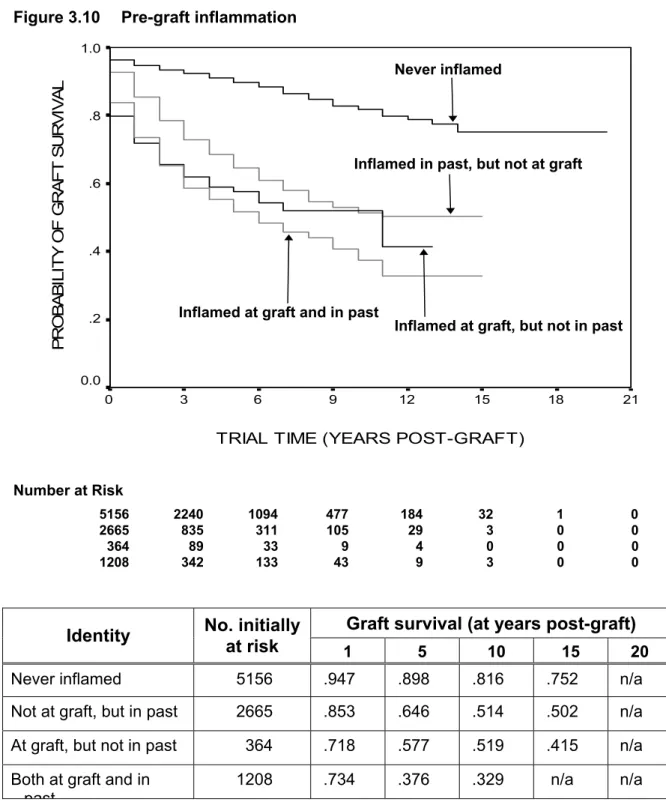
A history of inflammation was considered to have occurred in any graft in which steroids were recorded to have been used within 2 weeks prior to transplantation, or where the transplanted eye had previously undergone surgery. Anterior segment inflammation at any time is a significant factor for subsequent graft failure (Log Rank Statistic=883.86; df=3; p<0.00001). Recipients with elevated blood pressure at transplant and in the past are compared with recipients who had elevated blood pressure in the past but had normal blood pressure at the time of transplant, with those with elevated blood pressure at transplant but not in the past, and with those in whom elevated intraocular pressure was never recorded.
Elevated intraocular pressure at any time before, or during, transplantation is a significant risk factor for corneal graft failure (Log Rank Statistic=487.62; df=3; p<0.00001).
Presensitising factors
- Pregnancy
- Transfusion
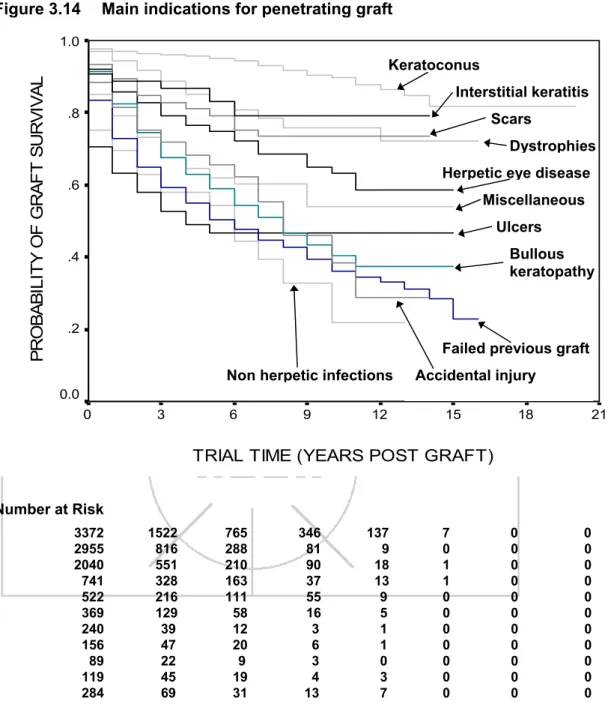
Main indication for graft
Effect of specific indication for graft on graft survival
- Keratoconus, keratoconus with hydrops or keratoglobus
- Corneal dystrophies
- Herpes simplex virus infection
- Corneal scars and opacities (non-herpetic)
- Burns and trauma
- Non-herpetic infections
- Descemetocoele
The effect of herpetic eye disease on a first transplant is shown in more detail in Figure 3.20. The survival of first transplants performed for corneal scarring and opacities is shown in Figure 3.21. In this figure, we examine the outcome of corneal transplantation for non-herpetic scars and scars due to old trachoma (Log Rank Statistic=0.61; df=1; .p=0.435).
The influence of a descemetocoele as an indication for transplantation on the survival of a first graft is shown in Figure 3.24.
Summary of recipient-related factors
PROCEDURES AT TIME OF GRAFT AND INFLUENCE OF IOLs
Operative procedures at graft
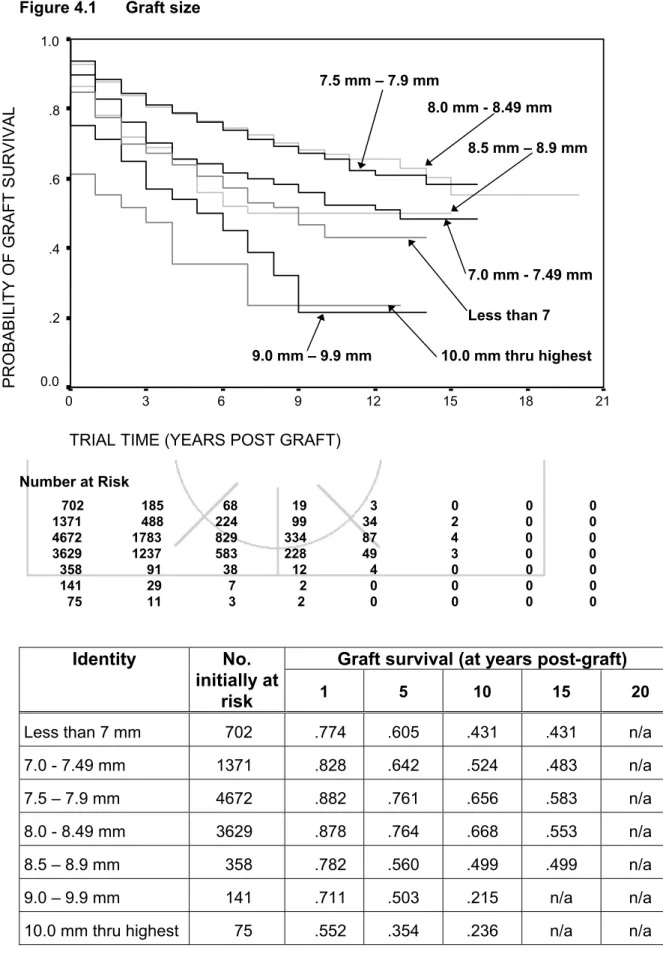
- Graft size
- Accompanying procedures at graft
- Influence of anterior vitrectomy
- Lens insertion
- Intraocular lens exchange at time of graft
- Comparison of intraocular lens placement
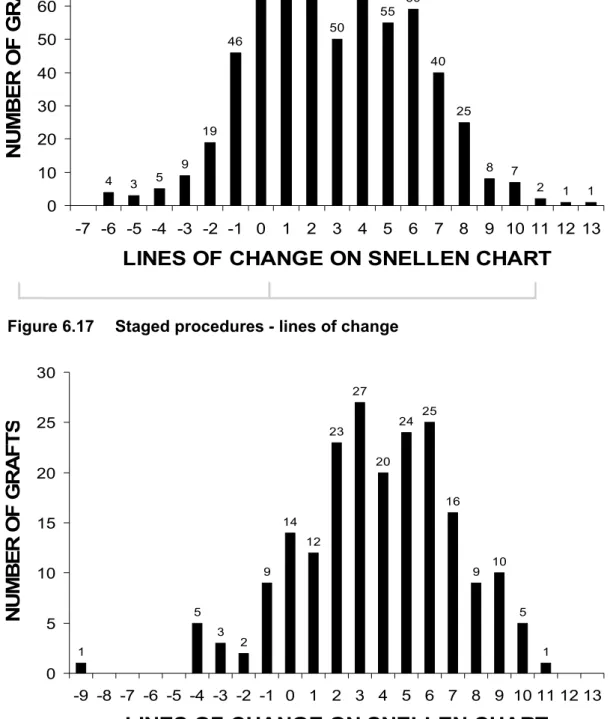
- Triple and staged procedures
Of the 1093 transplants reporting an increase in intraocular pressure in the post-transplant period, none failed. Removal of graft sutures within 6 months after transplantation is a risk factor for graft failure. The Australian Corneal Transplant Registry recorded the desired outcome for 13,831 penetrating grafts entered.
The Australian Corneal Transplant Registry recorded a desired outcome for 576 (93%) of 615 lamellar and limbal grafts inserted.
Summary of effect of operative procedures at time of graft and influence of IOLs
POST-GRAFT EVENTS
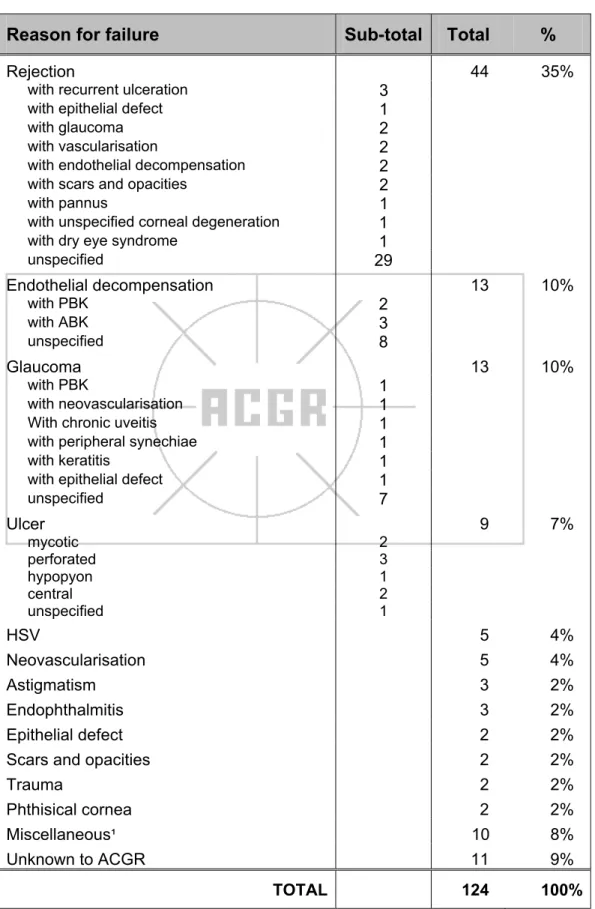
Reasons for graft failure
Time to suture removal
Of the 1093 transplants for which a post-graft increase in intraocular pressure was recorded from recipients, medication was prescribed in the period since their last follow-up. Of the 790 cases in which medication was prescribed in the last follow-up period to treat an increase in intraocular pressure grafts failed. For patients with penetrating grafts, 45% of the cohort achieved a Snellen acuity of 6/12 or better at the time of the most recent follow-up and 55% achieved 6/18 or better, but for 36% Snellen acuity was less than 6/60.
An intraocular lens was in place in the transplanted eye in about 41% of the cohort.
Post-graft complications
- Microbial keratitis/stitch abscess
- Uveitis
- Synechiae
- Post-vascularisation
- Post operative rise in intra-ocular pressure
- Effect of post-operative rise in intraocular pressure
- Glaucoma medication vs glaucoma surgery
- Rejection episodes since graft
Post-graft operative procedures
- Refractive surgery
Summary of post-graft events
VISUAL OUTCOME
Desired outcome
- Desired outcomes and actual outcomes achieved
Overall visual acuity
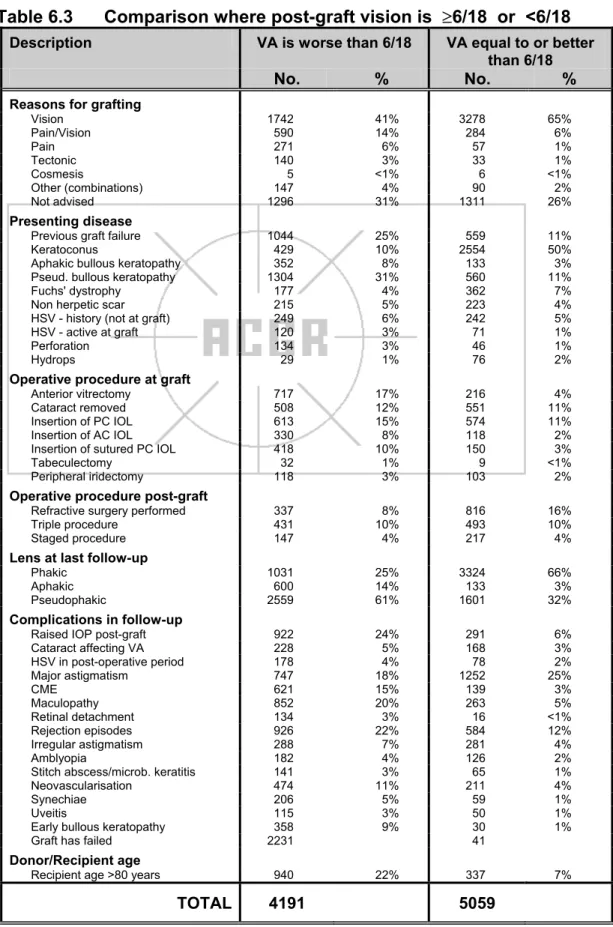
- Comparison where post-graft visual acuity is ≥6/18 or < 6/18
- Post-graft changes in visual acuity
In the 67% of cases in which visual acuity was reported both before and after transplantation, at least one line of improvement on the Snellen chart was achieved after transplantation. In recipients in whom HSV infection was recorded at any time pre-vaccination, 30% of the cohort achieved a post-vaccination visual acuity of 6/12 or better, 38% achieved 6/18 or better and 57% achieved 6/60 or better. The most important factors with a negative influence on the visual potential of the grafted eye were: >5D astigmatism, graft failure and retinal disease.
Factors affecting the visual potential of the grafted eye included astigmatism of more than 5 diopters (24%), graft failure (21%), and one or more comorbidities in the grafted eye.
Outcome related to the presenting disease
- Keratoconus
- Fuchs' dystrophy
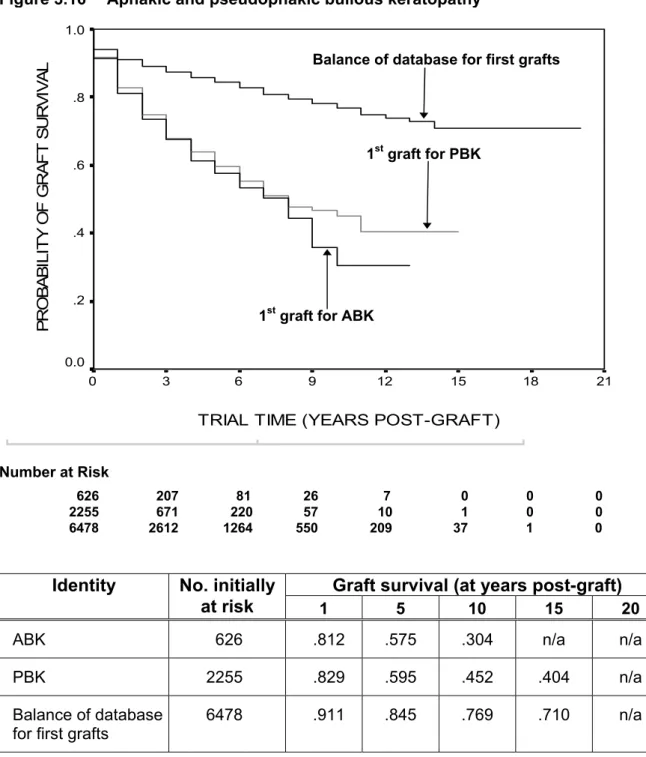
- Aphakic bullous keratopathy
- Pseudophakic bullous keratopathy
Factors affecting visual potential of the grafted eye
Astigmatism
Coster DJ, Williams KA, on behalf of all contributors to ACGR, The Australian Corneal Graft Registry (ACGR). Williams KA, Muehlberg SM, Lewis RF, Coster DJ, on behalf of all contributors to the Australian Cornea Registry (ACGR). Williams KA, Muehlberg SM, Lewis RF, Coster DJ, on behalf of all contributors to the Australian Cornea Registry.
Williams KA, Muehlberg SM, Lewis RF, Coster DJ, on behalf of all contributors to the Australian Corneal Graft Registry.
Refractive surgery
- Correction following refractive surgery
- Has refractive surgery improved visual acuity?
Triple and staged procedures
- Comparison of visual acuities
- Visual improvement after graft: triple and staged procedures
- Astigmatism in triple and staged procedures
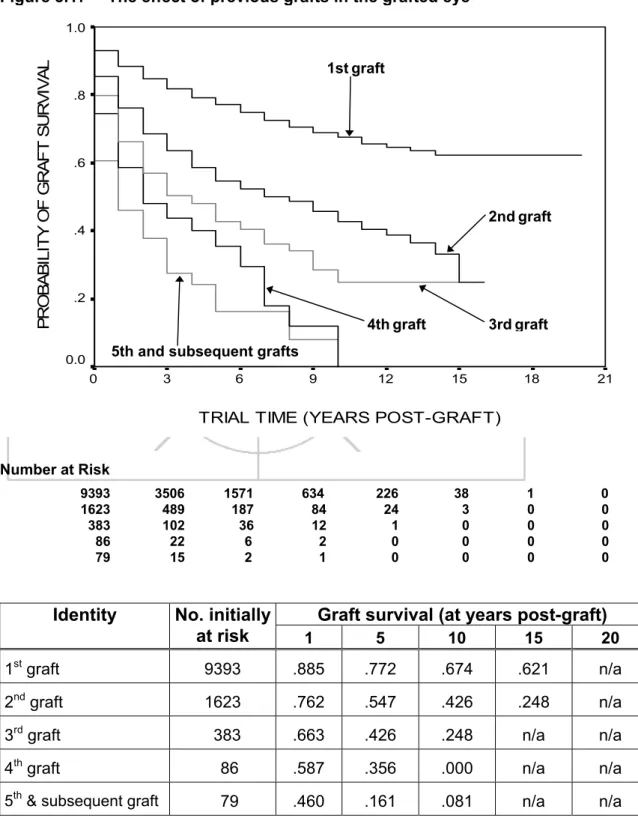
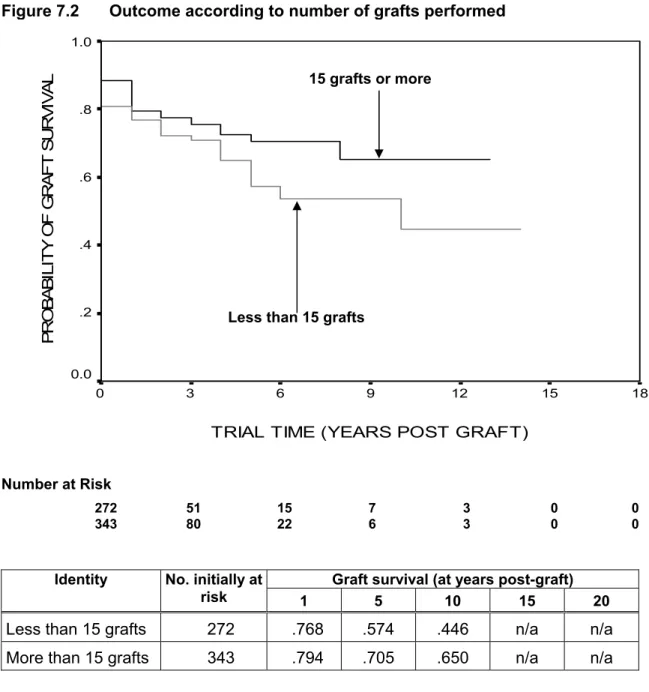
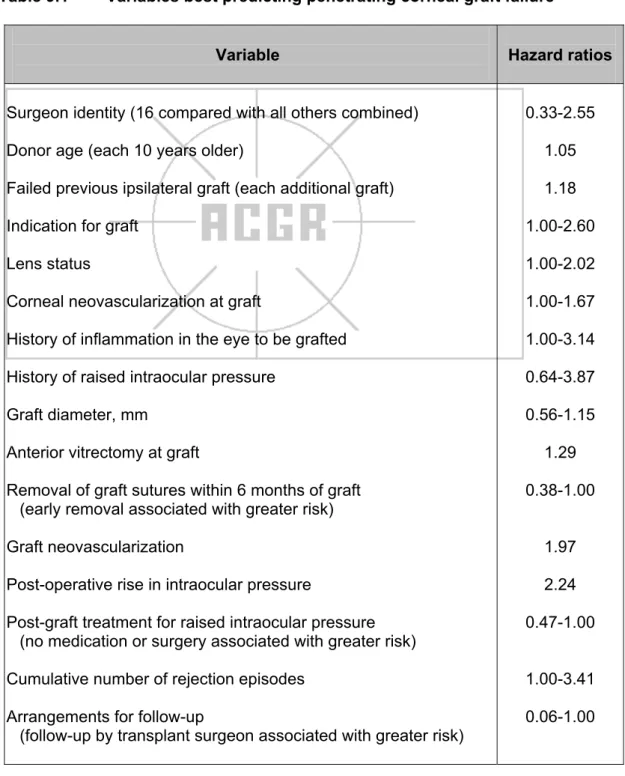
Some patients had a history of more than one ipsilateral corneal graft, and some had a record of one or more grafts in the contralateral eye (Table 8.1). A penetrating corneal graft that never clears and dilutes in the immediate postoperative period is considered a primary nonfunctioning graft. The variables best predicting penetrating corneal transplant failure in Cox proportional hazards regression analysis were surgeon identity, donor age, indication for transplant, number of failed previous ipsilateral corneal transplants, lens status, recipient corneal vascularization at the time of transplant, history of inflammation in the transplanted eye, history of elevated intraocular pressure pressure in the transplanted eye, graft diameter, anterior vitrectomy at the time of transplantation, time of removal of graft sutures, neovascularization of the graft, postoperative increase in intraocular pressure and type of glaucoma treatment received, number of episodes of corneal graft rejection and follow-up arrangements.
Each transplant was followed until graft failure or patient death or loss to follow-up.
Post-graft correction
Summary of visual outcome after corneal transplantation
In 73% of cases, the main reason for transplantation was improved vision, and in a further 14%, improved vision and pain relief were the reasons. Where data were available, Snellen acuity after corneal transplantation improved in 73% of cases, remained the same in 13.6% of cases, and worsened in 13.4% of cases. The visual result after corneal transplantation depends to some extent on the indication for the transplant, the status of the lens and concomitant diseases.
LAMELLAR AND LIMBAL GRAFTS
- Survival of lamellar and limbal grafts
- Outcome: total number of lamellar and limbal grafts performed
- Outcome: follow-up surgeon
- Outcome: graft size
- Main indication for graft
- Reasons for graft failure
- Desired outcome
- Overall visual acuity
- Summary of factors relating to lamellar and limbal grafts
Based on the results of Kaplan-Meier analyzes used to identify variables of interest, Cox proportional hazards regression models were used to explore the joint effects of a subset of variables on penetrating corneal graft failure. Examination of penetrating corneal graft survival by period (three-year time blocks) showed no significant change in graft survival over nearly 20 years. The median time between donor death and penetrating corneal graft surgery for Optisol-stored corneas was 98 hours.
In about 40% of the cases where information about the past history was available, the eye to be transplanted had been inflamed in the past or was inflamed at the time of transplantation.
COX PROPORTIONATE HAZARDS REGRESSION ANALYSIS
Methods
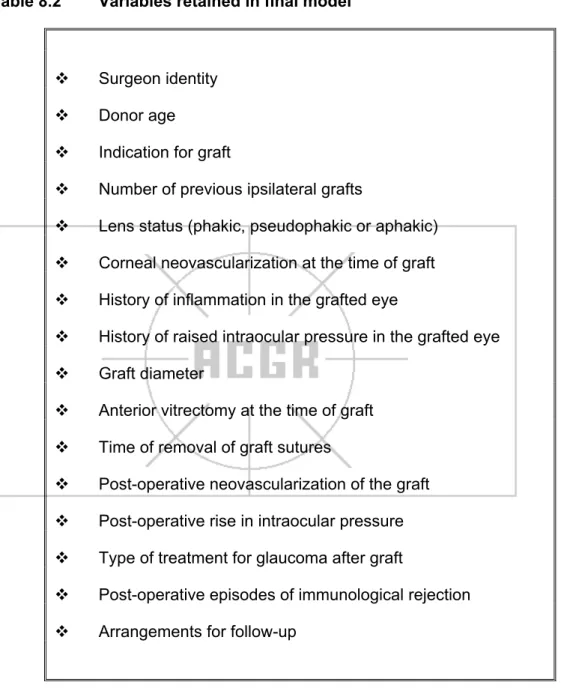
In previous univariate analyses, each recorded penetrating graft along with its subsequent archival data was treated as a separate and independent entity. To control for possible inter-graft and/or inter-eye dependence in multivariate analyses, Cox models were adjusted to allow for clustering by individual patient. Variables selected were: surgeon identity, surgeon volume (low or high), transplant era (in 3-year blocks), where follow-up occurred (with transplant surgeon or elsewhere), donor age, cause of donor death, if the cornea was from a multi-organ donor, eye bank identity, recipient age, pregraft corneal neovascularization, history of inflammation in the eye to be transplanted, history of increased IOP in the eye to be transplanted was grafted, blood transfusion history, pregnancy history, indications for transplantation, number of previous failed ipsilateral grafts, lens status, need for anterior vitrectomy at transplantation, graft size, time to removal of all graft sutures, post-operative uveitis, synechiae, microbial keratitis or suture abscess, increased IOP, graft neovascularization, rejection episode and type of glaucoma treatment.
The best model was found by a backward elimination process, removing variables that did not appear to be predictors of graft failure.
Final model
Further data analysis was undertaken by Dr Adrian Esterman, Flinders Center for Epidemiology and Biostatistics, Flinders University of South Australia, using SPSS for Windows version 12 and Stata version 8. The table shows the variable, the values of that variable, the ratio hazard, the standard error of the regression coefficient, the corresponding probability value, and the 95% confidence interval for the hazard ratio. Hazard ratios for a given variable are adjusted for all other variables in the model.
SUMMARY
- Grafts, contributors and era
- Corneal donors and eye banking
- Corneal graft recipients
- Operative procedures
- Causes of graft failure
- Risk factors for failure of penetrating grafts
- Visual outcome after corneal transplantation
Approximately one-third of recipients showed signs of corneal neovascularization at the time of transplantation. In about 15% of cases, intraocular pressure in the eye to be transplanted has been elevated in the past or will be elevated at the time of transplantation. Factors that did not significantly affect the survival of penetrating corneal graft in multivariate analysis were: surgeon volume, age of graft, cause of death of donor, acquisition of cornea from multi-organ donor, identity of eye bank, age of recipient, history of recipient's blood transfusion, history of pregnancy recipients, postoperative uveitis, development of post-transplant synechiae, and occurrence of suture abscess.
In 73% of cases, the only desired outcome for corneal transplantation was to improve vision in the grafted eye.
METHODS
- Entry and follow-up
- Definition of risk factors
- Definition of graft failure, rejection and complications
- Statistical analyses
For surviving grafts, the trial period is calculated as the time between the date of transplantation and the date the patient was last seen. For failed grafts, the trial period is calculated as the time between the transplant date and the date of failure. Williams KA, Sawyer M, Alfrich SJ, Joseph L, White MA, Coster DJ, Mahmood M, on behalf of all contributors.
Williams KA, Sawyer MA, White MA, Mahmood MI, Coster DJ, on behalf of all contributors.