General Instructions
• Reading time – 5 minutes
• Working time – 3 hours
• Write using black or blue pen
• Draw diagrams using pencil
• Board-approved calculators may be used
• A Geological Time Scale is provided at the back of this paper
• Write your Centre Number and Student Number at the top of pages 9, 13 and 17
Total marks – 100
Pages 2–20 75 marks
This section has two parts, Part A and Part B Part A – 15 marks
• Attempt Questions 1–15
• Allow about 30 minutes for this part Part B – 60 marks
• Attempt Questions 16–26
• Allow about 1 hour and 45 minutes for this part Pages 21–29
25 marks
• Attempt ONE question from Questions 27–30
• Allow about 45 minutes for this section Section II
Section I
Earth and Environmental Science
139
2002
H I G H E R S C H O O L C E R T I F I C A T E E X A M I N A T I O N
– 2 –
Section I
75 marks
Part A – 15 marks Attempt Questions 1–15
Allow about 30 minutes for this part
Use the multiple-choice answer sheet.
Select the alternative A, B, C or D that best answers the question. Fill in the response oval completely.
Sample: 2 +4 = (A) 2 (B) 6 (C) 8 (D) 9
A B C D
If you think you have made a mistake, put a cross through the incorrect answer and fill in the new answer.
A B C D
If you change your mind and have crossed out what you consider to be the correct answer, then indicate the correct answer by writing the word
correct
and drawing an arrow as follows.correct
A B C D
1 The map shows some geological regions in Australia.
What is the order of formation, from oldest to youngest, of these regions?
(A) Z,X,Y,W (B) X,Y,W,Z (C) W,X,Y,Z (D) X,Y,Z,W
2 A change from greenhouse to icehouse conditions on Earth may require up to 10 million years and is probably caused by which of the following?
(A) Accumulation of carbon dioxide from volcanic eruptions (B) Drifting of the Antarctic Plate away from the South Pole (C) Formation of dust clouds due to meteorite impacts (D) Removal of carbon dioxide from the atmosphere
3 Over geological time, which of the following is best explained by the plate tectonic supercycle?
(A) Cyclical patterns of earthquakes
(B) Formation and breakup of supercontinents
(C) Mass extinctions and explosions in the number of species
(D) Cycling of continental crust from subduction zones to mid-ocean ridges
Z X Y
W
Fold belt
Basin Fold belt
Shield
– 3 –
4 The map shows the region where the North American, Pacific and Juan de Fuca Plates meet.
The block diagram was drawn using information from the map.
Which location on the map could this block diagram represent?
(A) A —A' (B) B—B'
(C) C—C' (D) D—D'
Pacific Plate
Fault Fault
North American Plate D'
A
B
C
D A'
B'
C' Juan de Fuca
Plate
Pacific Plate
North American
Plate
Sierra Nevada Fault San Andreas Fault
Fault movement Plate movement Mid-ocean ridge
Key
– 4 –
5 The map shows Australia, part of Antarctica and the mid-ocean ridge (MOR) between them. The age of oceanic crust at X and Yis approximately 80 Ma BP and the distance between these points is 5600 km.
Assuming the rate has remained constant, by how much is the distance between Australia and Antarctica increasing each year?
(A) 70 cm
(B) 35 cm
(C) 7.0 cm
(D) 3.5 cm
6 Which one of the following best describes stromatolites?
(A) Rod-like structures produced by volcanic vents on the ocean floor (B) Fossilised remains of animals that inhabit the deep ocean floor (C) Structures produced by living organisms that trap sediment (D) Chalk deposits precipitated by coral-like animals
Antarctica Australia
X
Y MOR
– 5 –
7 All significant Banded Iron Formations (BIFs) were formed prior to 1800 Ma BP.
What does this indicate about conditions on Earth prior to 1800 Ma BP?
(A) There was very little free oxygen in the atmosphere.
(B) Weathering of iron-rich rocks had not commenced.
(C) Photosynthetic organisms were abundant.
(D) Deep ocean basins had not formed.
8 What advantage for survival did hard-shelled animals have over soft-bodied metazoans like the Ediacara fauna?
(A) Hard-shelled animals could exploit deeper marine environments.
(B) Hard-shelled animals were more readily preserved as fossils.
(C) Hard-shelled animals were better protected from predation.
(D) Hard-shelled animals were able to move more efficiently.
9 In which subdivision of geological time did organisms first expand into terrestrial environments?
(A) Proterozoic (B) Palaeozoic (C) Mesozoic (D) Cenozoic
10 In a Cambrian stratigraphic sequence, absolute dating of thin volcanic layers has been used to provide age ranges for some fossils. The age ranges are listed in the table.
What is the likely age range for sedimentary strata containing fossils A and B but not containing fossilC?
(A) 542–536 Ma BP (B) 542–530 Ma BP (C) 548–523 Ma BP (D) 548–530 Ma BP
Last appearance (Ma BP)
523 530 523 First appearance
(Ma BP) 548 542 536 Fossil
A B C
– 6 –
11 The table shows the results of a study in the Murray–Darling Basin in which scientists measured the depth to the water table in a soil profile over a period of 30 years.
What is one likely effect of the trend shown in the table?
(A) Increased growth of plants (B) Depleted soil nutrients (C) Increased soil erosion (D) Increased soil salinity
12 Octane is a major compound found in petrol.
Which equation represents the complete burning of octane?
(A) Octane + oxygen → hydrocarbon + water vapour (B) Octane + carbon dioxide → oxygen + water vapour (C) Octane + oxygen → carbon dioxide + water vapour
(D) Octane + carbon dioxide → carbon monoxide + water vapour
13 Which of the following strategies would be the most effective in rehabilitating salt-affected land?
(A) Changing the land use from crop growing to animal grazing (B) Using overhead irrigation to flush salt from the soil
(C) Adding fertiliser to neutralise salts in the soil (D) Lowering the water table through revegetation
Depth to the water table (m)
4.0 3.1 2.8 2.4 Year
1970 1980 1990 2000
– 7 –
14 What is one likely effect of the depletion of Earth’s ozone layer?
(A) A gradual increase in the average temperature of Earth’s surface (B) Increased amounts of UV radiation reaching Earth’s surface (C) A decrease in the oxygen content of the atmosphere
(D) Rising sea levels as the polar ice caps gradually melt
15 The graph shows the predicted effects of implementing the Montreal Protocol controls on chlorine concentration in the stratosphere.
Which of the following statements is supported by the information in the graph?
(A) Chlorine concentrations will increase by 13 ppb between 1985 and 2030 without the implementation of the Protocol.
(B) Chlorine concentrations will decrease by 50% between 1995 and 2030 with the implementation of the Protocol.
(C) Protocol implementation will result in chlorine concentrations returning to 1985 levels by the year 2005.
(D) Implementing the Protocol will lead to chlorine concentrations in 2030 being 10 ppb lower than if the Protocol is not implemented.
1985 1990 1995 2000 2005 2010 2015 2020 2025 2030 14
12 10 8 6 4 2
Without the Protocol With the Protocol
Chlorine concentration in parts per billion (ppb)
Year
– 8 –
©Board of Studies NSW 2002
Section I (continued)
Part B – 60 marks
Attempt Questions 16–26
Allow about 1 hour and 45 minutes for this part Answer the questions in the spaces provided.
Marks Question 16(7 marks)
(a) Name the supercontinent that was largely made up of Australia, Antarctica, Africa, South America and India.
...
(b) Describe ONE piece of evidence which indicates that the Australian continent has grown over time.
...
...
...
...
(c) In terms of current hypotheses on plate movement, explain the processes by which large continental masses, such as those in part (a), move apart.
...
...
...
...
...
...
...
...
4 2 1
2 0 0 2 H I G H E R S C H O O L C E RT I F I C AT E E X A M I N AT I O N
Earth and Environmental Science
– 9 –
140
Centre Number
Student Number
Question 17(5 marks)
The models show two types of faults associated with plate motion that can lead to mountain formation.
(a) Identify the type of plate boundary that is most likely to be associated with FaultA.
...
(b) Use labelled sketches to show the sequence of events by which structures similar to FaultBcould be produced from the relative movement of two continents.
4 1 Fault plane
Fault A Fault B
– 10 –
Marks
Question 18(7 marks)
In your Earth and Environmental Science course you completed a case study of a recent natural disaster associated with tectonic activity.
(a) Describe the tectonic movement involved in this disaster.
...
...
...
...
(b) Describe ONE type of technology that can assist in the prediction of disasters of this kind.
...
...
...
...
(c) Explain ONE method other than prediction that could be used to minimise the disastrous effects associated with this type of tectonic activity.
...
...
...
...
...
...
3 2 2 Name the natural disaster you studied ...
– 11 –
Marks
BLANK PAGE
©Board of Studies NSW 2002
– 12 –
Section I – Part B (continued)
Marks Question 19(8 marks)
The table shows the oxygen content of the atmosphere through geological time.
(a) Using the grid provided, draw a graph of oxygen content of the atmosphere through time.
(b) Identify TWO major trends in the data.
...
...
...
...
Question 19 continues on page 14
2
1000 800 600 400 200 0 (present)
Time (Ma BP)
3 0
21.0 100 24.5 200 18.9 300 35.6 400 17.3 500 19.6 600 11.4 700
4.6 800
2.1 900
1.3 1000
0.8 Time (Ma BP)
Oxygen content of atmosphere (%)
2 0 0 2 H I G H E R S C H O O L C E RT I F I C AT E E X A M I N AT I O N
Earth and Environmental Science
– 13 –
141
Centre Number
Student Number
Question 19 (continued)
(c) Explain the relationship between oxygen and ozone concentrations in the atmosphere through geological time.
...
...
...
...
...
...
...
End of Question 19
3
– 14 –
Marks
Question 20(3 marks)
The diagram shows an undisturbed rock sequence with fossils that represent stages in the evolution of a life form.
Explain how a combination of absolute and relative dating could be used to estimate the ages of the fossils.
...
...
...
...
...
...
Limestone A
Calcareous sandstone
Basalt
Limestone B
3
– 15 –
Marks
Question 21(4 marks)
In the space below, construct a table to distinguish between the features of the first land plants and those of modern plants.
4
– 16 –
Marks
©Board of Studies NSW 2002
Section I – Part B (continued)
Marks Question 22(5 marks)
Discuss the biotic changes that occurred from the late Proterozoic to the early Phanerozoic Eons.
...
...
...
...
...
...
...
...
...
...
...
...
5
2 0 0 2 H I G H E R S C H O O L C E RT I F I C AT E E X A M I N AT I O N
Earth and Environmental Science
– 17 –
142
Centre Number
Student Number
Question 23(4 marks)
Draw a flowchart to summarise the major processes and products involved in the treatment of sewage.
Question 24(4 marks)
Evaluate the features of landfill sites that need to be considered to determine their stability for liquid and/or solid waste disposal.
...
...
...
...
...
...
...
...
4 4
– 18 –
Marks
Question 25(8 marks)
Use your understanding of plate tectonics to explain the relationships between Australia’s landscape features and the characteristics of its soils.
...
...
...
...
...
...
...
...
...
...
...
...
...
...
...
...
8
– 19 –
Marks
Question 26(5 marks)
Water extracted from a mine tailings dam is treated in a four-stage treatment plant prior to release. At five points in the treatment plant (labelled T,U,V,W and X) the water is analysed for lead, dissolved oxygen content and silt.
Describe the main processes occurring during each stage in the treatment.
...
...
...
...
...
...
...
...
...
U W
V
X T
In-flow Stage A Stage B Stage C Stage D
Lead (mg/L) Dissolved oxygen (% saturation) Silt (g/L)
32.6 1.4 4.8 T
31.4 1.3 1.6 U
0.3 1.8 0.1 V
0.2 21.5 0.1 W
0.2 62.5 0.1 X
Release
Treatment point
5
– 20 –
Marks
©Board of Studies NSW 2002
Section II
25 marks
Attempt ONE question from Questions 27–30 Allow about 45 minutes for this section
Answer the question in a writing booklet. Extra writing booklets are available.
Pages Question 27 Introduced Species and the Australian Environment ... 22–23 Question 28 Organic Geology – A Non-renewable Resource ... 24–25 Question 29 Mining and the Australian Environment ... 26–27 Question 30 Oceanography ... 28–29
2 0 0 2 H I G H E R S C H O O L C E RT I F I C AT E E X A M I N AT I O N
Earth and Environmental Science
– 21 –
143
Question 27 — Introduced Species and the Australian Environment (25 marks) (a) (i) Identify ONE introduced terrestrial plant or animal that has become a
pest in Australia.
(ii) Describe ONE reason for and ONE reason against the introduction of the species identified in part (i).
(b) In your study of Introduced Species and the Australian Environment, you performed a first-hand investigation of an environment that has been affected by introduced species.
(i) Describe the method you used in your investigation.
(ii) Justify ONE conclusion based on your results.
(c) Name a plant or animal that has been introduced to Australia. Analyse the biological and physical impact of that species on the Australian environment.
Question 27 continues on page 23
5 2 2 2 1
– 22 –
Marks
Question 27 (continued)
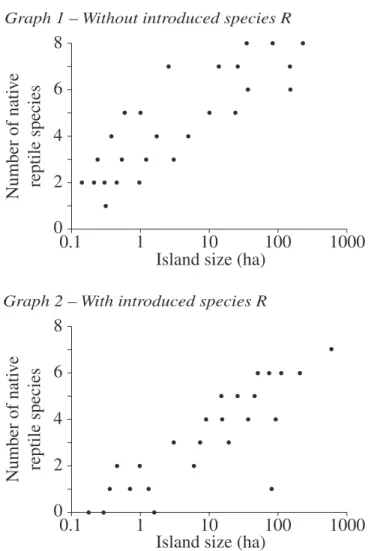
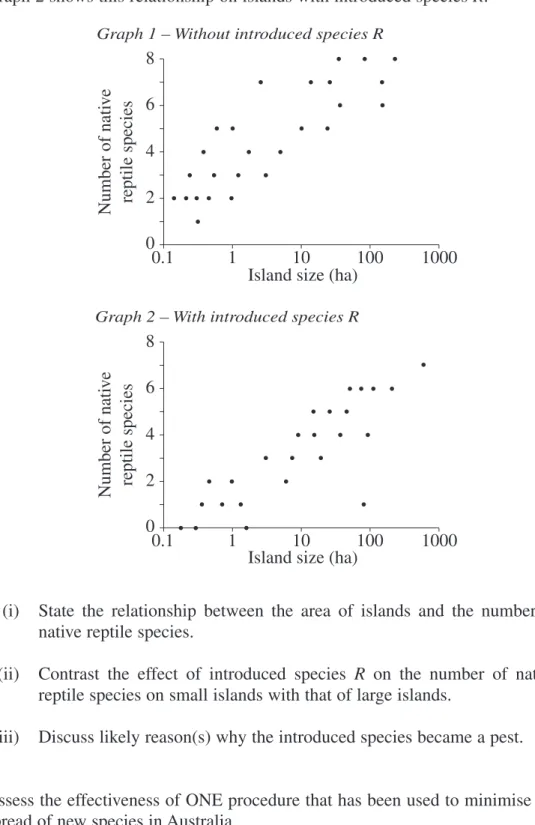
(d) The graphs show the relationship between the size of some Pacific islands and the number of native reptile species.
Graph 1 shows this relationship on islands without introduced species R.
Graph 2 shows this relationship on islands with introduced species R.
(i) State the relationship between the area of islands and the number of native reptile species.
(ii) Contrast the effect of introduced species R on the number of native reptile species on small islands with that of large islands.
(iii) Discuss likely reason(s) why the introduced species became a pest.
(e) Assess the effectiveness of ONE procedure that has been used to minimise the spread of new species in Australia.
End of Question 27
7 3 2 1 Graph 2 – With introduced species R
1 0.1
2 0 4 6 8
10 100 1000
Island size (ha) Number of native reptile speciesNumber of native reptile species
1 0.1
2 0 4 6 8
10 100 1000
Island size (ha) Graph 1 – Without introduced species R
– 23 –
Marks
Question 28 — Organic Geology – A Non-renewable Resource(25 marks) (a) (i) Identify ONE alternative to fossil fuels for electricity generation.
(ii) Describe how ONE aspect of architectural design could result in a reduction in energy consumption.
(b) In your study of Organic Geology you carried out an investigation in which you compared the properties and uses of a variety of commonly used resources.
(i) Describe the method you used in your investigation.
(ii) Justify ONE conclusion based on your results.
(c) Compare the characteristics of coal-forming environments with petroleum-forming environments.
(d) The map shows the depth from the surface of a flat-lying area to the boundary between rock layers Aand B.
Question 28 continues on page 25 720
700 680
660 640
620
960
980 1000
1020 1040 1060
X
980 Depth to the
rock boundary (m below surface)
Fault
5 2 2 2 1
– 24 –
Marks
Question 28 (continued)
The graph shows a geophysical log with information about the rocks below pointX on the map.
(i) Using the geophysical log, describe the features of the layers Aand Bin terms of their potential as cap or reservoir rocks for petroleum.
(ii) Using information from the map and the geophysical log, analyse the potential of the area for a petroleum-producing well.
(e) Assess the likely short-term and long-term effects on society of eliminating all sources of fossil fuels.
End of Question 28
7 4 2 Layer
A
B Gamma ray
Low High
Resistivity
Low High
1800 1600 1400 1200 1000 800 600 400 200 0 Depth below surface (m)
Key to interpreting geophysical log Gamma ray High for shale; low for sandstone Resistivity High for layers containing oil and gas
– 25 –
Marks
Question 29 — Mining and the Australian Environment(25 marks)
(a) (i) Identify ONE impact that mineral exploration or mining may have on the environment.
(ii) Describe an aspect of an Environmental Impact Statement that addresses the protection of endangered species for the deposit you studied.
(b) In your study of Mining and the Australian Environment you have undertaken an investigation or processed secondary data on the rehabilitation of a mining site.
(i) Describe the method used in the investigation.
(ii) Justify ONE conclusion based on the results.
(c) For a deposit you have studied, outline the relationship between the geological characteristics of a named deposit and an exploration technique that could be used to detect such a deposit.
Question 29 continues on page 27
5 2 2 2 1
– 26 –
Marks
Question 29 (continued)
(d) Mining of the Lasseter gold deposit involved an open-cut operation for the first six years followed by a further 14 years of underground mining. The graphs summarise various aspects of the operation.
(i) Describe the relationship between waste rock to ore ratio and the cost of transport during both phases of the mining operation.
(ii) Explain the variation in mine profitability over the years of mine operation.
(e) Analyse the key geological and non-geological factors involved in determining the feasibility of mining the deposit you studied.
End of Question 29
7 4 2
Open cut phase Underground phase
5 4 3 2 1 0 Waste to
ore ratio
8 6 4 2 0 Cost of transporting ore and waste rock ($/tonne) Ore grade (g/tonne)
15 10 5 0
−5
−10
−15
2 4 6 8 10 12 14 16 18 20
Year of operation Profit
($ million)
– 27 –
Marks
Question 30 — Oceanography(25 marks)
(a) (i) Identify ONE type of large-scale movement of seawater.
(ii) Describe ONE way in which the movement of seawater can be used for waste disposal.
(b) In your study of Oceanography you carried out an investigation to demonstrate the effect of surface area to volume ratio of solids on their cooling rate in water.
(i) Describe the method you used in your investigation.
(ii) Justify ONE conclusion based on your results.
(c) Explain why there are differences between organisms living on the deep ocean floor and organisms living in the upper 30 metres of the oceans.
Question 30 continues on page 29
5 2 2 2 1
– 28 –
Marks
Question 30 (continued)
(d) The diagram shows two technologies (A and B) used for collecting samples of seafloor sediment and rock.
(i) Identify both of the technologies shown in the diagram.
(ii) Evaluate the use of ONE of the above technologies in increasing knowledge and understanding about the oceans.
(e) Account for the difference between the age ranges of continental and oceanic crust in terms of the plate tectonic theory.
End of paper
7 4 2 A
B
– 29 –
Marks
BLANK PAGE
– 30 –
BLANK PAGE
– 31 –
Geological Time Scale
0 2 5 10 20 30 40 50 60 70 100 200 300 400 500 600 1000 2000 3000
4000 Hadean
Archaean
EON ERA
Oligocene Eocene Pliocene Pleistocene
EPOCH
Quaternary PERIOD
Tertiary
Cretaceous
Permian Jurassic Triassic
Devonian Silurian Ordovician
Cambrian Carboniferous
Miocene
Palaeocene
ProterozoicPhanerozoic CenozoicPalaeozoicMesozoic
Ma BP
Holocene
©Board of Studies NSW 2002
– 32 –