We would like to thank all the people who gave their time to talk to us as part of this work, in particular Nikki Johnson from New Zealand Kiwifruit Growers. Based on current annual GDP of about $308 billion, the estimated impacts represent an impact of less than half a percent of annual national GDP. The main driver of the estimated cost is the reduced efficacy of alternative chemicals currently available.
Simply put, compared to the alternatives, HC reduces the risk of lower yields and also contributes to better fruit quality in a cost-effective manner. We also include additional costs to growers because alternatives are more expensive than HC. Our estimates of potential damage are reasonably closely aligned with economic analysis prepared by NZIER for New Zealand Kiwifruit Growers in response to the call for information from the Environmental Protection Agency.
We discuss the possibility of a price response from the estimated reduction in kiwifruit supply due to the unavailability of HC in New Zealand. Using economic theory and past events, we are able to demonstrate the potential for a large offset effect for producers due to rising prices.
Introduction
Economic benefits of hydrogen cyanamide use
Uses and users of HC
Impacts of HC
Importance of HC
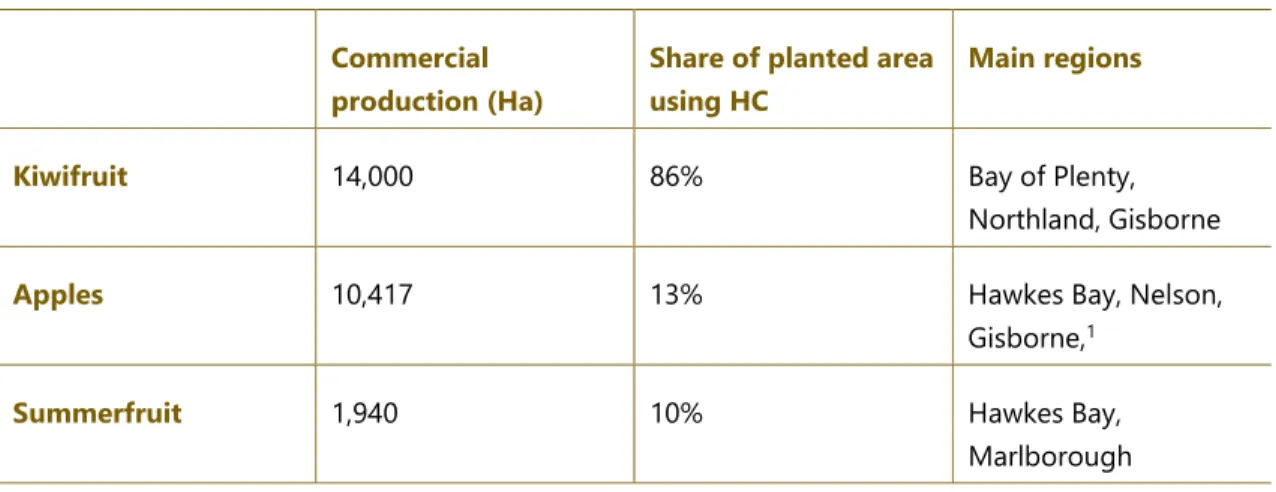
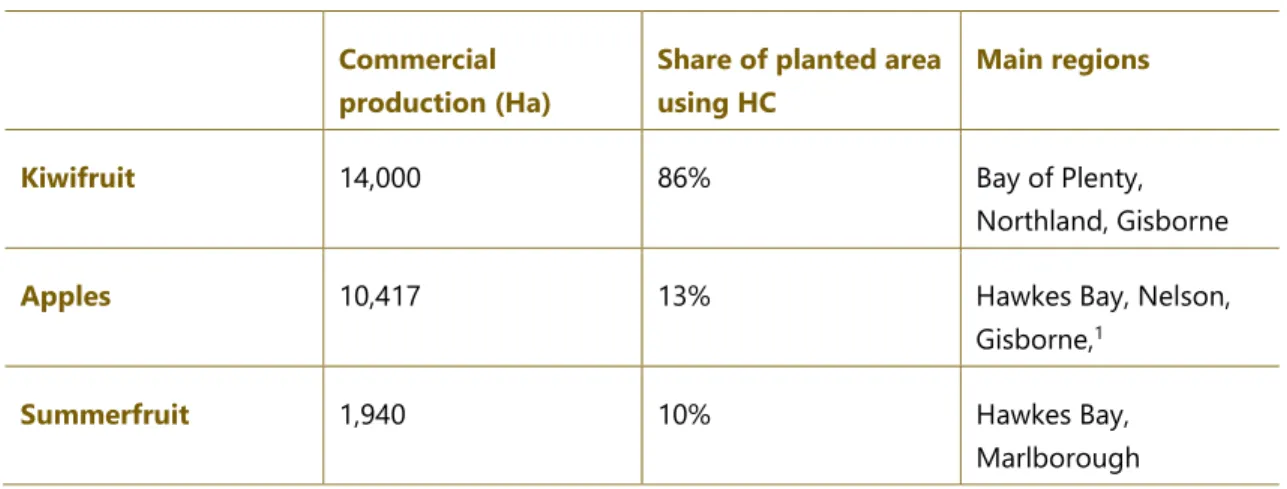
The result of meeting the above three conditions is a yield that is greater in volume and better in quality, compared to a situation where processing is not successful in one or all of the conditions. The latter refers to organic production, which should account for around four percent of the kiwi crop. Other data on packing plants and cold stores show that for some regions and varieties, the share of land in kiwifruit production represented by organic production and the use of alternative chemical products is up to about 14 percent.
Trend data and more specific data on the distribution between organic and alternative chemical use are not available. At present, we understand that only two chemical alternatives are registered under the Agricultural Compounds and Veterinary Medicines (ACVM) Act, which is required for use in New Zealand. Waiken is a trademarked product promoted by SST New Zealand as a plant growth regulator for use on papaya, stone fruit and kiwi fruit.
Advance Gold promotes Zelam to improve bud break and flowering in kiwifruit variety Gold 3. From the application examples shown, it is clear that HC is very important, especially in the case of kiwifruit, and we now turn to the question of why this is so.
Economic impact of HC use
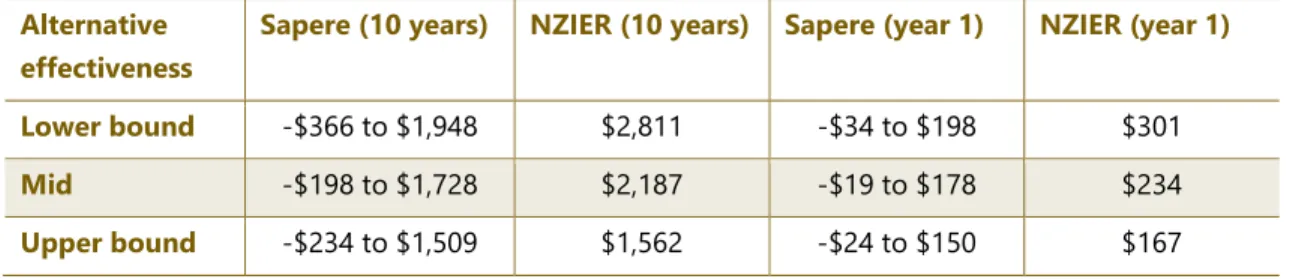
- Available report suggests impact to kiwifruit growers of $2.2 billion-$2.8 billion over ten
- The core approach we take is similar to NZIER, but there are important differences…
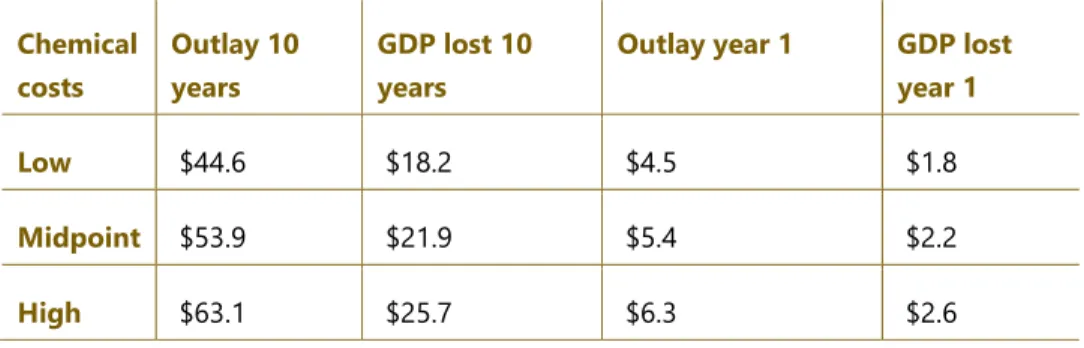
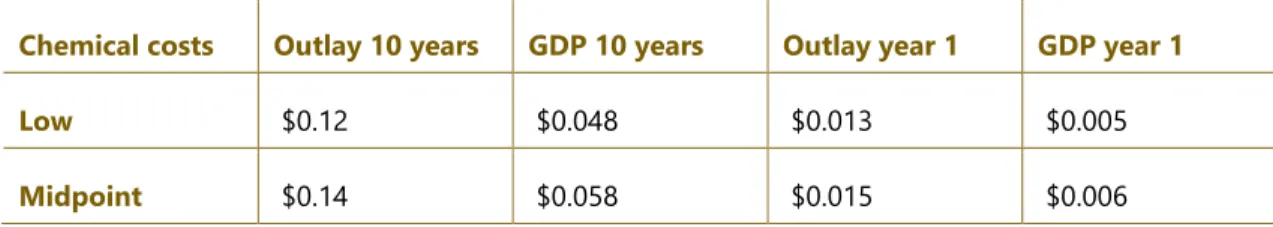
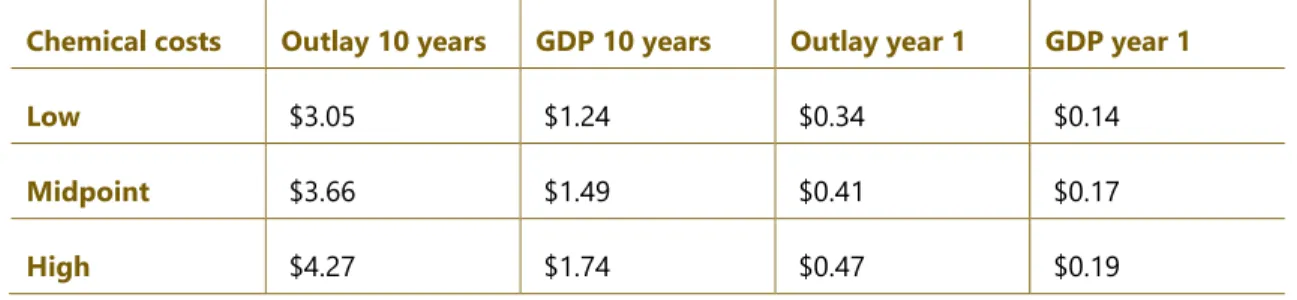
- Other fruits could see losses of $61million-$75 million across ten years
- Total costs/harms to growers are $
- Data and other limitations affect analysis
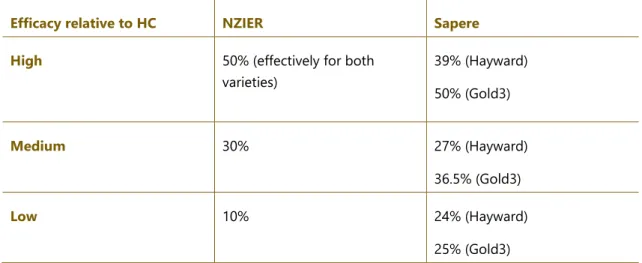
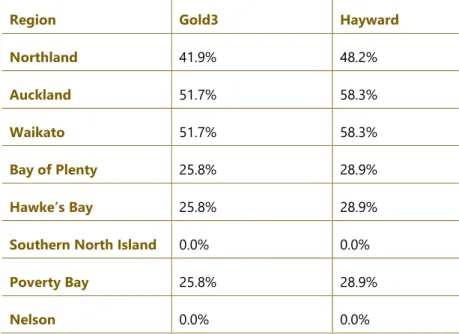
This yield improvement comes from trial data and ranges from a low of about 26 percent in Bay of Plenty, Hawke's Bay and Poverty Bay for the Gold3 variety to a high of 58 percent in Waikato for the Hayward variety.3. NZIER estimates that, based on precipitation data, alternatives are between 10 and 30 percent as effective as HC. Finally, we apply the same basic discount rate as NZIER of six percent to translate future values to today's equivalents.
In particular, the range of relative effectiveness of alternatives to HC of 10 percent to 30 percent reported as key outcomes of the NZIER is determined by rainfall alone. In the period July to August historically, NZIER calculates that the chances of a three-day free period in July and August are between 10-35 per cent in target areas, and that is the basis for the 10 per cent to 30 per cent figures. In the sensitivity analysis, NZIER considers but gives little confidence in the results using 50 per cent as the relative efficiency figure.
In terms of actual numbers, the high figure of 50 percent is a pragmatic choice. 5 While we essentially disagree because NZIER covered the 50 percent figure in the sensitivity analysis (i.e. there was no support for inclusion in the pivotal results), while we rejected the inclusion of the figure in our pivotal results for the Gold3 variant to support. The lowest reported survey data was 25 percent and 24 percent, respectively, which we used.
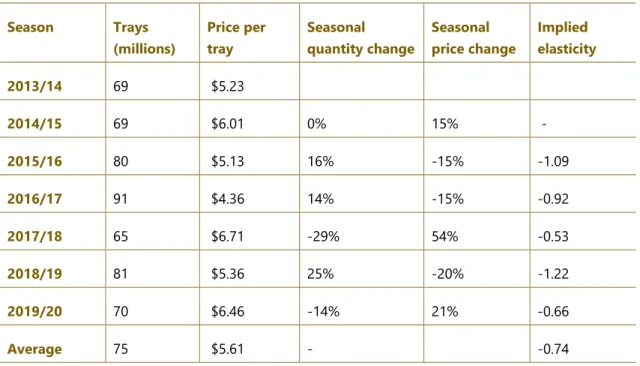
Our estimate of the reduced production volume was that HC was not available at 22 percent for Hayward and 17.5 percent for Gold3 varieties, respectively. New Zealand has a market share of almost 50 percent of the global kiwifruit export market. For an elasticity value of -0.74, a given reduction in volume of 22 percent will result in an increase in price that offsets the reduction in revenue from the decrease in volume (ie, 22 percent decrease in volume versus a 30 percent increase in price).
An effective midpoint elasticity value of -3 would result in price increases of about seven percent for Hayward varieties and about six percent for Gold3 varieties. However, the industry suggests that HC use could be over 20 percent of the national planted area (New Zealand Apples & Pears Inc., 2020). Spray logs show that alternative products are used in approximately nine percent of apple blocks nationally.
Total hectare growth for New Zealand apples over the past decade (2009 to 2019) was used to predict a compound annual growth rate of 0.5 per cent per annum (Stats NZ, 2020). Of these GDP impacts, approximately 97 percent relate to kiwifruit, with apples the second largest.
Conclusions
Re-evaluation of substances with the active ingredient hydrogen cyanamide: The costs and benefits of withdrawing hydrogen cyanamide from the New Zealand market. Call for information on the use of hydrogen cyanamide substances - Response on behalf of the New Zealand kiwifruit industry. For most primary agricultural products, New Zealand's activities are unable to affect prevailing international prices (ie New Zealand is a price taker in export markets).
However, New Zealand has an approximate 50 percent share of the global kiwifruit export market. Due to the nature of the industry there is substantial uncertainty associated with the elasticity parameters and a large range is presented in seasonal data and literature.8. Export elasticities measure the responsiveness of the demand for a country's exports to a change in the world price.
In particular the reduction from a record production of 90 million trays in the 2016/17 season, to 65 million trays in the 2017/18 season, we match this with the reported price per tray. Also worth mentioning is the impact of a frost event in Chile on the price per tray in the 2014/15.9 season. This shows that the share of New Zealand's production in the world export market is important enough to affect world prices.
Trade data over the past seven seasons for the top five kiwifruit exporting countries shows that New Zealand's production has a greater share of value than quantity. The recent increase in the spread is likely attributable to the shift to the Gold3 variety commanding higher prices. At the time it was reported that an estimated 50 percent reduction in Chilean supply created a global shortage of green kiwifruit and contributed to New Zealand growers receiving higher prices (Hutching, 2014).
9 “The 2014/15 season was exceptional due to the shortage of Chilean kiwi fruit in the market, following a severe frost event in Chile. This shortage – coupled with strong end-of-season sales and good work from growers, the post-harvest sector, the Zespri team on land and in the markets, and our retail and trade partners – has made for a strong season for Zespri Kiwifruit mean. We examine and report the impact of elasticities in the range -0.74 to -5, which represents a useful range for our purposes.