Sampling error is expressed as the root mean square error (RMSE) in percent of the mean of the mean pig weight of all groups. Frequency distribution with nested normal distribution of mean true pig weights of 129 individual herds of breeder pigs weaned between December 2001 and June 2004. Frequency distribution with nested normal distribution of mean true pig weights of 129 of individual herds of last weaned pigs between December 2001 and June 2004.
For finisher groups with more than eight pens, true mean pig weight was derived using data from eight randomly selected pens. The mean sampling error of all groups is expressed as the root-mean-square error in percentage of the mean of mean pig weight of all groups.
6B Introduction
An effective monitoring system offers several opportunities to optimize profit in the growing pig herd. The growing herd has a major impact on overall farm profitability (Holtkamp, 1999), which can be explained by the high proportion of feed costs spent in this production unit. Therefore, accurate decision making may be even more important in the growing herd than in the breeding herd.
More than half of the sites had no information on growth rate (56% of sites) or feed efficiency (62% of sites) for the growing herd, while the rest of the sites provided estimates. This may indicate differences in the ease of data collection and interpretation of records between the growing and breeding herds.
7B Literature Review
Two problem areas have been repeatedly linked to the underuse of performance monitoring in the growing herd (Deen, 1994; Radostits, 2001; Dial and Rademacher, 2005). Classic performance indicators in a growing herd are growth rate, feed efficiency and mortality rate. Errors in the cumulative number of pig days occur when pig movements are not accurately tracked.
The depth of back fat is a useful indicator of the lean tissue content of the pig (Hulsegge et al., 2000). This review has provided an overview of the monitoring process in the growing pig herd and the causes of errors in pig weight registration.
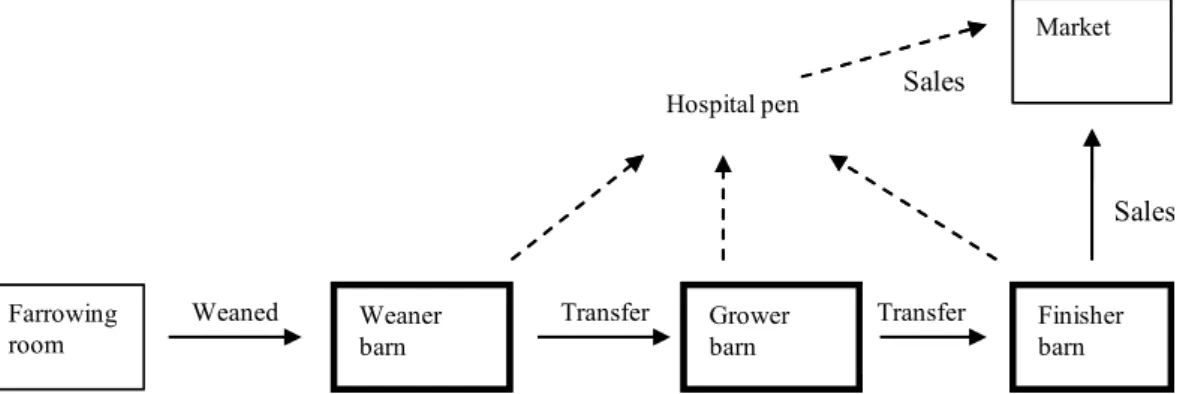
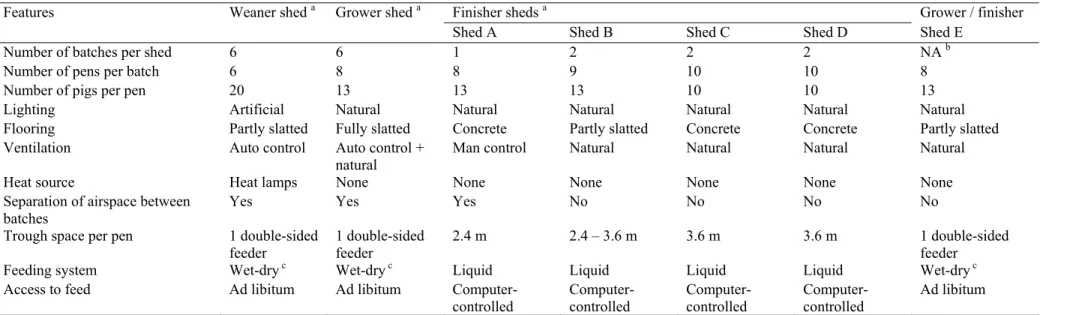
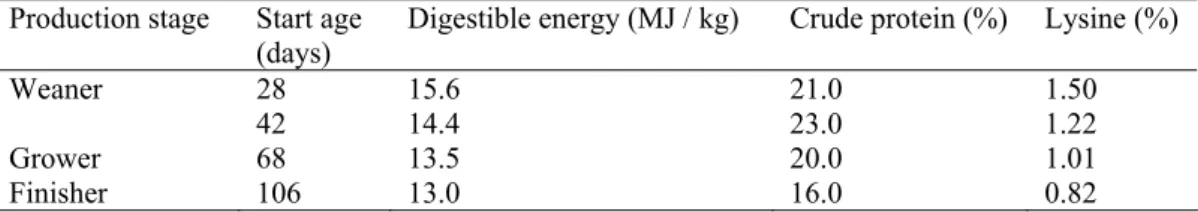
8B Description of the study farm
At weaning, most of the weaned piglets entered the weaning quarters, while the lightest weaned piglets were moved to a special rearing area. Pigs that went directly to the weaners were managed as weaners for 40 days, 38 days for growing and about four weeks until marketing. Pigs from a special breeding location re-entered the batch production system during the weaning or rearing phase by joining a group of pigs that were weaned one to two weeks later.
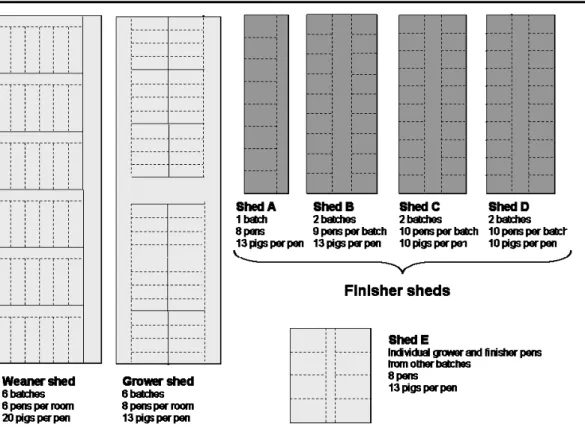
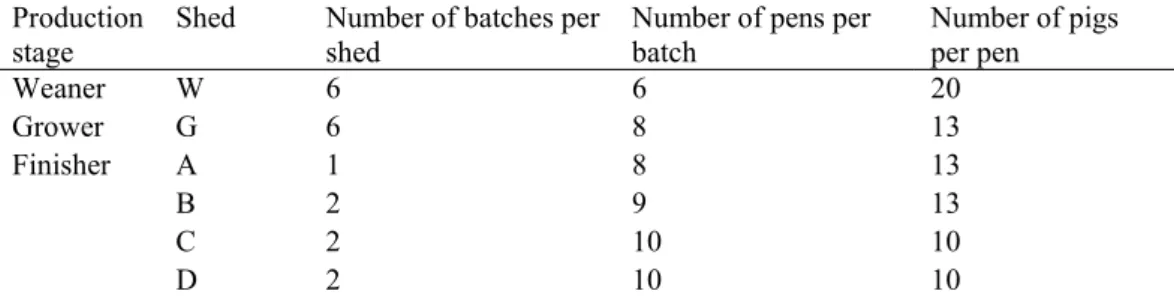
The capacity of the weaning barns (120 pigs per lot) was higher than that of the growing and finishing barns (100 to 117 pigs per lot). If there were excess pigs during the transfer from the weaning barn to the rearing barn, they were placed in an alternative barn (barn E). It was routine for farm management to assign pigs to pens in the following manner: at weaning, pigs were sized to match littermates.
The remaining pigs were moved to pens in the next production stage as one group. Piglets and breeding pigs were fed ad libitum from a double-sided wet-dry feeder. Pigs housed in barn E were fed ad libitum from a double-sided wet-dry automatic feeder.
All grower pens were weighed three days after pigs were transferred from the weanling to the grower pen. Weights for finishing cages were recorded at the time of transfer from the producer to the finishing shed. Pigs were fed ad libitum (light shaded sheds) or via a computerized liquid feeding system (dark shaded sheds).
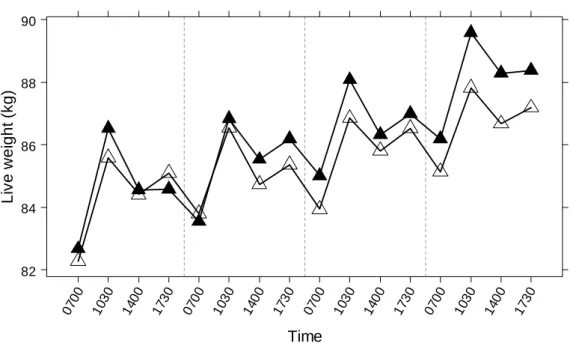
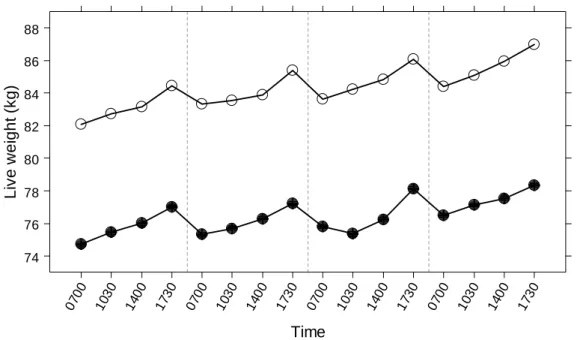
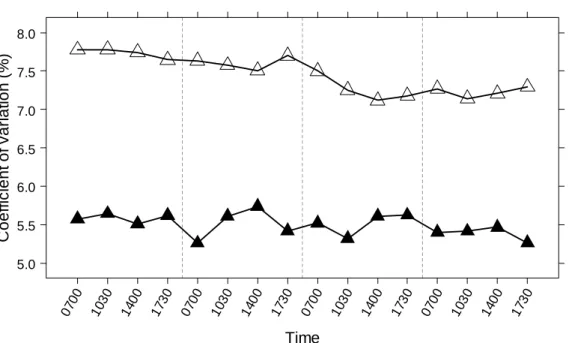
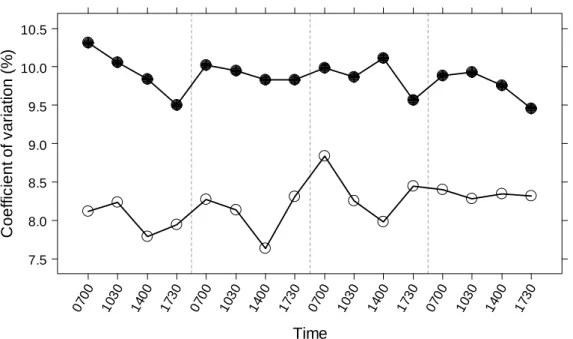
9B Diurnal fluctuations in live weight as a potential cause for variability in weight records
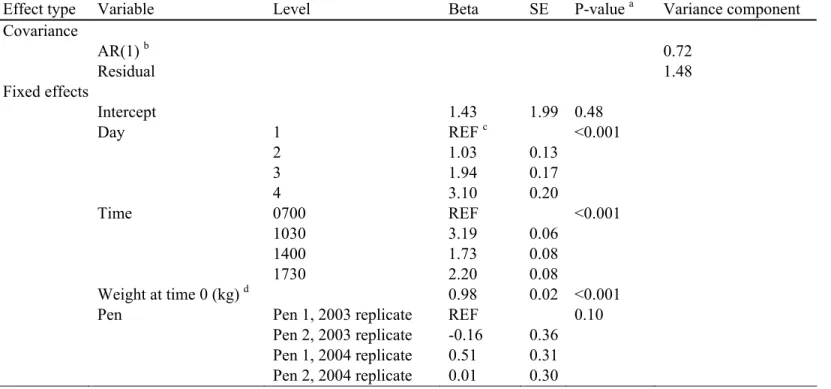
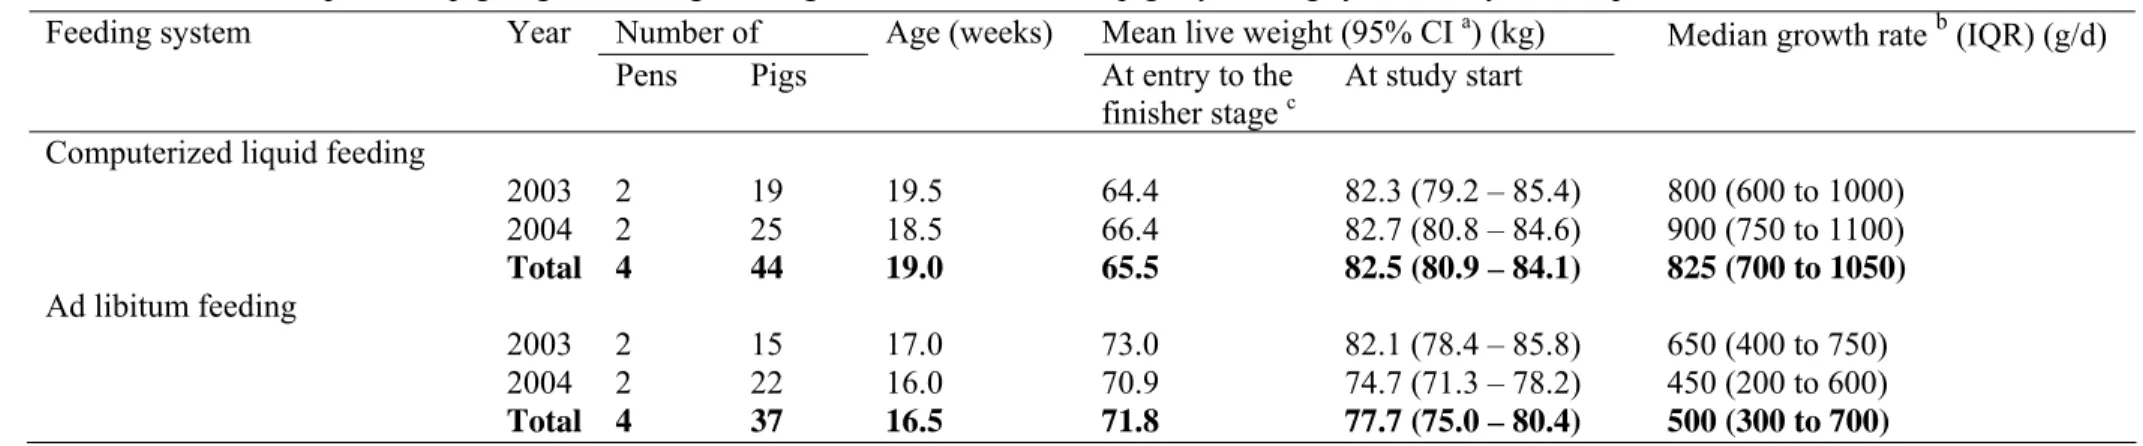
Daily fluctuations in the mean weight of the pigs in the CL group were consistent with the time of feed delivery, while the mean weight of the pigs in the AL group steadily increased during the day and decreased at night. Fixed effects in the model were day, time, pen, gender and starting weight. The 2003 replica had six fewer pigs in the CL group and seven fewer pigs in the AL group than the 2004 replica.
In both years, pigs in the CL group were two to three weeks older than pigs in the AL group. Furthermore, pigs in the 2003 replicate were one week older than pigs of the same group in the 2004 replicate. In contrast to pigs in the CL group, the average weight of pigs in the AL group increased steadily throughout the day and then settled down at night.
The maximum range in CV on a single day was 0.4% for pigs in the CL group and 0.8% for pigs in the AL group. The effect of time of day varied between pens of the CL group (XFigure 4.6X) For pigs in the AL group, the effect of starting weight on predicted weight differed between pens as illustrated in XFigure 4.8X. In contrast, mean weight in the AL group increased steadily throughout the day and decreased overnight.
Although pigs in the CL group were housed in different houses, the variable coding for pen was not significant for the CL group. The effect of time of day varied more between days for pigs in the AL group than for pigs in the CL group. The observed difference in weight change patterns between feeding systems was consistent with the feed release in the CL group and the expected feed intake pattern of pigs in the AL group.
10B Effect of feed withdrawal on between-pig variation in live weight and average daily gain
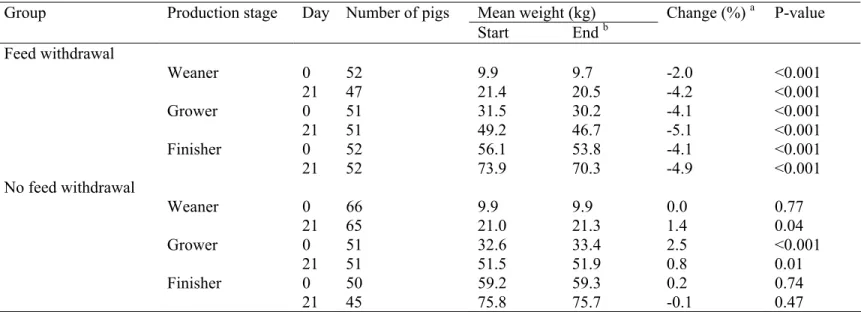
OBJECTIVE: To investigate whether overnight feed withdrawal is effective in reducing the difference between pigs in live weight and average daily gain. CONCLUSION: The results show that overnight feed withdrawal is effective in reducing differences in pig live weight and average daily gain of grower and finisher pigs. However, no study has specifically assessed the effect of feed deprivation on live weight variability.
In this chapter, the hypothesis that overnight feed withdrawal can be effective in reducing differences in live weight and average daily gain between pigs was tested. In growing and finishing pigs, feed withdrawal was associated with a 4.0% to 11.1% reduction in live weight variability (XTable 5.3X). In weaned pigs, the effect of feed withdrawal on live weight variability and ADG was inconsistent.
To the author's knowledge, this was the first study to test the effect of feed deprivation on differences in live weight and average daily gain among pigs. These results support the hypothesis that feed withdrawal can be effective in reducing variability in live weight and average daily gain. In contrast, the effect of feed withdrawal on live weight variability and mean daily gain was inconsistent in weaned pigs.
The results presented suggest that feed withdrawal can be implemented as a routine management strategy to reduce variation among pigs in live weight and average daily gain. First, the effect of food withdrawal on variability in live weight and average daily gain was inconsistent in this age group. In conclusion, the results show that feed withdrawal at night is effective in reducing variation among pigs in live weight and average daily gain of grower and finisher pigs.
11B Effect of sample size and sampling method on sampling error when sampling pens of grower and
The true average weight of the pigs of each batch was calculated as the average weight of the pigs for all eight pens. For each sample, the estimated average weight of the pigs of each lot was calculated as the average weight of the pigs of the selected pens. When selecting pens by weight, all pens within a lot were ranked according to their average pig weight.
The true average pig weight for an individual lot was calculated by dividing the total weight for all eight pens by the total number of pigs in those pens. Variation between pens in average pig weight within a batch was expressed as the coefficient of variation in average pig weight of pens within batch i (CVi). Scatterplots of true mean pig weight versus estimated mean pig weight were produced for the first of the five replicates of random sampling stratified by sample size.
The root mean square error was expressed as a percentage of the mean weight of pigs of all batches (% RMSE). The linear long-term trend in the intra-batch coefficient of variation (CVi) of the average pen weight of pigs was not significant for either breeder (P = 0.26) or finishing group (P = 0.21). ANOVA results for the effect of pig culling on the within-lot coefficient of variation of the mean weight of pigs in the stalls of 129 pig lots at the end.
Scatterplots of actual mean pig weight versus estimated mean pig weight of 129 breeding pig lots from purposive sampling of two out of eight pens. Scatterplots of actual average pig weight versus estimated average pig weight of 129 batches of finishing pigs after purposive sampling of two of eight pens. Sampling error was estimated directly by calculating the root mean square error (RMSE) between the true mean weight of pigs (μ) and the estimated mean weight of pigs in the selected pens (y.
12B General discussion
34;Weighing affects short-term feeding patterns of growing and finishing pigs." Canadian Journal of Animal Science. 34;Effects of processed barley on growth performance and ileal digestibility of growing pigs." Asian-Australian Journal of Animal Sciences. 34; Effect of variations in dietary protein and space allocation on performance and carcass quality of growing and finishing pigs." Journal of Animal Science.
34; Growth performance and whole body composition of pigs experimentally infected with Mycoplasma hyopneumoniae." Journal Of Animal Science. 34; Effects of feeder type, space allowance and mixing on growth performance and feed intake pattern of growing pigs ." Journal Of Animal Science.
34;Effect of group size and feeder type on growth performance and feeding patterns in growing pigs." Journal of Animal Science. 34;Effect of group size and feeder type on growth performance and feeding patterns in fattening pigs." Journal of Animal Science. The Effects of Warm Daily Temperature on Average Daily Gain, Feed Intake, and Feed Efficiency." Journal of Animal Science.
Effects of a cold, daily temperature on average daily gain, feed intake and feed efficiency." Journal Of Animal Science. 34; The effects of split marketing on the physiology, behavior and performance of fattening pigs." Journal of Animal Science. 34; The effects of regrouping on behavioral and production parameters in finishing pigs.” Journal of Animal Science.