WORKING PAPERS IN ECONOMICS AND FINANCE
School of Economics and Finance | Victoria Business School | www.victoria.ac.nz/sef
Opportunity from disaster:
Evidence of the Christchurch earthquake’s effects on high schoolers’ post-graduation outcomes
Harold E Cuffe and Olivia Wills
SEF WORKING PAPER 10/2018
SEF WORKING PAPER 8/2018
The Working Paper series is published by the School of Economics and Finance to provide staff and research students the opportunity to expose their research to a wider audience. The opinions and views expressed in these papers are not necessarily reflective of views held by the school. Comments and feedback from readers would be welcomed by the author(s).
Further enquiries to:
The Administrator
School of Economics and Finance Victoria University of Wellington P O Box 600
Wellington 6140 New Zealand
Phone: +64 4 463 5353 Email: alice.fong@vuw.ac.nz
Working Paper 10/2018 ISSN 2230-259X (Print) ISSN 2230-2603 (Online)
1 Opportunity from disaster: Evidence of the Christchurch Earthquake’s effects on high
schoolers’ post-graduation outcomes
By Harold E. Cuffe† and Olivia Wills‡
Access to the anonymised data used in this study was provided by Statistics New Zealand in accordance with security and confidentiality provisions of the Statistics Act 1975. The findings are not Official Statistics. The results in this paper are the work of the authors, not Statistics NZ nor the Ministry of Education, and have been confidentialised to protect individuals from identification. The results are based in part on tax data supplied by Inland Revenue to Statistics NZ under the Tax Administration Act 1994. This tax data must be used only for statistical purposes, and no individual information may be published or disclosed in any other form, or provided to Inland Revenue for administrative or regulatory purposes. Any person who has had access to the unit record data has certified that they have been shown, have read, and have understood section 81 of the Tax Administration Act 1994, which relates to secrecy. Any discussion of data limitations or weaknesses is in the context of using the IDI for statistical purposes, and is not related to the data’s ability to support Inland Revenue’s core operational requirements.
Abstract: We estimate the causal effects of a large unanticipated natural disaster on high schoolers’ university enrolment decisions and subsequent medium-term labour market outcomes. Using national administrative data after a destructive earthquake in New Zealand, we estimate that the disaster raises tertiary education enrolment of recent high school graduates by 6.1 percentage points. The effects are most pronounced for males, students who are academically weak relative to their peers, and students from schools directly damaged by the disaster. As relatively low ability males are overrepresented in sectors of the labour market helped by the earthquake, greater demand for university may stem from permanent changes in deeper behavioural parameters such as risk aversion or time preference, rather than as a coping response to poor economic opportunities.
Natural disasters are a major threat to the global population. Between 1998 and 2017, weather or geo-physical disasters killed 1.3 million people and left a further 4.4 billion injured, homeless, displaced or needing emergency assistance (UNISDR, 2018). As climate change causes weather patterns to become more extreme, super-storms, hurricanes and wildfires will occur with increasing frequency and severity, posing a threat to an ever-growing proportion of people in both developed and developing countries (Cavallo and Noy, 2009). For example, in the USA there have been eleven weather and climate disaster events with losses greater than USD$1 billion each in the first ten months of 2018 alone (NCEI, 2018). These events include a drought, severe storms, tropical cyclones, a wildfire and winter storms. Given the anticipated increase in extreme weather events, the economic and social outcomes of disasters pose a major public policy concern. Despite this gloomy outlook, current research suggests that some
† Corresponding author: Harold.Cuffe@vuw.ac.nz
‡ Olivia.Wills@vuw.ac.nz
2 victims of disasters may experience positive long term effects, at least along certain economic margins. In a recent paper, Deryugina, Kawano and Levitt (2018) find that Hurricane Katrina imparts long term positive effects on victims’ incomes. Although unable to test the hypothesis, the authors propose that disasters may affect individuals in more fundamental ways, possibly altering their personal values, identities, or levels of risk aversion. The authors posit that increased educational investment may be one consequence of these disaster-related changes.
We estimate the causal effects of a large but unforeseen natural disaster on university enrolment decisions and medium term labour market outcomes. To do so, we consider a 2011 earthquake in New Zealand which caused significant property damage and killed nearly 200 people. We use national administrative tax and education microdata covering the entire population to retrieve the direct effects on enrolment, and estimate the medium-term effects on earnings and other economic outcomes four years after high school graduation. Callen (2015) argues that selective exposure to disaster, and selective migration away from affected areas may bias estimates of causal effects. Because the earthquake struck an area previously thought to have low earthquake-risk, we argue that the disaster provides a natural experiment for estimating causal effects and avoids selection into exposure. We are also careful to identify using administrative tax and education data all individuals attending schools in the affected region at the time of the disaster. Following people who move because of the disaster eliminates potential estimation bias from selective migration.
In our main empirical strategy, we compare tertiary enrolment for school leavers from damaged and undamaged schools in the region, and from schools in the rest of the country, before and after the event. We use a distributed lag specification to identify how the effects change over time, and consider whether the effects differ by gender and academic ability. Our results are in line with the hypothesis suggested by Deryugina, Kawano and Levitt (2018) that disasters increase investment in education. We estimate that disasters raise tertiary education enrolment of recent high school graduates by 6.1 percentage points. Further, we find the
3 effects are most pronounced for males, relatively lower academic ability students, and students from schools directly damaged by the disaster.
Our findings sit within a growing literature studying the effects of destructive natural disasters in developed countries. Sacerdote (2012) investigates the impact of Hurricane Katrina on long- term academic performance and college going for evacuated high school students, and finds New Orleans evacuees experience a 4.2 percentage point decline in attending any college, but suburban evacuees see increased enrolment by up to 3.4 percentage points. Sacerdote hypothesises the decline could be due to disrupted links between local community colleges and schools, and the increase may be due to altered labour market options, but is unable to test these mechanisms.
Research on the impact of other disasters on education outcomes includes Holmes (2002), which finds that extreme storms in North Carolina have a negative impact on the test scores of elementary school students. Pietro (2018) analyses the impact of an earthquake in Italy, and finds that experiencing the disaster increases the probability that university students do not graduate on time. However, Doyle et al. (2017) find that hardship for university students caused by Superstorm Sandy, including days without power, days of teaching missed and displacement, has no relationship with academic achievement. They suggest this result may be because university students are insulated from the worst effects of disaster, since they typically do not own their homes and the university can provide support in the aftermath. While we study the effects of an earthquake, our findings are relevant to the wider disaster literature, and contribute to a policy response which will be increasingly necessary over the coming years.
Literature on labour market conditions and human capital accumulation is also relevant to our research. This literature tends to focus on the relationship between the unemployment rate and post-compulsory education uptake, and the impact of the economy at university graduation on long term labour market outcomes. Clark (2011) finds that a poor labour market increases enrolment in further education, and Adamopoulou and Tanzi (2017) find a recession
4 reduces university drop-out rates. To the extent that the earthquake produces different expected labour market conditions for different high school graduates, this literature suggests university enrolment may move up or down.
There is evidence that a poor economy when graduating from university can affect wages in the long term. Using a US sample of college leavers, Kahn (2010) finds negative wage effects for students graduating in a bad economy, which persist over time. Similarly, Oreopoulos et al. (2012) find that students graduating during a recession suffer persistent wage losses for ten years. While labour market conditions following a disaster are different to macroeconomic downturns, this research demonstrates that impacts on wage may persist over time, even after the labour market has recovered.
Little is known about the impact of the New Zealand disaster on academic performance, in large part because of prior data limitations. One source of information previously used is the New Zealand Ministry of Education records, which include school rolls, average school leaving and the percentage of students leaving school without formal qualifications. The only study to use these data (Beaglehole et al., 2017) finds the earthquake has no impact on early secondary school leaving or academic performance. This is an important finding, as it suggests that changes in university going rates do not accrue through changes in who graduates from high school. However, relying on aggregate data severely limits what can be said about the effects of the disaster on high school students. First, school- and district-level data obscure crucial heterogeneity in the effects of natural disasters, namely that low ability men appear much more responsive than their higher ability peers. Second, aggregate data is ill equipped to account for the significant migration that occurred in response to the earthquake. Finally, the aggregate data do not allow researchers to follow students after graduation to assess the impacts on university matriculation and labour market outcomes. The administrative microdata used in the present study remove these limitations.
5 Background
The Christchurch earthquake
Earthquakes are a known risk in New Zealand, which sits on several major fault lines.
However, prior to the disaster, public attention was focused on preparing for the seismically
‘overdue’ Alpine Fault rupture, and on improving resilience in the earthquake-prone capital city. Therefore, it was entirely unexpected when, on 4 September 2010 at 4.35am, a large earthquake of magnitude 7.1 occurred in Canterbury, an area which had not been shaken in over fifty years. The Canterbury region spans the east coast of New Zealand’s South Island, and includes Christchurch, which was the second largest city in New Zealand at the time of the disaster. Christchurch had a population of 386,000; for comparison with work on Hurricane Katrina, this is about 7,000 fewer residents than present day New Orleans.
The quake occurred when residents were away from Christchurch’s high-rise city centre, causing severe structural damage but few casualties. The earthquake was followed by several major aftershocks in the subsequent months. On 22 February 2011, the most destructive seismic activity in the series of tremors occurred when an aftershock of magnitude 6.3 struck within ten kilometres of the downtown area. This aftershock, termed the 2011 Christchurch Earthquake, occurred on a weekday at 12.51pm, when the city centre was at its busiest. With infrastructure already weakened, the tremor caused several buildings to collapse, killing 185 people and injuring thousands more.
Residents and the local government were unprepared for the scale of the disaster.
Liquefaction, a process which temporarily turns solid ground to liquid, caused widespread damage to the city, burying streets and causing buildings to sink. Underground infrastructure was damaged, resulting in lifeline failure and untreated sewage flowing into waterways. The disaster damaged over 150,000 houses, which is nearly three quarters of the housing stock in the region. A “red zone” of buildings to be demolished included over 7,500 houses. This damage to housing is of comparable magnitude to Hurricane Katrina, which destroyed 200,000 homes (Deryugina et al, 2018).
6 In the months and years after the earthquake, residents continued to face serious hardship.
The Earthquake Commission (EQC), a state-run organisation, managed disaster insurance pay-outs. The number of claims exceeded 750,000, twice the amount EQC expected from a
‘worst foreseeable event’ (King et al., 2014). Complications around which tremor caused the damage, and ambiguities over the extent of cover, caused severe delays in insurance payments (Potter et al., 2015). For some households, the insurance settlement process is still ongoing in 2018, seven years after the event.
The earthquake caused extensive damage to schools. Eighteen schools were relocated, and 7,000 students were bussed daily to host sites. 55% of high school students were ‘site sharing’, with one school holding classes in the mornings and another school holding classes in the afternoons (Potter et al., 2015). Over 12,000 school students left their school and enrolled elsewhere, including at schools outside the region, although most of these students returned within the year. First year enrolments at the local University of Canterbury decreased by 28% compared to 2010 (Canterbury DHB, 2016).
Overall, the Reserve Bank of New Zealand estimates the rebuild costs to be US$15 billion, 10% of GDP (Parker and Steenkamp, 2012). The disaster was entirely unexpected and caused severe damage and disruption to daily life in the region.
Education in New Zealand
In order to assess the generalisability of our results, it is important to understand the educational context of New Zealand high school students. 85% of secondary school-aged children attend state schools, and 11% attend state integrated schools, which operate as a state school but with the religious or learning philosophy of the owner. The remaining 4%
attend private or boarding schools. We restrict our analysis to all students from state or integrated schools, because private schools tend to offer alternative international assessment methods.
7 The New Zealand school year runs from February to December. Therefore, the less destructive 2010 earthquake occurred near the end of the school year, around when students began end-of-year testing, whereas the 2011 earthquake was at the start, exposing the graduating class of 2011 to an entire academic year of hardship and recovery.
Secondary school typically runs from Year 9 to Year 13, with students entering between ages 12 – 13 and leaving between ages 17 – 18. Schooling is compulsory until age 16, but most students remain in school to complete Year 13. For perspective, in 2017 only 16.5% students dropped out of school early (Ministry of Education, 2017). We may be concerned that student attrition is affected by the disaster; however, previous research on the Canterbury earthquake finds no evidence of an impact on early school leaving (Beaglehole et al., 2017). We find the earthquake does not affect the probability of early school leaving for students enrolled in damaged schools at the time of the earthquake, but somewhat increases early school leaving for students from undamaged schools in the region. This detail is important when interpreting the results, as it supports that the composition of high school seniors remains unchanged following the earthquake in damaged schools. Hence, we believe changes in university enrolment occur because of increased demand for tertiary education by students from these schools who otherwise would not attend university.
In Years 11, 12 and 13, students work towards the ‘National Certificate of Educational Achievement’ (NCEA) qualification Levels 1, 2 and 3 respectively. Students gain credits for
‘standards’ throughout the year, assessed through assignments and exams, which contribute to the award at each level. The minimum requirement to enter university is achievement of the
‘University Entrance’ (UE) qualification. This qualification consists of achieving NCEA Level 3 including credits for certain literacy and numeracy standards. To assess whether an impact on high school achievement is a potential channel through which enrolment increases, we study whether the disaster affects the UE attainment rate.
There are eight public universities and sixteen public polytechnics in New Zealand, which cover 85% of formal tertiary study in the country (Ministry of Education, 2018). A Bachelor’s
8 degree typically takes three years to complete. The Canterbury region includes two universities; the University of Canterbury and Lincoln University. There is one main polytechnic and four others with a campus in the region. We investigate whether the student’s choice of university is affected by the disaster. Evidence of a decrease in Canterbury high school graduates enrolling in the local area is consistent with high school students leaving the city following the disaster. While this may reflect a deliberate strategy by students to move from the Canterbury region, it might also reflect the migration patterns of their parents prior to high school graduation, or an intention to pursue studies no longer offered in the area.
Overall, the educational context is similar to most developed countries. High school students are examined between the ages of 16 – 18, and gain entry to tertiary education based on these results. There are some unique aspects of education in New Zealand; for example the use of a binary achievement ‘University Entrance’ to be considered for university admittance, and a predominantly state-funded tertiary education. However, these are not fundamental differences, given that tertiary education still requires a competitive admissions process. A final distinct quality of New Zealand education is the relatively low cost of university, with accessible loans and allowances for all students, which might make the decision to enrol more likely for students on the margin, relative to individuals in other countries. However, there are no substantial changes in fees or loan access during the years of our analysis, so we cannot attribute our estimated effects to policy change.
Data
We draw data from the Integrated Data Infrastructure (IDI), a large research database containing detailed administrative data on all New Zealanders, linked at the individual level.
We use school enrolment data to identify students in Year 13 (i.e., their senior year) as those who take NCEA Level 3 between the years 2008 and 2013, aged 17-19. While this criteria does not identify all students enrolled in Year 13, because students are not required to participate in NCEA assessment, it effectively captures the majority of students in the cohort.
We restrict analysis to these years as they contain complete information about school
9 enrolment, and allow enough years after school completion for most tertiary decisions to be made and recorded in the data. We define the ‘treatment group’ as students who either graduate from a Canterbury high school prior to the disaster, or are enrolled in a high school in the Canterbury region at the date of the earthquake, 22nd February 2011. Under this definition, we are careful to include individuals who migrated away from Canterbury in response to the disaster. If we instead define treatment as only having graduated from a Canterbury high school, we may falsely attribute a compositional change in the remaining population of Canterbury to the effects of the disaster. For example, if the Canterbury students who move to a different region following the disaster are also more likely to enrol in university, defining this group as ‘control’ would understate the true positive effect.
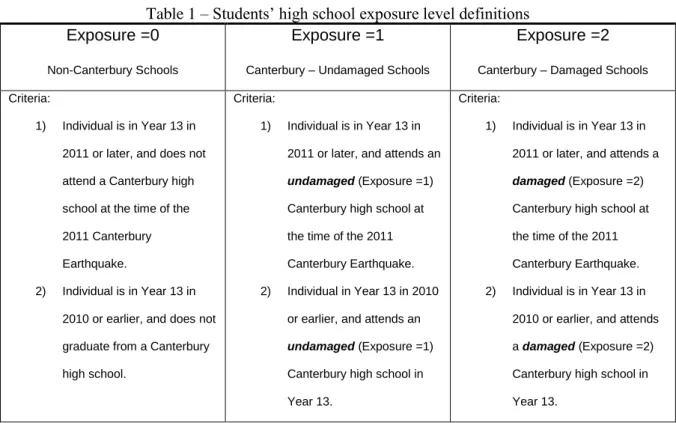
We divide all students into one of three categories based upon geography and the extent of disaster-related damage their high school sustained. School exposure to the disaster is determined using categorisation of ground movement and area damage found in Potter et al.
(2015). We assign high schools to one of three levels of exposure; not in Canterbury = 0; in the region but not damaged = 1; or in the region and damaged = 2.1 Table 1 gives the criteria for each student’s Exposure value based upon his or her high school.
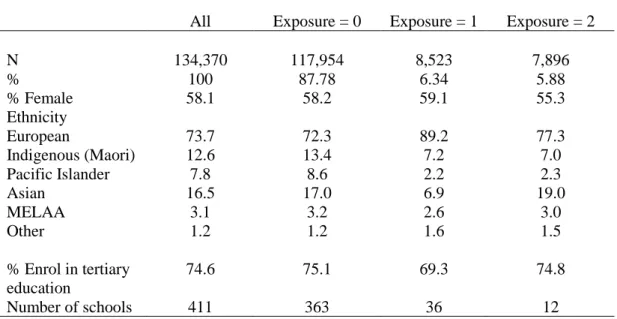
The resulting sample captures 134,370 Year 13 students at state or integrated schools in New Zealand from 2008 – 2013. Table 2 shows summary statistics for the whole sample, and are broken down by level of exposure to the disaster. In line with data use requirements, counts are randomly rounded to base three. Overall, 58% are female, which is in line with an observed gender gap in high school completion (Ministry of Education, 2017). 6.3% of the sample attend undamaged schools in Canterbury, and 5.9% attend damaged schools in Canterbury. 74.6%
enrol in tertiary education within three years of leaving school. Indicators for ethnicity are not mutually exclusive. 74% of the sample is European, 12.6% is Maori, and 16.5% Asian.
1 This category is aggregated medium and high damage used by Potter et al (2015).
10 Students from undamaged schools in the region are in general less likely to enrol in tertiary education than the other groups.
Table 1 – Students’ high school exposure level definitions Exposure =0
Non-Canterbury Schools
Exposure =1
Canterbury – Undamaged Schools
Exposure =2
Canterbury – Damaged Schools Criteria:
1) Individual is in Year 13 in 2011 or later, and does not attend a Canterbury high school at the time of the 2011 Canterbury Earthquake.
2) Individual is in Year 13 in 2010 or earlier, and does not graduate from a Canterbury high school.
Criteria:
1) Individual is in Year 13 in 2011 or later, and attends an undamaged (Exposure =1)
Canterbury high school at the time of the 2011 Canterbury Earthquake.
2) Individual in Year 13 in 2010 or earlier, and attends an undamaged (Exposure =1)
Canterbury high school in Year 13.
Criteria:
1) Individual is in Year 13 in 2011 or later, and attends a damaged (Exposure =2)
Canterbury high school at the time of the 2011 Canterbury Earthquake.
2) Individual is in Year 13 in 2010 or earlier, and attends a damaged (Exposure =2) Canterbury high school in Year 13.
Table 2 – Summary statistics for Year 13 students 2008 – 2013
All Exposure = 0 Exposure = 1 Exposure = 2
N 134,370 117,954 8,523 7,896
% 100 87.78 6.34 5.88
% Female 58.1 58.2 59.1 55.3
Ethnicity
European 73.7 72.3 89.2 77.3
Indigenous (Maori) 12.6 13.4 7.2 7.0
Pacific Islander 7.8 8.6 2.2 2.3
Asian 16.5 17.0 6.9 19.0
MELAA 3.1 3.2 2.6 3.0
Other 1.2 1.2 1.6 1.5
% Enrol in tertiary education
74.6 75.1 69.3 74.8
Number of schools 411 363 36 12
11 The secondary school enrolment dataset includes information on the specific school attended, location, dates enrolled, and qualifications achieved. The tertiary enrolment data includes specific institution and campus location, date enrolled, degree title and individual course registration. We investigate medium-term earnings and labour market outcomes using individual tax returns. Using this data, we can distinguish between wages and benefit payments.
Identification strategy
In the simplest OLS specification, we investigate how the tertiary enrolment of students from Canterbury (i.e., Exposure ∈ {1,2} students) varies before and after the earthquake, compared to students from unaffected schools in the rest of New Zealand over the same time period.
With this specification, our identifying assumption is that had the disaster not occurred, enrolment decisions for Canterbury students would have followed the same trend as that of all other students. This OLS regression takes the form:
(1)
𝑦𝑖𝑐𝑠 = 𝛼𝑐+ 𝛼𝑠 + 𝛽1𝐶𝑡𝑏𝑦𝑠+ 𝛽2𝑃𝑜𝑠𝑡𝑐+ 𝛽3𝐶𝑡𝑏𝑦𝑠× 𝑃𝑜𝑠𝑡𝑐+ Χ′Π + 𝜀𝑖𝑐𝑠
where 𝑖, 𝑐 and 𝑠 index individuals, graduating cohort and school respectively. 𝐶𝑡𝑏𝑦 is an indicator equal to one if a student’s exposure is not 0, or loosely, if the student graduated from a Canterbury high school, or attended a Canterbury high school at the time of the earthquake.
𝑃𝑜𝑠𝑡 is an indicator equal to one if the student finishes high school in years 2011 – 2013. To
relax the assumptions necessary for identification, and reduce residual variance, we include cohort and high school fixed effects 𝛼𝑐 and 𝛼𝑠. Thus, we are restricting attention to within- school across-time variation in outcomes, after accounting for broader year-to-year changes in university-going rates. This strategy accounts for omitted variable bias from factors which could correlate with both the outcome variables, and the 𝐶𝑡𝑏𝑦𝑠× 𝑃𝑜𝑠𝑡𝑐 indicator, such as school openings or closures, or swings in the macroeconomy. We also include a set of controls for gender and ethnicity. The key coefficient in equation (1) is 𝛽3, which captures the causal
12 effect of the earthquake on the various outcomes. Standard errors are estimated to account for clustering occurring at the high school level.
Equation (2) augments equation (1) by allowing the treatment effect to vary by disaster exposure. This regression takes the form:
(2)
𝑦𝑖𝑐𝑠= 𝛼𝑐+ 𝛼𝑠+ ∑ (𝛽𝑑 𝑃𝑜𝑠𝑡𝑐
2
𝑑=1
× 𝐶𝑡𝑏𝑦𝑠 × 1[𝑒𝑥𝑝𝑜𝑠𝑢𝑟𝑒 = 𝑑]𝑠 ) + Χ′Π + 𝜀𝑖𝑐𝑠
In our preferred specifications, we estimate more flexible versions of equations (1) and (2) which allow the treatment effect to vary for each cohort. These distributed lag models take the form:
(3)
𝑦𝑖𝑐𝑠 = 𝛼𝑐+ 𝛼𝑠+ ∑ (𝛽𝑡1
2013
𝑡=2009
[𝑐 = 𝑡] × 𝐶𝑡𝑏𝑦𝑠) + Χ′Π + 𝜀𝑖𝑐𝑠
(4)
𝑦𝑖𝑐𝑠= 𝛼𝑐+ 𝛼𝑠+ ∑ ∑ (𝛽𝑑,𝑡1
2013
𝑡=2009 2
𝑑=1
[𝑐 = 𝑡]𝑐× 1[𝑒𝑥𝑝𝑜𝑠𝑢𝑟𝑒 = 𝑑]𝑠 ) + Χ′Π + 𝜀𝑖𝑐𝑠
In equation (3), we interact the treatment variable 𝐶𝑡𝑏𝑦𝑠 with an indicator for each cohort’s high school graduation year. The omitted category is the 2008 cohort. In equation (4) we interact the indicators for exposure levels with an indicator for each cohort’s high school graduation year.
13 Results
Education outcomes
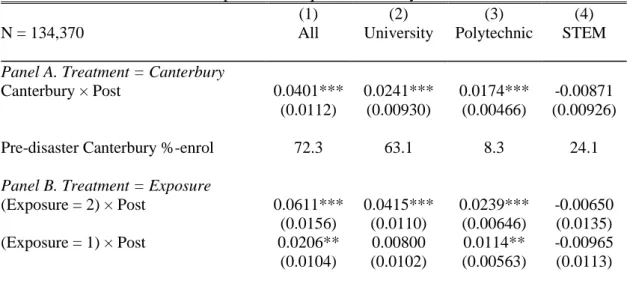
Table 3 presents our results for the impact of the earthquake on tertiary enrolment. Panel A shows coefficients from equation (1) in which all Canterbury students comprise the treatment group. Panel B shows coefficients estimated with equation (2) in which treatment is further categorised by exposure. Each column corresponds to a different outcome variable, which are all indicators equal to one if within three years of high school graduation the student (1) enrols in any public tertiary education; (2) enrols in one of the eight main universities; (3) enrols in a polytechnic; and (4) enrols in a STEM major. We distinguish between the main universities and polytechnics because the disaster may affect their enrolment rates differently. For example, the disaster may affect links between schools and the local university (Sacerdote, 2012), but polytechnics with campuses in the region may not be affected in this way. Similarly, we include STEM enrolment as an outcome because it may inform us of changes in career paths following the disaster, which would have long term consequences beyond education.
Appendix Table A1 gives the results for enrolment in public tertiary education within two years.
The conclusions from both tables do not meaningfully differ.
Table 3 – Impact of earthquake on tertiary enrolment N = 134,370
(1) All
(2) University
(3) Polytechnic
(4) STEM Panel A. Treatment = Canterbury
Canterbury × Post 0.0401*** 0.0241*** 0.0174*** -0.00871 (0.0112) (0.00930) (0.00466) (0.00926)
Pre-disaster Canterbury %-enrol 72.3 63.1 8.3 24.1
Panel B. Treatment = Exposure
(Exposure = 2) × Post 0.0611***
(0.0156)
0.0415***
(0.0110)
0.0239***
(0.00646)
-0.00650 (0.0135)
(Exposure = 1) × Post 0.0206**
(0.0104)
0.00800 (0.0102)
0.0114**
(0.00563)
-0.00965 (0.0113) Notes: Panel A is from equation (1) in the text. Panel B is from equation (2) in the text. The outcome for each column is an indicator equal to 1 if, within three years post Year 13, the student (1) enrols in tertiary education; (2) enrols in university; (3) enrols in a polytechnic; (4) enrols in a tertiary STEM course. Robust standard errors clustered by school. Each regression includes cohort and school fixed effects, and controls for gender and ethnicity. *** p<0.01, ** p<0.05, * p<0.1
14 Similar to Sacerdote (2012)’s estimates on suburban students, we find the disaster has significant positive effects on enrolment. In Table 3 Panel A, students from Canterbury who finish high school after the earthquake are 4.0 percentage points more likely to enrol in tertiary education, which represents a 5.5% increase over the attendance rate of Canterbury cohorts before the disaster. This effect is broken down into a 2.4 and 1.7 percentage point increase in university and polytechnic enrolment respectively. We estimate a precise null effect on STEM enrolment, suggesting that subject choice was not affected by the disaster, and that major choice among otherwise non-enrolees reflected the prevailing status quo.
Turning to Panel B, the effect is greater for students who attend damaged schools. Enrolment in tertiary education increases by 6.1 percentage points for damaged schools, and by 4.2 and 2.4 percentage points for university and polytechnic enrolment respectively. Coefficients are smaller but still statistically significant for students who attend undamaged schools in the area, who increase tertiary enrolment by 2.1 percentage points overall. This effect is only significant for polytechnic enrolment, which increases by 1.1 percentage points. We conduct hypothesis tests of equality between the ‘exposure = 2 × post’ and ‘exposure = 1 × post’ coefficients, and find they are statistically significantly different from each other at the 5% level for all tertiary enrolment (column 1), and university enrolment (column 2). Again, we find no impact on STEM enrolment.
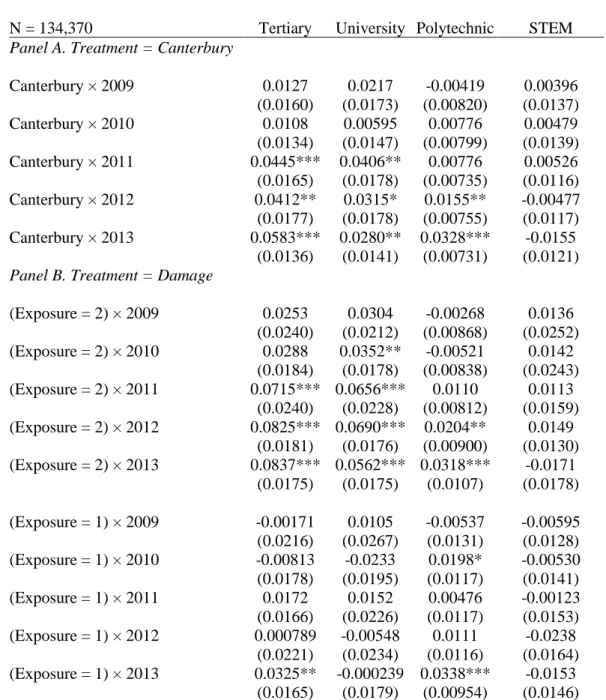
Table 4 summarises the effect of the disaster with the distributed lag specifications of equations (3) and (4). All coefficients are in relation to the omitted cohort, 2008. The change in magnitude and significance of the coefficients from 2011 onwards aligns well with the timing of the earthquake, confirming that our specification is identifying the causal effects of the disaster.
Table 4 panel A shows the impact on all tertiary enrolment is sustained over time, with increases of 4.5, 4.1 and 5.8 percentage points for cohorts 2011, 2012 and 2013. This effect demonstrates a slightly larger impact on students who experience the disaster earlier in their high school careers. University enrolment shows an initial 4.1 percentage point increase in the
15 year of the earthquake, followed by increases of 3.2 and 2.8 in the subsequent years. The increase in tertiary enrolment in 2013 is partially driven by polytechnic enrolment, which rises by 3.3 percentage points in 2013.
Table 4 – Dynamic impact of earthquake on tertiary enrolment
N = 134,370 Tertiary University Polytechnic STEM Panel A. Treatment = Canterbury
Canterbury × 2009 0.0127 0.0217 -0.00419 0.00396
(0.0160) (0.0173) (0.00820) (0.0137)
Canterbury × 2010 0.0108 0.00595 0.00776 0.00479
(0.0134) (0.0147) (0.00799) (0.0139) Canterbury × 2011 0.0445*** 0.0406** 0.00776 0.00526 (0.0165) (0.0178) (0.00735) (0.0116) Canterbury × 2012 0.0412** 0.0315* 0.0155** -0.00477 (0.0177) (0.0178) (0.00755) (0.0117) Canterbury × 2013 0.0583*** 0.0280** 0.0328*** -0.0155
(0.0136) (0.0141) (0.00731) (0.0121) Panel B. Treatment = Damage
(Exposure = 2) × 2009 0.0253 0.0304 -0.00268 0.0136 (0.0240) (0.0212) (0.00868) (0.0252) (Exposure = 2) × 2010 0.0288 0.0352** -0.00521 0.0142
(0.0184) (0.0178) (0.00838) (0.0243) (Exposure = 2) × 2011 0.0715*** 0.0656*** 0.0110 0.0113
(0.0240) (0.0228) (0.00812) (0.0159) (Exposure = 2) × 2012 0.0825*** 0.0690*** 0.0204** 0.0149
(0.0181) (0.0176) (0.00900) (0.0130) (Exposure = 2) × 2013 0.0837*** 0.0562*** 0.0318*** -0.0171
(0.0175) (0.0175) (0.0107) (0.0178) (Exposure = 1) × 2009 -0.00171 0.0105 -0.00537 -0.00595 (0.0216) (0.0267) (0.0131) (0.0128) (Exposure = 1) × 2010 -0.00813 -0.0233 0.0198* -0.00530 (0.0178) (0.0195) (0.0117) (0.0141) (Exposure = 1) × 2011 0.0172 0.0152 0.00476 -0.00123 (0.0166) (0.0226) (0.0117) (0.0153) (Exposure = 1) × 2012 0.000789 -0.00548 0.0111 -0.0238
(0.0221) (0.0234) (0.0116) (0.0164) (Exposure = 1) × 2013 0.0325** -0.000239 0.0338*** -0.0153
(0.0165) (0.0179) (0.00954) (0.0146) Notes: Panel A is from equation (3) in the text. Panel B is from equation (4) in the text. Exposure is measured by level of damage sustained by school attended, summarised in Table 1.The outcome for each column is an indicator equal to 1 if, within three years post Year 13, the student (1) enrols in tertiary education; (2) enrols in university; (3) enrols in a polytechnic; (4) enrols in a tertiary STEM course. Robust standard errors clustered by school. Each regression includes cohort and school fixed effects, and controls for gender and ethnicity.
*** p<0.01, ** p<0.05, * p<0.1
16 Panel B allows the treatment to vary by exposure and year. Here, we see a large and sustained increase in tertiary enrolment for students who attend damaged schools, by 7.2 percentage points in 2011, 8.3 in 2012 and 8.4 in 2013. Students who attend undamaged schools in the region have mostly a small and insignificant change in tertiary enrolment, except for a small significant increase of 3.3 percentage points in 2013. There is indication that students from damaged schools in 2010 also increase their university attendance shortly after high school graduation, though not as much as subsequent cohorts. This finding suggests that experiencing a disaster while in high school compounds with other effects which exist for all recent graduates who must make enrolment decisions in the aftermath of a disaster.
Heterogeneity across high school students
We expect the effect of the earthquake to be heterogeneous across gender and ability. For example, research suggests that women are more vulnerable to the negative effects of disaster, which may manifest in different tertiary enrolment rates ((Zhou et al., 2013), (Wang et al., 2009)). Lowest ability students are least likely to enrol in tertiary education prior to the earthquake, so the scope for an increase is largest for this group. Further, the opportunity costs of university enrolment may differ across groups, as each is exposed to a different labour market disproportionately. A construction boom could disproportionately encourage low skilled men to select out of university attendance, relative to high skilled men, or women. We measure academic ability in high school using expected percentile at National Certificate of Educational Achievement (NCEA) Level 3. The expected percentile metric converts a student’s score in each standard into an expected percentile ranking across all students nationally, and calculates the average of these estimates over all standards taken. We transform the expected percentile to a within school-cohort relative percentile measure, so students are ranked by ability within their own school. We use this transformation due to concerns about affected grades in the year of the earthquake. While we expect the earthquake to have negatively affected student performance in assessments, the New Zealand Qualification Authority (NZQA) permitted schools to apply for an ‘earthquake impaired derived grade’, and allowed
17 for supplementary credits. This change in assessment may falsely inflate the expected percentile of affected students. Under the assumption that the ranking of students within schools remains unaffected by the earthquake-related grading allowances, the transformation removes concern of grading bias.
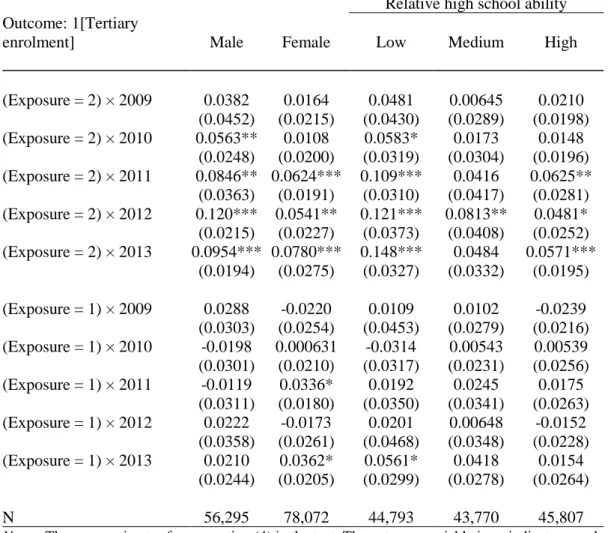
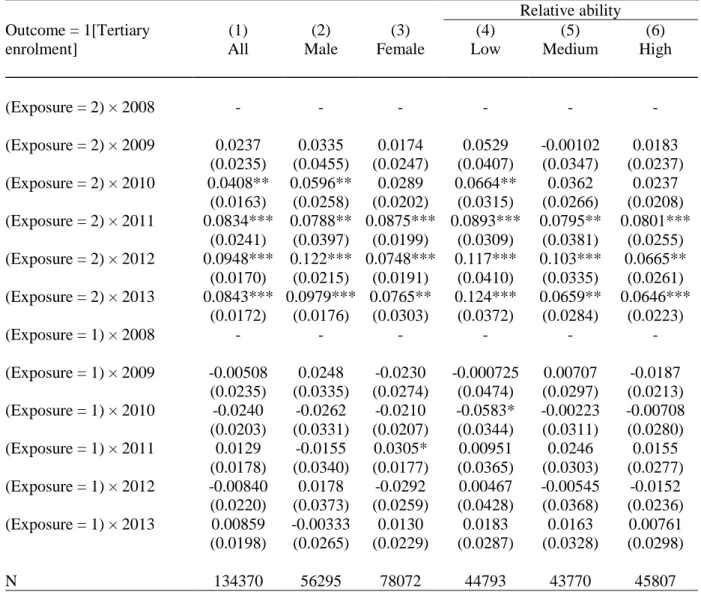
Table 5 shows the results for equation (4) when the sample is stratified by gender and by relative ability tercile. The impact of the disaster is higher for males, with increases of 8.5, 12.0 and 9.5 percentage points for cohorts in 2011, 2012 and 2013. We also find a significant increase of 5.6 for the 2010 cohort. Females see smaller increases of 6.2, 5.4 and 7.8 for cohorts 2011, 2012 and 2013. This may be due to a higher pre-disaster enrolment rate for women, so there is less potential to increase education uptake. When the sample is split by relative ability, the effect is largest for low ability students who attend damaged schools. This group increases tertiary enrolment significantly for each post-disaster year, by 10.9, 12.1 and 14.8 percentage points. This finding shows the disaster caused low ability students, who would otherwise not have enrolled, to continue with further education. Estimates for high ability students at damaged schools are statistically significant but smaller in magnitude, with increases of 6.3, 4.8 and 5.7 percentage points in the years following the disaster. The medium ability group sees a significant increase of 8.1 percentage points in 2012 only. Coefficients for undamaged schools are almost exclusively close to zero and are not statistically significant.
Low ability students are the least likely to enter tertiary enrolment pre-disaster, so finding the greatest impact for low ability students post-disaster is in line with our expectations.
18 Early school leaving
We may be concerned that the results are driven by a change in the sample of Year 13 students due to the earthquake. For example, if the earthquake causes weaker students to drop out of school early, the remaining sample will be made up of more resilient students who may be more likely to enrol in tertiary education regardless of the disaster. We investigate the change in sample using equation (4) on Year 12 students, identified as students who take the qualification NCEA Level 2, where the outcome variable is an indicator equal to one if the
Table 5 – Impact of earthquake on tertiary enrolment, by subgroup Relative high school ability Outcome: 1[Tertiary
enrolment] Male Female Low Medium High
(Exposure = 2) × 2009 0.0382 0.0164 0.0481 0.00645 0.0210 (0.0452) (0.0215) (0.0430) (0.0289) (0.0198) (Exposure = 2) × 2010 0.0563** 0.0108 0.0583* 0.0173 0.0148
(0.0248) (0.0200) (0.0319) (0.0304) (0.0196) (Exposure = 2) × 2011 0.0846** 0.0624*** 0.109*** 0.0416 0.0625**
(0.0363) (0.0191) (0.0310) (0.0417) (0.0281) (Exposure = 2) × 2012 0.120*** 0.0541** 0.121*** 0.0813** 0.0481*
(0.0215) (0.0227) (0.0373) (0.0408) (0.0252) (Exposure = 2) × 2013 0.0954*** 0.0780*** 0.148*** 0.0484 0.0571***
(0.0194) (0.0275) (0.0327) (0.0332) (0.0195) (Exposure = 1) × 2009 0.0288 -0.0220 0.0109 0.0102 -0.0239
(0.0303) (0.0254) (0.0453) (0.0279) (0.0216) (Exposure = 1) × 2010 -0.0198 0.000631 -0.0314 0.00543 0.00539 (0.0301) (0.0210) (0.0317) (0.0231) (0.0256) (Exposure = 1) × 2011 -0.0119 0.0336* 0.0192 0.0245 0.0175
(0.0311) (0.0180) (0.0350) (0.0341) (0.0263) (Exposure = 1) × 2012 0.0222 -0.0173 0.0201 0.00648 -0.0152
(0.0358) (0.0261) (0.0468) (0.0348) (0.0228) (Exposure = 1) × 2013 0.0210 0.0362* 0.0561* 0.0418 0.0154
(0.0244) (0.0205) (0.0299) (0.0278) (0.0264)
N 56,295 78,072 44,793 43,770 45,807
Notes: These are estimates from equation (4) in the text. The outcome variable is an indicator equal to one if the student enrols in tertiary education within three years post-Year 13. Exposure is measured by level of damage sustained by school attended, summarised in Table 1. We split the sample by gender, and by relative ability in Year 13 measured by within-school grade ranking.
Robust standard errors clustered by school are in parentheses. Each regression also includes cohort and school fixed effects, and controls for gender and ethnicity. *** p<0.01, ** p<0.05, * p<0.1
19 student is still in school the following year. Here, the calendar year refers to the year the student is in Year 12.
Table 6 shows the results. Across the various stratified samples, we find no statistically significant change for students from damaged schools, except for the highest ability who see a decrease in continuation rates of 4.1 percentage points in the year of the earthquake.
Interestingly, Year 12 students from undamaged schools in the region are more responsive to the disaster; overall, they persistently decrease their Year 13 registration by 5.2, 4.4 and 4.9 percentage points in 2011 – 2013. The effect is larger for males, with 6.8, 5.6 and 6.7 percentage point decreases, than females, with 3.6, 3.3, and 3.2 percentage point decreases.
We find the effect for undamaged schools is driven entirely by low ability students, who decrease Year 13 registration by 11.4, 8.0 and 12.4 percentage points in the years following the disaster. Low ability students from undamaged schools also decline continuation by 6.1 percentage points in 2010; this may be attributed to last minute drop outs at the start of term in 2011. These results alleviate our concerns that the increase in tertiary enrolment among students from damaged schools is driven by disaster-related changes in Year 13 sample composition. For students from undamaged Canterbury schools, the lack of significant effects on tertiary enrolment may be due to selection out of Year 13 being uncorrelated with university enrolment intentions. Alternatively, it may reflect the net effects of some students dropping out after determining that university is no longer their preferred path after high school, while some of the remaining Year 13 students are induced into university attendance when they otherwise would not have gone, like the behaviour of low ability students from damaged schools.
20 Table 6 – Impact of earthquake on early school leaving for Year 12 students
Relative high school ability Outcome: 1[Continue on
to Year 13] All Male Female Low Medium High
(Exposure = 2) × 2009 -0.0175 -0.0149 -0.0184 -0.0161 -0.0284 -0.00342 (0.0168) (0.0246) (0.0173) (0.0333) (0.0220) (0.0174) (Exposure = 2) × 2010 -0.0123 -0.0112 -0.0143 -0.0173 0.0194 -0.0321 (0.0224) (0.0324) (0.0242) (0.0307) (0.0385) (0.0214) (Exposure = 2) × 2011 -0.0183 -0.0201 -0.0133 0.00313 -0.0159 -0.0412***
(0.0219) (0.0207) (0.0279) (0.0460) (0.0293) (0.0150) (Exposure = 2) × 2012 -0.0236* -0.0176 -0.0277 -0.00461 -0.0286 -0.0312 (0.0141) (0.0181) (0.0204) (0.0315) (0.0300) (0.0197) (Exposure = 2) × 2013 -0.0203 -0.0267 -0.0127 -0.00999 -0.0271 -0.0250 (0.0178) (0.0293) (0.0141) (0.0331) (0.0338) (0.0156) (Exposure = 1) × 2009 -0.0113 -0.00475 -0.0176 -0.0260 0.00419 -0.0182 (0.0181) (0.0338) (0.0185) (0.0214) (0.0370) (0.0175) (Exposure = 1) × 2010 -0.0243 -0.0278 -0.0185 -0.0607*** 0.00457 -0.0228 (0.0150) (0.0283) (0.0155) (0.0225) (0.0284) (0.0226) (Exposure = 1) × 2011 -0.0519*** -0.0681*** -0.0364** -0.114*** -0.0113 -0.0286 (0.0147) (0.0255) (0.0163) (0.0239) (0.0335) (0.0221) (Exposure = 1) × 2012 -0.0443*** -0.0561** -0.0330** -0.0801*** -0.0505* 0.00470 (0.0136) (0.0246) (0.0140) (0.0225) (0.0282) (0.0198) (Exposure = 1) × 2013 -0.0492*** -0.0670** -0.0323* -0.124*** -0.0277 0.00739 (0.0185) (0.0326) (0.0180) (0.0238) (0.0308) (0.0196)
N 232,635 111,066 121,569 76,248 75,024 81,363
Notes: These are estimates from equation (4) in the text, on a sample of six cohorts of Year 12 students. Here, year refers to the year the student is in Year 12. The outcome variable is an indicator equal to one if the student
continues on to Year 13 the following year. Exposure is measured by level of damage sustained by school attended, summarised in Table 1. We split the sample by gender, and by relative ability in Year 13 measured by within-school grade ranking. Robust standard errors clustered by school are in parentheses. Each regression also includes cohort and school fixed effects, and controls for gender and ethnicity. *** p<0.01, ** p<0.05, * p<0.1
University entrance qualification
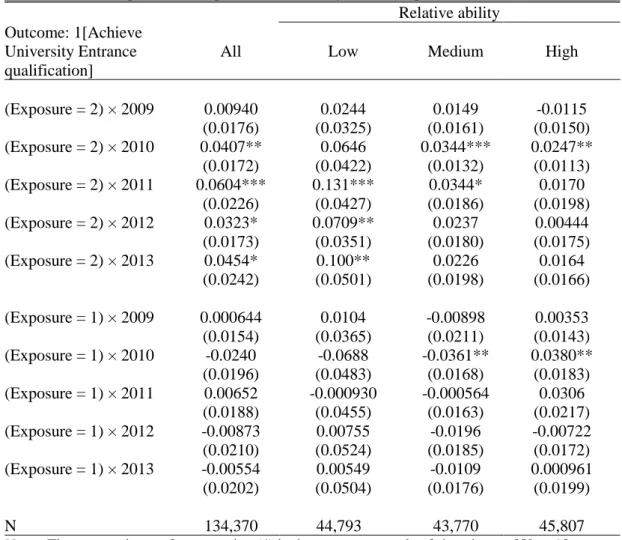
One possibility is that increased tertiary enrolment may be driven by more students achieving the University Entrance qualification. We estimate equation (4) stratified by relative ability, where the outcome is an indicator equal to one if the student achieves the qualification. Table 7 shows the results. We find the disaster causes an increase of 13.1, 7.1 and 10.0 percentage points in the number of low ability students achieving UE in the years following the earthquake.
Medium ability students see increases of 3.4 percentage points in 2010 and 2011, and high ability students see a statistically significant increase of 2.4 percentage points in 2010 only.
21 These results provide suggestive evidence that the increase in tertiary enrolment is driven by more low ability students achieving the minimum requirements necessary to subsequently access higher education. Since earthquake derived grades were only granted in 2010 and 2011, the sustained increase in UE achievement for low ability students in 2012 and 2013 may be attributed to better performance in school. For example, post-disaster students may have less opportunity for part-time work, increased academic motivation, or may migrate to better schools where they are exposed to different peers.2
Table 7 – Impact of earthquake on University Entrance qualification achievement Relative ability
Outcome: 1[Achieve University Entrance qualification]
All Low Medium High
(Exposure = 2) × 2009 0.00940 0.0244 0.0149 -0.0115 (0.0176) (0.0325) (0.0161) (0.0150) (Exposure = 2) × 2010 0.0407** 0.0646 0.0344*** 0.0247**
(0.0172) (0.0422) (0.0132) (0.0113) (Exposure = 2) × 2011 0.0604*** 0.131*** 0.0344* 0.0170
(0.0226) (0.0427) (0.0186) (0.0198) (Exposure = 2) × 2012 0.0323* 0.0709** 0.0237 0.00444 (0.0173) (0.0351) (0.0180) (0.0175) (Exposure = 2) × 2013 0.0454* 0.100** 0.0226 0.0164
(0.0242) (0.0501) (0.0198) (0.0166) (Exposure = 1) × 2009 0.000644 0.0104 -0.00898 0.00353 (0.0154) (0.0365) (0.0211) (0.0143) (Exposure = 1) × 2010 -0.0240 -0.0688 -0.0361** 0.0380**
(0.0196) (0.0483) (0.0168) (0.0183) (Exposure = 1) × 2011 0.00652 -0.000930 -0.000564 0.0306
(0.0188) (0.0455) (0.0163) (0.0217) (Exposure = 1) × 2012 -0.00873 0.00755 -0.0196 -0.00722 (0.0210) (0.0524) (0.0185) (0.0172) (Exposure = 1) × 2013 -0.00554 0.00549 -0.0109 0.000961
(0.0202) (0.0504) (0.0176) (0.0199)
N 134,370 44,793 43,770 45,807
Notes: These are estimates from equation (4) in the text, on a sample of six cohorts of Year 13 students. Here, cohort refers to the year the student is in Year 13. The outcome variable is an indicator equal to one if the student achieves the University Entrance qualification. Exposure is measured by level of damage sustained by school attended, summarised in Table 1. We split the sample by gender, and by relative ability in Year 13 measured by within-school grade ranking. Robust standard errors clustered by school are in parentheses. Each regression also includes cohort and school fixed effects, and controls for gender and ethnicity. *** p<0.01, ** p<0.05, * p<0.1
2 Because of the data structure, it is not possible to track most of the temporary migration locations of students. We therefore cannot assess whether the characteristics of new peers plays a significant role in high school academic performance.
22 Outcomes for tertiary education
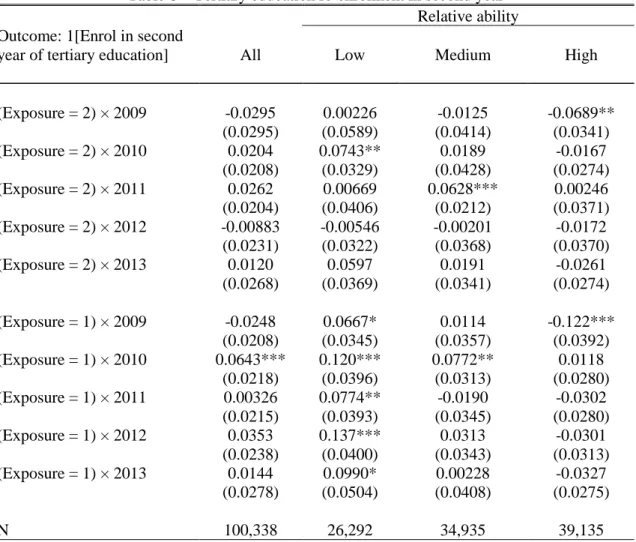
Given that the increase in tertiary enrolment is driven by low ability students, we may be concerned that these students are ill suited for tertiary study, and drop out before finishing their qualification. We investigate this hypothesis by restricting the sample to students who enrol in tertiary education, and use equation (4) where the outcome is an indicator equal to one if the student re-enrols in the following year. Table 8 shows the results. We find that low ability students from undamaged schools in the affected region were more likely to re-enrol in their second year of tertiary education, by 12.0, 7.7 and 13.7 percentage points for school leaving cohorts 2010, 2011 and 2012 respectively. For this group, this result may continue to simply reflect that only relatively dedicated students graduated from high school after the earthquake. The only statistically significant result for low ability students from damaged schools is a 7.4 percentage point increase for the 2010 cohort. Since the undamaged school leavers do not start tertiary education at a higher rate following the earthquake, these results highlight that the students who attend university because of the disaster do not perform worse than previous cohorts, and some may in fact perform better.
Tertiary education region
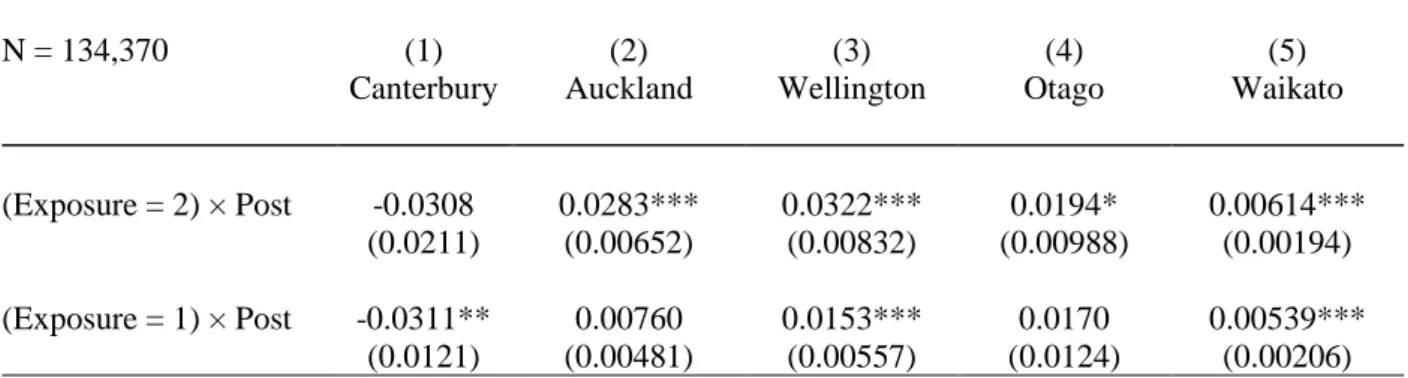
One reason for increased tertiary enrolment may be that high school leavers seeking to leave the damaged region use education as a means to migrate. We investigate this using equation (2) where the outcome variable is an indicator equal to one if the student enrols in a tertiary institution in each region. Table 9 shows the results. We find that students from undamaged schools in Canterbury are less likely to enrol in tertiary education in the Canterbury region, by 3.1 percentage points. This effect may be relatively small due to the scholarships for tertiary education offered by institutions in the affected region. Students from damaged schools are more likely to enrol in Auckland by 2.8 percentage points, and students from damaged and undamaged schools enrol in Wellington at a 3.2 and 1.5 percentage point higher rate. Since
23 the reduction in Canterbury enrolment is relatively small and significant only for students from undamaged schools, we do not find evidence suggesting the increase in tertiary enrolment is overwhelmingly driven by high school students seeking ways to leave the region. It is also worth noting that students appear to favour attending tertiary institutions in the Wellington region – an area known to be especially earthquake prone. This further suggests that fear of experiencing future disasters is not the sole reason for students to enrol in tertiary institutions outside of Canterbury.
Table 8 – Tertiary education re-enrolment in second year Relative ability Outcome: 1[Enrol in second
year of tertiary education] All Low Medium High
(Exposure = 2) × 2009 -0.0295 0.00226 -0.0125 -0.0689**
(0.0295) (0.0589) (0.0414) (0.0341)
(Exposure = 2) × 2010 0.0204 0.0743** 0.0189 -0.0167
(0.0208) (0.0329) (0.0428) (0.0274)
(Exposure = 2) × 2011 0.0262 0.00669 0.0628*** 0.00246
(0.0204) (0.0406) (0.0212) (0.0371) (Exposure = 2) × 2012 -0.00883 -0.00546 -0.00201 -0.0172 (0.0231) (0.0322) (0.0368) (0.0370)
(Exposure = 2) × 2013 0.0120 0.0597 0.0191 -0.0261
(0.0268) (0.0369) (0.0341) (0.0274)
(Exposure = 1) × 2009 -0.0248 0.0667* 0.0114 -0.122***
(0.0208) (0.0345) (0.0357) (0.0392) (Exposure = 1) × 2010 0.0643*** 0.120*** 0.0772** 0.0118
(0.0218) (0.0396) (0.0313) (0.0280) (Exposure = 1) × 2011 0.00326 0.0774** -0.0190 -0.0302 (0.0215) (0.0393) (0.0345) (0.0280)
(Exposure = 1) × 2012 0.0353 0.137*** 0.0313 -0.0301
(0.0238) (0.0400) (0.0343) (0.0313)
(Exposure = 1) × 2013 0.0144 0.0990* 0.00228 -0.0327
(0.0278) (0.0504) (0.0408) (0.0275)
N 100,338 26,292 34,935 39,135
Notes: These are estimates from equation (4) in the text, on a sample limited to only Year 13 students who enrol in tertiary education. Here, cohort refers to the year the student s in Year 13. The outcome variable is an indicator equal to one if the student re-enrols for the second year of tertiary education.
Exposure is measured by level of damage sustained by school attended, summarised in Table 1. We split the sample by relative ability in Year 13 measured by within-school grade ranking. Robust standard errors clustered by school are in parentheses. Each regression also includes cohort and school fixed effects, and controls for gender and ethnicity. *** p<0.01, ** p<0.05, * p<0.1
24 Table 9 – Impact of earthquake on tertiary enrolment, by region
N = 134,370 (1)
Canterbury
(2) Auckland
(3) Wellington
(4) Otago
(5) Waikato
(Exposure = 2) × Post -0.0308 0.0283*** 0.0322*** 0.0194* 0.00614***
(0.0211) (0.00652) (0.00832) (0.00988) (0.00194) (Exposure = 1) × Post -0.0311** 0.00760 0.0153*** 0.0170 0.00539***
(0.0121) (0.00481) (0.00557) (0.0124) (0.00206) Notes: These are estimates from equation (3) in the text, on a sample of six cohorts of Year 13 students. Here, cohort refers to the year the student is in Year 13. The outcome variable is an indicator equal to one if the student, within three years post-Year 13, enrols in tertiary education in (1) the Canterbury region; (2) the Auckland region; (3) the Wellington region; (4) the Otage region; and (5) the Waikato region. Exposure is measured by level of damage sustained by school attended, summarised in Table 1. Robust standard errors clustered by school are in parentheses.
Each regression also includes cohort and school fixed effects, and controls for gender and ethnicity. *** p<0.01, **
p<0.05, * p<0.1
Labour market outcomes four years after Year 13
We estimate equation (4) using a range of wage outcomes four years after Year 13. These results need to be interpreted with some caution, as there are many ways the disaster may have affected wages. Measuring outcomes four years after leaving school means all cohorts are ‘treated’ in different ways. For example, some of the 2008 cohort may have been in their final year of tertiary education in Canterbury at the time of the disaster, and face a challenging labour market when they graduate. Further, some students stay in Canterbury and face affected labour markets, while others move away from the region. These movements are not identified in the data. However, since we know the disaster has heterogeneous effects on tertiary enrolment, it is worthwhile investigating labour market outcomes by subgroup.
Table 10 shows average monthly earnings in the twelve month period, beginning four years after a student’s cohort year of high school graduation. Given that we are investigating a relatively recent sample of Year 13 cohorts, our data do not allow us to investigate the longer term wage outcomes. Four years after high school graduation in 2013 is matched with tax data for 2017, which is currently the last complete year of available data.
25 Average earnings are much larger for students who did not enrol in tertiary education, compared to those who did. This can be for several reasons; for example, four years after leaving school the student may still be in tertiary education. Alternatively, the student may be recently graduated and seeking employment. In the long run, we would expect higher wages for university graduates.
Students who leave damaged schools in 2010 have significantly higher monthly income in 2014, by $102 overall. This is only significant for women, who have $136 higher income, and the high ability students, who have $136 higher income. Those who do enrol in tertiary education have a $114 wage increase. We find the low ability students from damaged schools have no statistically significant changes in earnings. Since low ability students from damaged schools enrol in tertiary education at a higher rate after the disaster, we would expect this group to experience a decrease in wages in the post-disaster years. One possible reason for the wages remaining constant is that the decrease due to new university enrollers is offset by an increase in wages of students who do not enrol in tertiary education, for example through increased demand for labour associated with the rebuild.
In Appendices A2 and A3, we consider two alternative economic outcomes: December income four years after expected high school graduation year, and public assistance receipt. The first specification gives university enrolees more time to find a job after graduation, compared to the average monthly earnings specification in Table 10, and hence may better reflect realised labour market differences after job-search has concluded. The specification on public assistance receipt considers the impact of the disaster on a particular region of the income distribution which may hold particular relevance for policy makers. Table A2 suggests that students from undamaged schools in the 2011 cohort may have seen wage benefits from the disaster. This finding is in line with Deryugina et al (2018) who also find positive wage effects from experiencing Hurricane Katrina. In neither case, do we find compelling evidence of a strong medium term effect on economic outcomes which differs from the results seen in Table 10.
26 Table 10 - Average monthly earnings four years after leaving school
Relative ability (1)
All
(2) Male
(3) Female
(4) Low
(5) Medium
(6) High
(7) Enrol in
tertiary
(8) Do not enrol
in tertiary
(Exposure = 2) × 2009 0.960 43.31 -29.75 -64.89 18.56 41.94 -11.79 80.56
(48.13) (68.38) (80.65) (72.18) (54.72) (79.45) (46.78) (129.9)
(Exposure = 2) × 2010 101.8** 52.77 135.9*** 124.7 39.12 132.3** 114.3** 109.0
(47.65) (62.40) (50.73) (90.02) (96.69) (55.80) (55.46) (67.90)
(Exposure = 2) × 2011 46.85 0.219 86.30* 14.98 100.8 27.32 8.285 281.9***
(47.55) (68.19) (45.88) (122.5) (88.61) (73.03) (50.41) (82.07)
(Exposure = 2) × 2012 58.96 15.98 98.78 -4.052 99.75 80.62 84.30* 134.2
(43.57) (42.03) (75.16) (123.8) (82.42) (79.21) (47.95) (127.2)
(Exposure = 2) × 2013 -6.702 -9.228 -5.208 -17.97 -61.22 51.93 -44.01 271.3***
(34.85) (53.41) (56.01) (93.84) (105.2) (80.58) (54.50) (92.20)
(Exposure = 1) × 2009 -13.31 -153.7** 81.27 99.24 -27.45 -114.0* -35.73 53.10
(31.95) (74.34) (49.89) (91.49) (74.57) (67.41) (44.37) (94.53)
(Exposure = 1) × 2010 44.11 -11.44 69.57 120.8 51.90 -43.38 -75.35* 296.8***
(40.88) (83.71) (50.70) (95.09) (66.45) (49.72) (44.94) (85.00)
(Exposure = 1) × 2011 63.05 97.21 44.66 179.4* 96.40 -91.64 25.86 167.5
(51.34) (89.52) (51.06) (100.7) (95.16) (74.29) (42.17) (123.9)
(Exposure = 1) × 2012 -39.99 -78.09 -5.689 67.43 -93.09 -97.49 -112.3** 128.9
(43.38) (84.69) (53.92) (77.71) (63.05) (83.22) (44.84) (92.02)
(Exposure = 1) × 2013 -41.04 -102.7 4.282 -7.869 -22.06 -110.0 -91.46* 111.4
(35.31) (65.63) (51.99) (82.05) (88.68) (71.99) (52.09) (97.90) Dependent variable mean
N
1600.05 134,370
1669.47 56,295
1549.99 78,072
1766.53 44,793
1596.18 43,770
1439.83 45,807
1474.29 100,338
1970.83 34,032 Notes: These are estimates from equation (4) in the text, on a sample of six cohorts of Year 13 students. Here, cohort refers to the year the student is in Year 13. The outcome variable is average monthly earnings over the twelve month period, four years after Year 13. Exposure is measured by level of damage sustained by school attended, summarised in Table 1. We split the sample by gender, relative ability in Year 13 measured by within-school grade ranking, and by tertiary enrolment status. Counts are randomly rounded to base 3. Robust standard errors clustered by school are in parentheses. Each regression also includes cohort and school fixed effects, and controls for gender and ethnicity. *** p<0.01, ** p<0.05, * p<0.1
27 Discussion and conclusion
The 2011 Christchurch earthquake massively and unexpectedly disrupted the lives of Canterbury high school students. Schools were closed, and households faced unknown financial situations brought on by slow insurance settlements and unemployment. We build on existing literature which finds a positive long term impact of disaster on income and employment, and find that the disaster causes students from damaged schools to enrol in tertiary education at a higher rate. This effect is largest for low ability students, and is not driven by compositional changes in high school graduation. We suggest that this increase in matriculation may be partly explained by greater academic achievement in high school.
Importantly, once enrolled in tertiary education, these students are not more likely to drop out in their first year of tertiary education. We do not find evidence to suggest the increase in tertiary education uptake for low ability students causes an increase in wage for this group four years after leaving school. However, the limited data on long-term economic outcomes and the rapidly changing labour market conditions following the disaster present a challenge for identifying the mechanisms through which the disasters’ effect on education leads to changes in economic circumstances.
As discussed by others, poor local labour market conditions following a disaster reduce the opportunity cost of further education and could increase tertiary enrolment. The New Zealand Household Labour Force Survey finds that total employment in the region declined by 9%
between 2010 and 2012, with the most significant decline in retail and hospitality sectors. The majority of these job losses were for female workers, prompting a sharp increase in female unemployment. At the same time, demand for construction as part of the rebuild saw employment in this sector increase. Despite the overall rise in unemployment, the region experienced difficulty in recruiting skilled labour (Parker and Steenkamp, 2012). These labour market conditions suggest the increase is not driven by poor employment opportunities. Since employment in jobs disproportionately filled by women see the greatest decline, we would
28 expect the uptake of tertiary education to be greater for women. However, we find the effect greater for men.
As relatively low ability males are overrepresented in sectors of the labour market helped by the earthquake, greater demand for university may stem from permanent changes in deeper behavioural parameters such as risk aversion or time preference, rather than as a coping response to poor economic opportunities. This conclusion is consistent with Callen (2015) who finds that two years after the 2004 Indian Ocean Earthquake, survivors exhibit significantly greater patience. This research also finds that effects are largest for individuals with the lowest academic achievement and lowest cognitive test performance. Our results are also in line with Hanaoka, et. al (2018) who find an increase in men’s risk preference in response to the Great East Japan Earthquake in 2011. If low ability men find enrolling in tertiary education a relatively risky gamble compared with their labour market opportunities after high school, then greater tolerance for risk may underlie the increase in demand for university.
Our results have a number of implications. Firstly, it is reassuring that the high school students who experienced the most intense aspects of the disaster exhibit positive outcomes in terms of their education. This finding indicates that emergency measures can be effective at insulating students from the worst long term outcomes. Secondly, the finding that students from undamaged schools in the affected region are more likely to drop-out of high school following the disaster suggests that response to disaster should not only focus on outcomes for students from damaged areas if maintaining school completion rates is a policy objective.
Those students whose education has been indirectly affected, through family unemployment, property damage, or mental health consequences, may also require support. Finally, the finding that low ability students do not drop out of tertiary education following increased access suggests the possible broader implication that low ability students may thrive in tertiary education, given more opportunities to enter.