369 Computational Science — Examinable material only
Compiled, collated and written by David Welch
Sections 1-9 are based on slides by Georgy Gimel’farb, sections 16–18 are based on the book Biological Sequence Analysis by Durbin et al. 2010.
Other sections are incompletely referenced so presence in these notes is no claim of authorship.
What is and what is not in the exam
Nearly all the material we have covered in lectures is examinable. All the major parts of the course that are not examinable have been removed from these notes. A few bits listed below have been left in but won’t be directly tested in the exam.
• Sections 11-11.4 Review of probability (assumed you know this so left here for revision)
• Dont need to memorise functional form for common distributions in Sec 11.5
• Formulae for calculating Akl and Ek(b) without imputing seqeunces in Baum- Welch in Sec 18.7
• Mathematical definition of ultrametric and additive distances in 19.2 and 19.3
• Formulae in Neighbour-Joining algorithm in Sec 19.4
Contents
1 Introduction 5
2 Mathematical modelling and why we need computers 5
2.1 Why we need to be clever about our computing . . . 6
3 Approximating a function by a Taylor series 8 4 Finding the roots of equations 9 4.1 Bisection method . . . 10
4.2 Newton’s method . . . 10
5 Numerical linear algebra 12 5.1 Review . . . 12
5.2 Review of eigenvectors and eigenvalues . . . 15
5.3 Review of systems of linear equations . . . 17
6 Solving linear equations 18 6.1 Easily solvable systems 1: Diagonal matrix . . . 18
6.2 Easily solvable systems 2: Triangular matrix . . . 18
6.3 Easily solvable systems 3: Orthonormal or orthogonal matrix . . . 19
7 Factorising matrices 20 7.1 LU decomposition via Gaussian elimination . . . 22
7.1.1 Gaussian elimination to solve systems linear equations (review) . . 22
7.1.2 Gaussian elimination as LU decomposition . . . 22
8 Singular Value Decomposition (SVD) 23 8.1 Overview of an SVD . . . 23
8.2 Structure of SVD . . . 25
8.3 Condition number of a matrix . . . 26
8.4 Principal Components Analysis (PCA) . . . 27
8.5 What is connection between PCA and SVD? . . . 30
8.6 Problems with SVD and PCA . . . 30
9 Least squares 30 9.1 Computing the Least Squares solution, u∗ . . . 33
9.2 Computing u∗ via Gaussian elimination . . . 33
9.3 Computing u∗ via orthogonalisation (QR decomposition) . . . 34
9.3.1 Constructing the orthogonal matrix Q by Gram-Schmidt . . . 34
9.4 Computing u∗ via SVD: the Pseudoinverse . . . 36
9.4.1 Properties of the pseudo inverse A+ . . . 37
10 Introduction to stochastic processes and probability 39 11 Primer on Probability 39 11.1 Axioms of probability . . . 40
11.2 Conditional probability and independence . . . 41
11.3 Bayes’ Theorem . . . 41
11.4 Random variables . . . 42
11.5 Commonly used distributions . . . 44
11.5.1 Bernoulli distribution . . . 44
11.5.2 Geometric distribution . . . 44
11.5.3 Binomial distribution . . . 44
11.5.4 Poisson distribution . . . 45
11.5.5 Uniform distribution (discrete or continuous) . . . 45
11.5.6 Normal distribution . . . 45
11.5.7 Exponential distribution . . . 45
11.5.8 Gamma distribution . . . 46
12 Inference 46 12.1 Bayesian inference . . . 47
12.2 Maximum likelihood . . . 48
13 Simulation 50 13.1 Random number generation . . . 50
13.2 Simulating from univariate distributions via Inversion sampling . . . 51
13.3 Stochastic processes . . . 53
13.3.1 Random walk . . . 53
13.3.2 Poisson process . . . 54
14 Markov chains 55 15 Introduction to genetics and genetic terminology 57 15.1 Summary of above . . . 61
16 Alignment 62
16.1 Homology . . . 62
16.2 Pairwise alignment . . . 63
16.3 Scoring alignments . . . 63
16.3.1 Model of non-homologous sequences . . . 63
16.3.2 Model of homologous sequences . . . 63
16.4 Choosing the substitution matrix . . . 64
16.4.1 Scoring gaps . . . 65
16.5 Global alignment: Needleman-Wunsch algorithm . . . 66
16.6 Elements of an alignment algorithm . . . 68
16.7 Local Alignment: Smith Waterman algorithm . . . 68
16.7.1 Overlap matches . . . 69
16.8 Pairwise alignment with non-linear gap penalties . . . 69
16.9 Alignment with affine gap scores . . . 70
17 Multiple sequence alignments (MSA) 72 17.1 Dynamic programming . . . 72
17.2 Progressive alignment . . . 73
17.3 Building trees with distances and UPGMA . . . 73
17.4 Feng-Doolittle progressive alignment . . . 75
18 Hidden Markov Models 77 18.1 The Viterbi algorithm for finding the most probable state path . . . 79
18.2 The forward algorithm and calculating P(x) . . . 81
18.3 The backward algorithm and calculating P(x) . . . 84
18.4 The posterior probability of being in state k at time i P(πi =k|x) . . . . 84
18.5 What can we do with the posterior estimates? . . . 85
18.6 Estimating the parameters of an HMM . . . 85
18.7 Baum-Welch algorithm for estimating parameters of HMM . . . 86
18.7.1 Comments on the Baum-Welch algorithm . . . 87
18.8 Sampling state paths . . . 87
18.9 HMM model structure . . . 88
18.9.1 Duration modeling . . . 88
19 Reconstructing trees 90 19.1 Defining distances between sequences . . . 90
19.2 Ultrametric distances . . . 90
19.3 Additive distances . . . 91
19.4 Neighbour joining . . . 91
19.4.1 Unrooted vs rooted trees . . . 94
19.4.2 Complexity of neighbour jointing and UPGMA . . . 95
19.5 Parsimony . . . 95
19.5.1 Parsimony informative sites . . . 98
19.6 Finding the maximum parsimony tree . . . 98
19.6.1 Exhaustive search . . . 98
19.6.2 Branch and bound . . . 99
19.6.3 Heuristic search . . . 99
19.7 Disadvantages of parsimony . . . 101
20 Statistical approaches to modelling evolution 103 20.1 Likelihood of a given tree . . . 103
20.2 Markov processes . . . 109
20.3 Models of sequence mutation . . . 110
20.3.1 Jukes-Cantor model . . . 112
20.4 Estimating the maximum likelihood tree . . . 112
1 Introduction
This course is aimed at introducing computer scientists to uses of computers and com- putational techniques in other areas of science. The number of ways that computers are used in the sciences are many, varied and often extremely sophisticated. The focus of this course will be on “computational science” which involves constructing mathematical models that can be simulated, analysed and solved using computational methods.
The course is split into two parts: in the first 3-4 weeks, we’ll look at techniques for find- ing the roots of equations, solving systems of linear equations and decomposing matrices.
These techniques are basic to areas of research known as computational engineering, nu- merical analysis and applied linear algebra.
In the remaining 8-9 weeks, we’ll turn to computational biology, with a focus on bioin- formatics and phylogenetics. There, we see how a wide range of computational and mathematical techniques have revolutionised an area of science and allowed us to anal- yse and interpret huge amounts of genetic data. This area of study has helped us better understand, among other things, the basic workings of life, our evolutionary history, the causes of inherited diseases and the spread of infectious disease.
From a computational point of view, computational biology is a fascinating and active area of research. The techniques we’ll study in this part of the course include stochastic and probabilistic modelling, simulation, dynamic programming, estimation and infer- ence.
CS 369 is more mathematical than many CS courses. This is unavoidable given the subject matter. We assume that students have some background in discrete mathematics (matrices, graphs, linear equations) and continuous mathematics (functions, derivatives, integration), and an understanding of basic probability (discrete and continuous random variables, expectation, conditional probability) . However, we recognise that students come to this course from a variety of backgrounds so will provide explanations from quite a basic level in most cases. We do assume that students have a solid foundation in programming in one of Java, C++, Python, Matlab or R.
2 Mathematical modelling and why we need computers
Mathematical models attempt to precisely describe a system in order to better under- stand it. A model is usually based on observing the system and is often structured to answer a particular question. It is not an exact replica of the system and is not merely a description of the observations. Recorded observations of the system are known as data. Coupled with data, the model allows us to infer unobserved properties of the model (such as model parameters) and predict future outcomes. Careful comparison of outcomes predicted by the model with data (actual outcomes) tell us how accurate the model is and where it needs to be refined.
This process of modelling and observation has, arguably, been used for thousands of
years and certainly for hundreds. The complexity of the models we create and study is somewhat determined by our ability to interpret and “solve” them. Before computers, we were largely limited to using models that were analytically tractable — that is, models for which closed form solutions could be found — or for which good approximations could be made by hand. Our ability to fit models to data was severely limited by our human limitations of collecting, storing and processing information by hand.
With the advent of computers, both of these limitations have eased considerably. It is now possible to collect and store massive amounts of data. For example, Genbank, which stores genetic nucleotide sequences contains over 204 billion nucleotide bases in more than 189 million sequences as at the end of 2015, while CERN’s Large Hadron Collider produces 30 PB (= 30×106 GB) of data annually. And fast computers allow us process this data and to make almost arbitrarily good approximations to models that are far more complex than could be tackled by hand.
However, even with all the data and computing power in the world we need to be careful to propose useful models and tackle them with efficient techniques if we are to make progress in answering questions that interest us. Bad models, bad data or bad computational techniques could all derail our quest for understanding. In this course, we aim to teach good computational techniques and give some insight into some basic modelling and data analysis techniques that will help to tackle and answer a range of interesting questions.
2.1 Why we need to be clever about our computing
Mathematical problems can be classed into problems that are well-posed and ill-posed.
A problem is well-posedif 1. A solution exists 2. the solution is unique
3. A small change in the initial condition induces only a small change in the solution A problem that is not well-posed is ill-posed.
We are interested in the last criterion which can be termed sensitivity. Suppose our problem has inputsxand has a solution (or output)y. Aninsensitiveor well-conditioned problem is when a change in x causes a change in y that is of similar relative size. A sensitive or ill-conditioned problem is one in which the change in solution/output can be large relative the the change in input.
Based on this idea, define thecondition number by cond= |relative change in solution|
|relative change in input data| =
∆y/y
∆x/x . Thus a problem isill-conditionedis cond1.
Example: what is the condition number when we evaluate a function y =f(x) at an approximation of x, ˆx=x+ ∆x, rather than at the true valuex?
Solution:
cond=
∆y/y
∆x/x
=
f(x+ ∆x)−f(x)/f(x)
∆x/x
=
f(x+ ∆x)−f(x)
∆x
x f(x)
≈
xf0(x) f(x)
. So, depending on the function f and the input x, we could get very large condition
numbers.
Example: What is the condition number for the functions f(x) =xn and f(x) =ex? Solution: From above, the condition number is
cond≈
xf0(x) f(x)
. When f(x) =xn,f0(x) =nxn−1, so
cond=
xf0(x) f(x)
=
x.nxn−1 xn
=
nxn xn
=|n|.
So as the degree of the polynomial increases, the problem becomes increasingly ill- conditioned.
Similarly, whenf(x) =ex,f0(x) =ex so cond=
xf0(x) f(x)
=
x.ex ex
=|x|.
In this case, the condition number depends on the input argument,x. Ifxis very large,
the problem can be considered ill-conditioned.
What does this mean for computation? In nearly all our computations, we will re- place exact formulations with approximations. For example, we approximate continuous quantities with discrete quantities, we are limited in size by floating point representation of numbers which often necessitates rounding or truncation and introduces (hopefully) small errors. If we are not careful, these error will be amplified within an ill-conditioned problem an produce inaccurate results.
This leads us to consider thestabilityand accuracy of our algorithms.
An algorithm isstableif the result is relatively unaffected by perturbations during com- putation. This is similar to the idea of conditioning of problems.
An algorithm is accurate is the competed solution is close to the true solution of the problem. Note that a stable algorithm could be inaccurate.
We seek to design and apply stable and accurate algorithms to find accurate solutions to well-posed problems (or to find ways of transforming or approximating ill-posed problems by well-posed ones).
3 Approximating a function by a Taylor series
First, a little notation. A real-valued function f :R → R is a function f that takes a real number argument, x ∈ R ,and returns a real number, f(x) ∈ R. We write f0(x) to denote the derivative of f, so f0(x) = dxdf, and f00(x) is the second derivative (so f0(x) = dxd(dxdf) = ddx2f2) andf(k)(x) is the kth derivative off evaluated atx.
As we have just seen, simply evaluating a real valued function can be prone to instability (if the function has a large condition number). For that reason, approximations of functions are often used. The most common method of approximating the real-valued function f :R→ R by a simpler function is to use the Taylor series representation for f.
The Taylor series has the form of a polynomial where the coefficients of the polynomial are the derivatives of f evaluated at a point. So long as all derivatives of the function exists at the point x=a,f(x) can be expressed in terms of of the value of the function and it’s derivatives at aas:
f(x) =f(a) + (x−a)f0(a) +(x−a)2
2! f00(a) +. . .+(x−a)k
k! f(k)(a) +. . . This can be written more compactly as
f(x) =
∞
X
k=0
(x−a)k
k! f(k)(a), wheref(0) =f and 0! = 1 by definition.
This is known as theTaylor seriesfor f about a. It is valid forx “close” to a(strictly, within the “radius of convergence” of the series). Whena= 0, the Taylor series is known as a Maclaurin series.
This is an infinite series (the sum contains infinitely many terms) so cannot be directly computed. In practice, we truncate the series afternterms to get theTaylor polynomial of degree ncentred at a, which we denote ˆfn(x;a):
f(x)≈fˆn(x;a) =
n
X
k=0
(x−a)k
k! f(k)(a).
This is an approximation of f that can be readily calculated so long as the first n derivatives of f evaluated at a can be calculated. The approximation can be made arbitrarily accurate by increasing n. The quality of the approximation also depends on the distance ofx from a— the closer xis to a, the better the approximation.
Example: Find the Taylor approximation of f(x) = exp(x) =ex for values of x close to 0.
Solution: The kth derivative off(x) =ex is simply ex for allk. Since we want values of xclose to 0, find the Taylor series about a= 0 (the Maclaurin series). Then
fbn(x; 0) = 1 + x 1!+x2
2! +x3
3! +· · ·=
n
X
k=0
xk k!
This series converges to exeverywhere: lim
→∞ben(x) =ex. The quality of the approximation for various values ofn andx are studied in the table below.
n 1 2 3 4 . . . true valueex
fbn(x= 1; 0) 2.0000 2.5000 2.6667 2.7083 . . . 2.7183
Relative error 0.26 0.08 0.019 0.0037
fbn(x= 2; 0) 3.0000 5.0000 6.3333 7.0000 . . . 7.3891
Relative error 0.59 0.32 0.14 0.053
Notice that the error is smaller forxclose to aand decreases asn, the number of terms
in the polynomial increases.
4 Finding the roots of equations
Given a real valued function f :R→R, a fundamental problem is to find the values of x for which f(x) = 0. This is known as finding the roots of f. The problem crops up again and again and many problems can be reformulated as this problem. For example, if the trajectory of one object is described byh(x), while another object has trajectory g(x), then the two objects intercept one another exactly when f(x) =g(x)−h(x) = 0.
Another common application is when we wish to find the minimum or maximum value that a function takes. We know from basic calculus that if f is the derivative of some function F, then F(x) takes its maximum or minimum values when f(x) = 0. Thus finding the maximum value ofF is a matter of finding the roots off.
We will consider two simple yet effective root finding algorithms. The bisection method and Newton’s method. In both cases, we assume thatf :R→Ris continuous.
4.1 Bisection method
We want to find x∗ such that f(x∗) = 0. Let sign(f(x)) = −1 if f(x) < 0 and sign(f(x)) = 1 iff(x)>0. The bisection method proceeds as follows:
• Initialise: Choose initial guesses a, b such that signf(a)6= signf(b)
• Iterateuntil the absolute difference |a−b| ≈0 – Calculate c= a+b2
– If signf(a) = signf(c), then a←c; otherwise b←c The method provides slow but sure convergence.
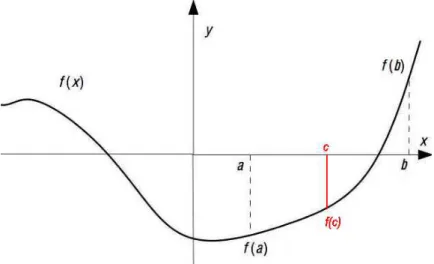
Figure 1: The idea behind the bisection method. Here, signf(a) = signf(c) so at the next iteration we will seta←c. The algorithm stops whenaand bare sufficiently close to each other.
4.2 Newton’s method
This method is also known as the Newton-Raphson method and is based on the approx- imation first two terms of the Taylor series expansion. Recall that we want to find x such thatf(x) = 0. From the first two terms of the Taylor series off(x), we know that f(x) ≈f(a) + (x−a)f0(a). If f(x) is zero, then the expression on the right hand side to 0 and solve for xto get
f(a) + (x−a)f0(a) = 0 =⇒ x=a− f(a) f0(a).
We can treat this iteratively, starting at x0, and finding xi+1 = xi− ff(x0(xii)). This leads to the algorithm:
• Initialise: Choose x0 as an initial guess.
• Iterateuntil the absolute difference |xi−xi−1| ≈0 – Setxi+1=xi−ff(x0(xii)).
Example: f(x) =x2−2.
Solution: f0(x) = 2x so
xi+1=xi− f(xi)
f0(xi) =xi−x2i −2 2xi
= xi 2 + 1
xi
.
See slide for example starting at x0 = 0.5.
Compare with bisection method: Start ata= 1/2 andb= 2 to get to a= 1.34375 and b = 1.4375 at the fifth step. This produces an absolute error of 0.02688 or 1.9%. The absolute error in the Newton case is 0.00020 which is 2 orders of magnitude smaller.
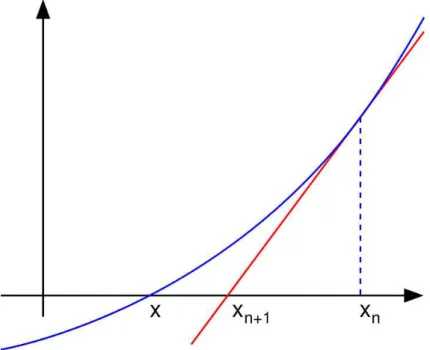
Figure 2: The idea behind the Newton’s method. Starting at xn, we find the tangent line (red) and calculate the point it intercepts thex-axis. This point of intercept isxn+1.
5 Numerical linear algebra
Numerical linear algebra is one of the cornerstones of modern mathematical modelling.
Topics as important as solving systems of ordinary differential equations (arising in engineering, economics, physics, biotech, etc), to network analysis (telecoms, sociologic, epidemiology), internet search, data mining and many more rely on linear algebra.
These days, applied linear algebra and numerical linear algebra are virtually interchange- able — problems of all sizes are routinely solved numerically and rely on a wealth of mathematical and computational insight.
We’ll start out with a brief review of topics that you should be somewhat familiar with.
5.1 Review
Let a =
a1
... an
b =
b1
... bn
be vectors. The inner or dot product of a and b is the scalarc=a•b≡aTb=
n
P
i=1
aibi. The dot product is also calledmultiplicationof vectors.
The normormagnitudeof a vectora is||a||=√ a·a=
√
aTa=p
a21+. . . a2n. Theproductof anm×nmatrixA=
A11 . . . A1n
... . .. ... Am1 . . . Amn
and ann×1 (n-dimensional)
vectorx=
x1
... xn
is them-dimensional vectory=Axwith the elementsyi=
m
P
j=1
Aijxj. The productof ak×m matrixAand an m×nmatrixB is the k×nmatrixC=AB with the elementsCij =
m
P
α=1
Ai,αBα,j
The outer product of an m-dimensional vector a with an n-dimensional vector b is the m×n matrix
abT≡
a1
a2 ... am
b1 b2 . . . bn
=
a1b1 a1b2 . . . a1bn
a2b1 a2b2 . . . a2bn ... ... . .. ... amb1 amb2 . . . ambn
Theidentity matrix of sizen,In, is then×nmatrix with (i, j)th entry = 0 ifi6=j and 1 if i=j.
Theinverse of a square matrixAof sizenis the square matrixA−1 such thatAA−1= In = A−1A. When such a matrix exists, A is called invertible or non-singular. A is singularif no inverse exists. Finding the inverse ofA is typically difficult.
Thedeterminantof ann×nmatrixA, writtendet(A) =
A11 . . . A1n ... . .. ... An1 . . . Ann
, is given by a somewhat complex formula that we need not reproduce here (look it up athttp://en.
wikipedia.org/wiki/Determinant). Forn= 2,det(A) =A11A22−A21A12. Forn= 3, det(A) =A11A22A33−A31A22A13+A12A23A31−A32A23A11+A13A21A32−A33A21A12. Example: Find the determinant of A=
3 5 1 −1
.
Solution: From above, det(A) =|A|= 3.−1−1.5 =−3−5 =−8.
It is worth recalling a few properties of the determinant (as listed on the wiki page):
• det(I) = 1
• det(AT) =det(A) (transposing the matrix does not affect the determinant)
• det(A−1) =det(A)1 (the determinant of the inverse is the inverse of the determinant)
• ForA, B square matrices of equal size, det(AB) =det(A)det(B)
• det(cA) =cndet(A) for any scalarc
• If A is triangular (so has all zeros in the upper or lower triangle) then det(A) = Qn
i=1Aii.
An eigenvector of the square matrix A is a non-zero vector e such that Ae = λe for some scalar λ. λis known as the eigenvalue of A corresponding toe. Note thatλmay be 0. So the effect of multiplyingeby Ais simply to scaleeby the corresponding scalar λ.
The determinant can be used to find the eigenvalues of A: they are the roots of the characteristic polynomial p(λ) = det(A−λIn) whereInis the identity matrix.
Example: Find the eigenvalues of A=
3 5 1 −1
. Solution: We need to solvep(λ) = det(A−λI2) = 0.
|A−λI2| =
3 5 1 −1
−λ
1 0 0 1
=
3−λ 5
1 −1−λ
= (3−λ)(−1−λ)−5
= −λ2−2λ−8
= (λ+ 2)(λ−4)
which is zero when λ= 4 or λ=−2. So the eigenvalues ofA areλ= 4 and λ=−2.
Example: Find the eigenvector of A =
3 5 1 −1
corresponding to the eigenvalue λ=−2.
Solution: The eigenvectorecorresponding toλ=−2 satisfies the equationAe=−2e.
That is,
3 5 1 −1
e1
e2
=−2 e1
e2
. This is the system of linear equations
3e1+ 5e2 = −2e1, (1)
e1−e2 = −2e2. (2)
Rearranging either equation, we gete1=−e2, so both equations are the same. We thus fixe1 = 1 and the eigenvector associated with λ=−2 ise=
1
−1
. Notice that the choice to fixe1 = 1 was arbitrary. We could choose any value so, strictly,e=c
1
−1 for anyc6= 0. Often,cis chosen so thateis normalised (see below). In this case, choose c= 1/√
2 to normalisee.
Vectors aand b are orthogonal if the dot product aTb = 0. Orthogonal generalises the of the idea of the perpendicular. In particular, a set of vectors{e1, . . . ,en}is mutually orthogonal if each pair of vectorsei, ej is orthogonal fori6=j.
A vector ei is normalised ifeTi ei = 1.
A set of vectors that is mutually orthogonal and has each vector normalise is called orthonormal.
Any symmetric, square matrixA of sizenhas exactlyn eigenvectors that are mutually orthogonal.
Any square matrix A of size n that has n mutually orthogonal eigenvectors can be represented via theeigenvector representationas follows:
A=
n
X
i=1
λieieTi
| {z }
Ui
whereUi=eieTi is ann×nmatrix.
The Range, range(A), or span of an m×n matrixA is the set of vectorsy∈Rm such that y= Ax for some x∈Rn. The range is also referred to as the column space of A as it is the space of all linear combinations of the columns ofA.
The Nullspace, null(A), of an m×n matrix A is the set of vectors x∈ Rn, such that Ax=0∈Rm
The Rank, rank(A), of anm×n matrixAis the dimension of the range of A or of the column space of A. rank(A)≤min{m, n}.
5.2 Review of eigenvectors and eigenvalues
• λis an eigenvalue ofA if determinant|A−λI|= 0
• This determinant is a polynomial inλof degreen: so it hasnrootsλ1, λ2, . . . , λn
• Every symmetric matrixA has a full set (basis) of northogonal unit eigenvectors e1,e2, . . . ,en
• No algebraic formula for the polynomial roots forn >4
– Thus, the eigenvalue problem needs own special algorithms – Solving the eigenvalue problem is harder than solvingAx=b
• Determinant |A|=Qn
i=1λi=λ1λ2· · ·λn (the product of eigenvalues)
• Thetrace of a matrix is the sum of the diagonal elements. That is, trace(A) =Pn
i=1aii=a11+a22+. . .+ann.
• It turns out that trace(A) =Pn
i=1λi=λ1+λ2+. . .+λn(the sum of eigenvalues)
• Ak=A· · ·A
| {z }
ktimes
has the same eigenvectors as A: e.g. for A2 Ae=λe ⇒ AAe=λAe=λ2e
• Eigenvalues ofAk are λk1, . . . , λkn
• Eigenvalues ofA−1 are λ1
1, . . . ,λ1
n
Example: Find the eigenvalues and eigenvectors of A=
2 −1
−1 2 Solution: First, find the eigenvalues of A by solving
|A−λI|=
2−λ −1
−1 2−λ
=λ2−4λ+ 3 = (λ−1)(λ−3) = 0.
So the eigenvalues are λ1 = 1 and λ2 = 3
The eigenvector associated with λ1 = 1 is e1 and satisfies Ae1 = λ1e1. Putting e1 = x1
y1
we need to solve
2 −1
−1 2
x1 y1
= x1
y1
.
The second row gives −x1+ 2y1 =y1, soy1 = x1. So fix x1 = 1 and e1 =c 1
1
for any c6= 0. If we choose cso that e1 is normalised, e1 = √1
2
1 1
. A similar argument showse2= √1
2
1
−1
.
Before leaving this example, it is worth looking at some of the properties of the eigen- values ofA:
• Determinant det A≡ |A|= 4−1 = 3⇐⇒λ1·λ2 ≡1·3 = 3
• trace(A) = 2 + 2 = 4⇐⇒λ1+λ2≡1 + 3 = 4
• Inverse matrix A−1= 13
2 1 1 2
: eigenvaluesλ1 = 13 and λ2= 1
• MatrixA2=
5 −4
−4 5
: eigenvaluesλ1= 1 and λ2 = 9
• MatrixA3=
14 −13
−13 14
: eigenvaluesλ1 = 1 andλ2= 27
5.3 Review of systems of linear equations
A linear equation innunknownsx1, . . . , xn is of the forma1x1+. . . anxn=b. Givenm such equations, we can write theith equation as ai1x1+. . . ainxn=bi. We will seek to solve these systems of linear equations.
Example a system of 3 equations in 3 unknowns and its solution is
4x1 + x2 + 2x3 = 24 2x1 − x2 − 2x3 = −6
−x1 + 2x2 − x3 = −4
=⇒
x1 = 3 x2 = 2 x3 = 5
These systems can be represented as a matrix equation Ax=b where A is them×n matrix of coefficients, aij,x=
x1
... xn
is then-dimensional column vector of unknowns and b is a vector of dimensionm.
Example cont. In the example above, A=
4 1 2
2 −1 −2
−1 2 −1
andb=
24
−6
−4
We’ll initially look at systems of n equations and n unknowns. Systems with m < n are known asunder-determinedas there are less equations than unknowns while systems withm > n areover-determinedwith more equations than there are unknowns.
When A is non-singular (so A−1 exists), the system has a unique solution given by x=A−1b.
Recall that Ais nonsingular if and only if:
(i) inverse matrixA−1 exists; or (ii) det(A)6= 0; or
(iii) rank(A) =m, or
(iv)Ax6=0 for any vectorx6=0, or (v) range(A) =Rm, or
(vi) null(A) ={0}.
If A is singular, the system may have infinitely many solutions or no solutions at all, depending onb.
Example IfA=
2 3 4 6
,Ax=b has no solution ifb∈/range(A) or infinitely many solutions when b ∈range(A). Thus, when b =
4 7
there is no solution, while when b=
4 8
,x=
γ
2
3(2−γ)
is a solution for any real γ.
6 Solving linear equations
In principle, all we need to do to solve the system of equationsAx=bis find the inverse ofA,A−1. ThenAx=b =⇒ A−1Ax=A−1b =⇒ x=A−1b. In practice, however, things are more complicated. First, A only has an inverse if it is square (so m = n) and det(A) 6= 0. In most cases, m 6=n and often even when m =n, det(A) = 0 is not unusual. Second, supposing that A is indeed square, m and n are often large (104 is common, as are much larger values). In these cases, even calculatingdet(A) is a hugely expensive and complex computational task while findingA−1 is even harder.
We’ll initially concentrate on easily solvable systems and look at how we can coerce other systems into a form where they (or some close approximation) too are easily solvable.
6.1 Easily solvable systems 1: Diagonal matrix
All the simple systems we consider here are assumed to be square, som =n. We want to solveAx=b.
A is diagonal all entries the off-diagonal are zero. That is aij = 0 when i 6=j. So to specify a diagonal matrix, we need only specify the n diagonal elements. We can thus use the simplifying notation,A= diag{a1, . . . , an}.
When A is diagonal, xi = abi
i for alli= 1, . . . , n. That is, A−1 = diag{a1
1, . . . ,a1
n}. Or, to use less compact notation:
A=
a1
. ..
an
⇒ A−1 =
1 a1
. ..
1 an
.
6.2 Easily solvable systems 2: Triangular matrix
A matrix is lower triangular when all entries above the main diagonal are 0. That is, A is lower triangular if and only if aij = 0 when i < j. Similarly, a matrix is upper triangular when all entries above the main diagonal are 0 (aij = 0 for i > j). Lower triangular is also called left triangular, and upper called right triangular, for obvious reasons. E.g., a lower triangular matrix:
A=
a11 0 . . . 0 a21 a22 . .. ...
... ... . .. 0 an1 an2 . . . ann
.
The system Ax = b is easy to solve for triangular A and it does not require that we calculate the inverse ofA.
For the lower triangular matrix, the solution is given by xi= 1
aii
bi−
i−1
X
j=1
aijxj
, so that
x1= b1 a11
; x2 = b2−a21x1 a22
; . . .; xn= bn−an1x1−. . .−an−1,nxn−1
ann
.
A similar simple formula is available for the upper triangular case, this time working backwards fromxn:
xn= bn ann and
xi = 1 aii
(bi−ai,i+1xi+1−. . .−ai,nxn) for i=n−1, . . . ,1.
The method of Gaussian elimination, or row reduction, which we assume you have seen before transforms the matrixA into a triangular one to solve the system. This method is reviewed and discussed in Section 7.1
6.3 Easily solvable systems 3: Orthonormal or orthogonal matrix MatrixAisorthogonalororthonormalif the columns ofAare mutually orthogonal unit vectors.
That is, A = [a1 a2 . . . an] where ai = [ai1 ai2 . . . ain]T are unit vectors and the set {a1 a2 . . . an} is mutually orthogonal (so ai·aj = 0 for i6=j).
When Ais orthonormal, A−1 =AT. This result is true since
ATA≡
aT1 ... aTn
[a1 a2 . . . an] =In≡diag{1,1, . . . ,1}.
Also check thatAAT=In: AATA≡A(ATA)
| {z }
In
=Aand AATA≡(AAT)A
These properties can be taken as a definition of an orthonomal matrix: A−1 = AT if and only if Ais orthonormal.
Thus, ifA is orthonormal, the solution toAx=b is simply x=ATb.
Example: Find the solution to the set of equations
0.48x1+ 0.64x2+ 0.60x3 = 3.56 0.36x1+ 0.48x2−0.80x3 = −1.08 0.80x1−0.60x2 = −0.40 or
x1
a1
z }| {
0.48 0.36 0.80
+x2
a2
z }| {
0.64 0.48
−0.60
+x3
a3
z }| {
0.60
−0.80 0.00
=
3.56
−1.08
−0.40
. So A= [a1a2 a3].
Solution: By checking thatai·aj = 1 for i=j = 0 for i6=j, it is easy to see that A is orthonormal. So we have the solution
x=ATb=
aT1 aT2 aT3
b and
x1=aT1b = 0.48·3.56−0.36·1.08−0.80·0.40
= 1.7088−0.3888−0.3200 = 1.0 x2=aT2b = 0.64·3.56−0.48·1.08 + 0.60·0.40
= 2.2784−0.5184 + 0.2400 = 2.0 x3=aT3b = 0.60·3.56 + 0.80·1.08
= 2.136 + 0.864 = 3.0.
7 Factorising matrices
As we saw in the previous section, matrices with special forms are often much easier to work with than arbitrary matrices. The remainder of this part of the course is focused on how we can manipulate an arbitrary given matrix into a form that is convenient for a stated problem. This is known as factorisingordecomposingmatrices.
There are 3 factorisations we will study in various degrees of depth: LU-factorisation, Singular Value Decomposition (SVD) and QR decomposition. A brief summary is given here:
• Elimination(LU decomposition): A=LU
– Lower triangular matrix × Upper triangular matrix
• Singular Value Decomposition(SVD): A=UDVT
– × diag(singular values) × Orthogonal (rows) – Orthonormal columns inU and V:
the left and rightsingular vectors, respectively
– Left singular vector: aneigenvectorof the square m×m matrixAAT – Right singular vector: aneigenvectorof the square n×nmatrixATA – Singular value: the square root of an eigenvalue ofATA(or AAT).
• Orthogonalisation(QR decomposition): A=QR – Orthogonal matrix (columns) ×
7.1 LU decomposition via Gaussian elimination
7.1.1 Gaussian elimination to solve systems linear equations (review) You should be familiar with the process of Gaussian elimination (or row reduction) in which the equation Ax = b (where A is arbitrary) in transformed into the equivalent equation Cx=d whereC is triangular, making the equation easy to solve. We review the process here.
It is easy to show thatmultiplyingboth sides ofAx=bfrom the left by any nonsingular matrix M does not affect the solution. That is MAx =Mb has the same solution as Ax=b, since
MAx=Mb⇒x= (MA)−1Mb=A−1M−1Mb=A−1b.
We know from the above result that we can multiple both sides by a series of elemen- tary matriceswhich perform various row operationson A: the three types of operation are row swapping, row multiplication and adding some multiple of one row to another row. Repeated application of these three operations (that is, repeated multiplication by elementary matrices) to both sides of the equation transforms it to Cx =d where C= M1. . .MkA is in upper triangular form (so the only non-zero elements of C are on or above the diagonal) andd=M1. . .Mkb.
7.1.2 Gaussian elimination as LU decomposition
It turns out that Gaussian elimination can be viewed a LU decomposition in which a matrixAis written as the product of a lower triangular matrixLand an upper triangular matrix U so that A = LU. Recall that the Gaussian elimination process starts with an arbitrary square matrixA, multiplies it by a series of elementary vectors,M1. . .Mk to get U = M1. . .MkA where U is upper triangular (we called it C in the earlier discussion).
Now (check that you understand the following statements), each of the elementary matri- ces is lower triangular (so long as there are no row swapping operations) and the inverse of lower triangular matrices are lower triangular too, so each ofM−1i , fori= 1, . . . , k is lower triangular. Finally, the product of lower triangular matrices is also lower triangular so
U=M1. . .MkA =⇒ LU=A,
whereL= (M1. . .Mk)−1=M−1k . . .M−11 . If row permutations (row swaps) are needed in the Gaussian elimination process, we can’t find an LU decomposition for A but can find an LU decomposition for the permuted matrixPA, wherePdescribes the necessary permutations. Obviously, the permuted system has the same solution as the unpermuted system.
The computational complexity of solving a system of n equations in n unknown using Gaussian elimination is O(n3). It is typically a stable algorithm, though potential for
instability arises when a leading non-zero entry is very small (as we divide through by this entry). Reordering of the rows before the start of the row reduction process so that the largest leading non-zero elements are selected first can avoid this cause of instability.
This technique is known as pivoting.
We won’t look further at LU decompositions but will spend considerable time looking first at singular value decomposition and its uses and, later, when we consider the Least Squares framework, QR decompositions and its applications.
8 Singular Value Decomposition (SVD)
Singular Value Decomposition is a method of factorising any ordinary rectangularm×n matrix. It is most frequently applied to problems where m ≥ n (more equations than unknowns).
It has applications in signal processing, pattern recognition, and statistics where it is used for least squares data fitting, regularised inverse problems, finding pseudoinverses and performing principal component analysis (PCA). The application areas are many and varied but include computational tomography, seismology, weather forecast, image compression, image denoising, genetic analyses and more.
It is particularly useful when a given set of linear equations is singular or very close to singular in which case conventional solutions (e.g. by LU decomposition) are either not available or produce senseless results (due to the problems being ill-posed). In these cases, SVD can diagnose and, in some cases, solve the problem giving an useful numerical answer (though not necessarily the expected one!).
8.1 Overview of an SVD
SVD represents an ordinarym×nmatrixA asA=UDVT where:
U : anm×m column-orthogonal matrix; itsm columns are them eigenvectorsu of the m×m matrix AAT. The vectors {u} are known as the left singular vectors ofA.
V : an n×n orthogonal matrix; its n columns are the eigenvectors v of the n×n matrixATA. The vectors{v}are known as the right singular vectorsof A.
D : an m×n matrix whose only non-zero elements are the first r entries on the diagonal wherer is the rank of A anddkk=σk =√
λk whereλk is the eigenvalue associated withvk.
The singular values,σk are ordered so thatσ1 ≥σ2 ≥. . .≥σr >0.
Since A=UDVT, we can write A =
r
X
k=1
σkukvkT (3)
= σ1u1vT1 +σ2u2v2T+. . .+σrurvTr.
This representation suggests the approximation ofA by the truncated series, Abρ=
ρ
X
k=1
σkukvTk forρ < r.
Notice that when m > n (that is, the problem is over-determined), there are at mostn non-zero singular values. In this case, we can truncate the matrixUto bem×nand the matrixDto be an×ndiagonal matrix. This leaves the sum in Equation 3 unaltered as the rows or columns that are removed contribute nothing to that sum. In the following example, we employ this strategy.
Example: Find the SVD of the matrix Awhere A=
0 1 1 1 1 0
Solution: First find the eigenvectors and eigenvalues of AAT and ATA. Since A is 3×2, we need only find the top two eigenvalues and eigenvectors of each of these matrices.
ATA=
0 1 1 1 1 0
0 1 1 1 1 0
=
2 1 1 2
which has eigenvalues λ1 = 3 andλ2 = 1. The associated eigenvectors are, respectively, v1 = 1
√2 1
1
andv2 = 1
√2 −1
1
. Notice that the eigenvectors have been normalised.
Similarly,
AAT=
0 1 1 1 1 0
0 1 1 1 1 0
=
1 1 0 1 2 1 0 1 1
The top two eigenvalues areµ1 = 3 and µ2 = 1. Notice that these are the same as the top two eigenvalues ofATA. The associated eigenvectors are
u1 = 1
√6
1 2 1
andu2 = 1
√2
1 0
−1
.
The singular values are given byσi =√
λi, soσ1 =√
3 andσ2 = 1.
We can thus writeA as A=
0 1 1 1 1 0
= [u1u2]
| {z }
U
diag(σ1, σ2)
| {z }
D
vT1 vT2
| {z }
VT
=
1/√
6 1/√ 2 2/√
6 0
1/√
6 −1/√ 2
| {z }
U
√ 3 0 0 1
| {z }
D
1/√
2 1/√ 2
−1/√
2 1/√ 2
.
| {z }
VT
The matrix approximationAb1 is calculated as follows:
Ab1 = σ1u1vT1
= √
3·√1
6
1 2 1
·√1
2[1 1] = 12
1 2 1
[1 1] =
0.5 0.5
1 1
0.5 0.5
while the approximation can be extended to Ab2(=A) by Ab2 = Ab1+σ2u2vT2
≡
0.5 0.5
1 1
0.5 0.5
+ 1·√1
2
1 0
−1
√1
2[−1 1]
≡
0.5 0.5
1 1
0.5 0.5
+
−0.5 0.5
0 0
0.5 −0.5
=
0 1 1 1 1 0
.
| {z }
A
8.2 Structure of SVD
In the overdetermined case, in which m > n, so that we have more equations than unknowns, we have the following structure:
A = U D VT
In the underdetermined case, in which m < n, so that we have fewer equations than unknowns, we have the following structure:
A = U D VT
Note that, in the overdetermined case, we truncate U and D since there are at most r≤n < mnon-zero singular values ofA we can omit theui that contribute nothing to matrix product.
The matrix V is orthonormal, so VVT =VTV =In. U is orthonormal when m ≥n, but if m < n, the singular values σj = 0 for j = m+ 1, . . . , n and the corresponding columns of U are also 0 so that UUT = diag(1, . . . ,1,0, . . . ,0) where only the first m elements of the diagonal are 1 and the elements from m+ 1 tonare zero.
Note that the SVD of matrixAis only unique up to permutations of the columns/rows.
For this reason, we insist that the singular values and corresponding singular vectors are arranged so that the singular values are in descending order σ1 ≥ σ2 ≥ . . .. Even then, some of the σi’s may have the same value so columns of U and V could be permuted. Aside from these possible permuations, the representation is unique. Be aware when calculating the SVD with various software that the you may need to enforce this canonical representation.
8.3 Condition number of a matrix
The concept of a condition number was introduced in Section 2. This concept can be applied to a matrices and is useful, for example, when considering solutions to the equation Ax=b. Solutions to this equation will change greatly with small changes in b when A has a large condition number, while the small changes in b will lead to only small changes in the solution when the matrix has a small condition number. We can define the condition number of a matrix as the maximum of the ratio of the relative error inx divided by the relative error inb, where the maximum is taken over all possiblex and b.
To give a full description of how to derive the condition number of A, we would have to introduce matrix norms which we do not have time to do here. Instead, we simply present the result here that the condition number of A can be defined as the ratio of the largest to the smallest non-zero singular values:
cond(A) = σmax
σmin.
If the smallest singular value ofAis 0, A is singular (has no inverse) but the condition number ofA is still defined.
The condition number of Ais considered to be large, and the matrix is ill-conditioned, if roughly log(cond(A))≥k where k is the number of digits of precision in the matrix entries.
Example: Find the condition number of the matrix A=
2 −3 1 −1
Solution: Using a matrix algebra package, find the singular values ofAto be 3.864 and
0.259, socond(A) = 3.8640.259 ≈14.9.
Example: The singular values of the matrixA=
1.2969 0.8648 0.2161 0.1441
are approximately
1.58 and 6.33×10⁻⁹ so the condition number is about 2.5×10⁸. This very large condition number means thatA is an ill-conditioned matrix.
Ill-conditioning means that standard approaches to solving linear systems can be very unstable. For example, consider the linear system Ax=b whereb=
0.8642 0.1140
. This has the exact solutionx=
2
−2
.
But standard matrix software (linsolvein Matlab), gives the solution as
2.59
−3.89
× 106 which is radically wrong!
It also means that if some number in the system is measured slightly differently, the results we get can change enormously. For example, if the measurement vector b is just slightly different, say b =
0.86419999 0.11400001
, then the exact solution is now close to x =
0.9911
−0.4870
which represents an enormous change in the solution relative to the
small change in the original system.
8.4 Principal Components Analysis (PCA)
PCA is a common technique for identifying patterns in high-dimensional data. It trans- forms the original correlated measurements into uncorrelated measurements. One of the main uses of PCA is as a dimension reduction tool, in which only the directions in which the data varies the most are considered. This can lead to enormous simplifications of the data and provide insights for a wide variety of data. PCA is alternatively known as the Karhunen-Lo´eve transform (KLT), the Hotelling transform or proper orthogonal decomposition (POD)
These new coordinate axes (along which the data varies the most) are are known as principal components and are, by construction, orthogonal.
A useful visualisation tool to aid your understanding of PCA is at http://setosa.io/ev/principal- component-analysis/.
Suppose we have a m×nmatrix of measurement data A. For example,n trials where m properties were measured in each trial. Then, if ai are the measurements from the ith trial,
A=
a1 a2 . . . an
=
a11 a12 . . . a1n
a21 a22 . . . a2n ... ... . .. ... am1 am2 . . . amn
.
For example,A could ben= 100 observations of the position of an object measured in m= 3 dimensions.
In the following, assume that the rows ofAhave been centred, so that the mean of each
row is 0 (each rows of Acorresponds to a dimension in the original data). If this is not already the case, it can be achieved by subtracting the mean of each row ofAfrom each element of that row. That is, set element
aij =aij −
n
X
j=1
aij/n
to centre the rows of A. This is a critical assumption and allows us to concentrate on the variance.
Each observation A is just the m-vector ai. The idea of PCA is to chose a new basis u1, . . . ,uk to express the data points (theai’s) so that the variance of the measurements is greatest in the direction ofu1, the next greatest variance is in the direction ofu2 and so on, down touk. Ideally,k < m.
Define the covariance matrixof A by Σ= 1
n−1AAT.
Then Σis an m×m matrix where the diagonal terms of Σare the variance of the ith dimension of the measurement, while the off-diagonal terms of Σ are the covariances between different measurements.
It turns out that the best basis to choose are the k eigenvectors ofΣcorresponding its k largest eigenvalues. These are known as the principal components of A. Call them u1, . . . ,uk and form the matrix
Uk = [u1, . . . ,uk]
From results we have seen earlier about symmetric matrices, this an orthogonal matrix.
We include the subscriptkas we may decide to truncate this matrix by including only the eigenvectors corresponding to the largest eigenvalues. That is, if Σ hasK eigenvectors and associated eigenvalues, and the largest k eigenvalues are substantially larger than the remainingK−k, it is reasonable to form Uk containing only the most significant k eigenvectors.
We can now represent the original measurements,A, in this this new co-ordinate system.
The amount of measurement vectorai in direction uj is given by u>jai: this is the jth coordinate ofai in this new coordinate system. So if we consider just the two dimension space defined by the top two principal components, ai has coordinates
UT2ai = uT1
uT2
ai =
uT1ai uT2ai
.
We usually consider this space independently of how it relates to the originalm-dimensional space but we can consider it as embedded in the original space. To find the coordinates
of a point in this embedded space, define the projection matrix,Pk by
Pk=UkUTk =
u1 u2 . . . uk
uT1 uT2 ... uTk
so that each measurement vectorai is projected viaPkai.
One interpretation of PCA is that the projectionPkis chosen to minimise the projection errorPn
j=1kaj−Pkajk2
Example: Find the principal components of the data matrix Awhere A=
−4 3 −5 18 6 −5
2 6 −2 10 1 −1
7 11 3 6 9 3
.
Find the amount of the first principal component in the first measurement vector of A (that is, the first column), and calculate the projection matrix for projectingAonto the first two principal components.
Solution: First, centre the rows ofAso that each row has mean zero. Call this centred matrixB.
B=
−6.1667 0.8333 −7.1667 15.8333 3.8333 −7.1667
−0.6667 3.3333 −4.6667 7.3333 −1.6667 −3.6667
0.5 4.5 −3.5 −0.5 2.5 −3.5
. Now form the covariance matrix for the centred data matrix,Σ= 1nBBT:
Σ= 1 5
406.8333 176.3333 52.5 176.3333 103.3333 36.0 52.5000 36.0000 51.5
.
This matrix has eigenvalues 99.31, 9.46 and 3.561 corresponding to eigenvectors [u1,u2,u3] =
0.8987 0.2829 0.3352 0.4158 −0.3062 −0.8564 0.1396 −0.9090 0.3928
=U.
These eigenvectors are the principal components ofA (and of B).
The amount of the first principal component in a1 is u>1a1= [0.8987,0.4158,0.1396]
−4 2 7
=−1.756.
To projectA into the coordinate system defined by the first two principal components, form the projection matrix,
P2=U2UT2 =
0.8987 0.2829 0.4158 −0.3062 0.1396 −0.9090
0.8987 0.4158 0.1396 0.2829 −0.3062 −0.9090
=
0.8877 0.2870 −0.1316 0.2870 0.2666 0.3364
−0.1316 0.3368 0.8457