Bulletins 4000 - Agriculture
10-2010
Report on phosphorus and potassium experiments conducted on Report on phosphorus and potassium experiments conducted on partner farms of the Greener Pastures project
partner farms of the Greener Pastures project
Mike Bolland Ian Guthridge Graham Blincow Peter Needs
Follow this and additional works at: https://researchlibrary.agric.wa.gov.au/bulletins Part of the Dairy Science Commons, and the Plant Sciences Commons
Recommended Citation Recommended Citation
Bolland, M, Guthridge, I, Blincow, G, and Needs, P. (2010), Report on phosphorus and potassium experiments conducted on partner farms of the Greener Pastures project. Department of Primary Industries and Regional Development, Western Australia, Perth. Bulletin 4809.
This bulletin is brought to you for free and open access by the Agriculture at Digital Library. It has been accepted for inclusion in Bulletins 4000 - by an authorized administrator of Digital Library. For more information, please contact [email protected].
Bulletin 4809
October 2010 ISSN 1833-7236
RepoRt on phosphorus and potassium
experiments conducted on partner farms of the
Greener pastures project
Copyright © Western Australian Agriculture Authority, 2010
Copies of this document are available in alternative formats upon request.
3 Baron-Hay Court South Perth WA 6151
Tel: (08) 9368 3333 Email: [email protected] Website: www.agric.wa.gov.au
RepoRt on phosphorus and potassium
experiments conducted on partner farms of the Greener pastures project
Mike Bolland
Department of Agriculture and Food Western Australia, po Box 1231, Bunbury, WA 6231, Australia.
email: [email protected]
Ian Guthridge, Graham Blincow and Peter Needs
Department of Agriculture and Food Western Australia, Manjimup Horticultural Research Institute, Locked Bag 7, Manjimup, WA 6258, Australia.
email: [email protected]; [email protected]; [email protected]
Contents
Brief summary ...4
Summary ...4
Background ...5
Materials and methods ...7
Location of experiments and some soil properties...7
experimental details ...7
Basal fertilisers ...10
Grazing management ...10
Measuring pasture dry matter (DM) yields ...11
Soil testing ...11
plant testing ryegrass samples collected from nil plots at the start of the 2010 growing season ...12
Analysis of data ...12
Results ...13
phosphorus experiment...13
potassium experiment ...17
Discussion ...18
phosphorus experiment...18
potassium experiment ...23
Conclusions ...24
Acknowledgements ...24
References ...24
Brief summary
Fertiliser phosphorus and potassium should only be applied to intensively grazed ryegrass (Lolium rigidum Gaud. and L.
multiflorum Lam.) dairy pastures when soil testing indicates phosphorus is required and plant testing indicates potassium is required.
critical value for the soil at a third site. Critical soil test p is located near the maximum yield plateau, in the flat part of the relationship between yield and soil test p, particularly when, as appropriate for dairy production, the critical value is for 95 per cent of the maximum pasture DM yield. Consequently, when no phosphorus is applied and soil test p decreases, significant pasture DM yield decreases will only occur when soil test p approaches the steeper part of the relationship, which can take some time. In addition, faeces deposited by grazing cows supply phosphorus to pasture even when no fertiliser phosphorus is applied.
Soil potassium testing proved unreliable for indicating the need to apply fertiliser potassium to pasture in the next growing season, attributed to how many soil samples for soil testing were collected within and between urine patches, which contain a lot of potassium, deposited onto pasture by cows while grazing.
We conclude farmers need only apply fertiliser phosphorus to intensively grazed ryegrass pastures when soil testing indicates it is required and fertiliser potassium should only be applied when plant testing indicates it is required.
Summary
Intensively grazed, rain-fed dairy pastures on the predominantly sandy soils in the high rainfall (greater than 800 mm annual average) Mediterranean-type climate of south-western Australia comprise greater than 90% ryegrass (Annual Ryegrass, Lolium rigidum Gaud. and Italian Ryegrass, L. multiflorum Lam.).
to maximise pasture use for milk production, pastures are rotationally grazed by starting grazing when ryegrass plants have around three leaves per tiller and fertiliser nitrogen (N) and sulfur (S), in the ratio 3-4 N and 1 S, need to be applied after each grazing for profitable dry matter (DM) production.
In addition, farmers often apply low levels of phosphorus (p) and potassium (K) fertiliser after each grazing, despite Colwell soil test p usually being well above critical values for pasture production and, in the traditional clover (Trifolium subterraneum L.) ryegrass pastures of the region, fertiliser potassium is usually only required for clover.
In field experiments undertaken from May 2006 to June 2010 on intensively grazed ryegrass pastures, regardless of level or method of phosphorus or potassium application, no significant ryegrass DM responses to applied fertiliser phosphorus or potassium were obtained.
When no phosphorus was applied, soil test p declined gradually, by between 4.4-7.1 mg/kg per year, and remained above the critical value for the soils at two sites, but declined below the
Background
Dairy production in south-western Australia occurs predominantly on sandy soils in the greater than 800 mm annual average rainfall areas of the region. the climate is Mediterranean- type, typically with cool, wet May-october growing seasons and hot, dry November-April. Most dairy pastures are rain-fed and comprise the annual species Subterranean Clover (clover, Trifolium subterraneum L.), Annual Ryegrass (Lolium rigidum Gaud.) and Italian Ryegrass (L. multiflorum Lam.).
paddock grown pasture is the cheapest source of feed for dairy production in the region (Dilley and Howes 1998). to remain profitable in the face of diminishing returns, dairy farmers have modified their grazing management to use as much paddock grown pasture as possible (Bolland and Guthridge 2007a, 2007b, 2009). this has been achieved by adopting the three- leaf grazing strategy for ryegrass-based pastures outlined by Fulkerson and Donaghy (2001). pastures are rotationally grazed with grazing started when ryegrass plants have 2-3 leaves per tiller and about 80% of the pasture is consumed by lactating dairy cows at each grazing (Bolland and Guthridge 2007a, 2007b, 2009).
However, clover can no longer provide sufficient nitrogen through symbiotic nitrogen fixation for these pastures so fertiliser nitrogen needs to be applied after each grazing to prevent nitrogen deficiency reducing pasture production (Bolland and Guthridge 2007b). Both clover and ryegrass respond to the applied nitrogen by growing bigger leaves and stems but, between grazings, ryegrass grows over the top of, and shades out clover, so clover rapidly disappears and ryegrass comprises greater than 90 per cent of the pasture (Bolland and Guthridge 2007a, 2007b, 2009).
the soils used for dairy production in the region were acutely phosphorus deficient when cleared of native vegetation for agriculture and fertiliser phosphorus needed to be applied for profitable pasture production (McArthur 2004). Fertiliser phosphorus has a good residual value in most of the sandy soils of the region (Barrow 1966). Regular application of phosphorus has resulted in soil test phosphorus levels now typically being well above the critical value for most soils used for dairy production (Bolland and Guthridge 2007a).
phosphorus requirements for pasture dry matter (DM) production have been determined for clover in the region, but not for ryegrass. Glasshouse pot studies have shown that annual ryegrass has a lower phosphorus requirement than clover (ozanne et al. 1969; Barrow 1975). Consequently, the phosphorus requirement of intensively grazed ryegrass pasture is likely to be less than the phosphorus requirements of clover in traditional clover-ryegrass pastures. Based on research in the region, most of which is unpublished, if fertiliser phosphorus is required it should be applied three weeks after pasture has emerged at the start of the growing season (autumn application) (Arkell 1995; Angell 1999).
Both sulfur and potassium deficiency are common on sandy soils in the region, which have low capacities to retain both elements in the root zone of pasture plants, which typically is no deeper than 20 cm. Consequently, on sandy soils in wet years, leaching of potassium and sulfur below the root zone induces deficiency, reducing pasture production (potassium, Bolland et al. 2002; Bolland and Guthridge 2009; sulfur, Bolland et al 2003). plant roots take up sulfate-sulfur present in soil solution which, in the growing season, is mineralised from the abundant soil organic matter usually present in the topsoils of high rainfall pastures or dissolved from single superphosphate (9.1 per cent p, 10.5 per cent S) applied in autumn (Barrow 1966).
previous field studies have determined the fertiliser potassium requirements of clover and ryegrass in traditional clover- ryegrass pastures. the results have shown that clover is very sensitive to potassium deficiency, which reduces both clover DM production and seed production, so deficiency results in clover rapidly disappearing from the pasture (Bolland et al. 2002;
Bolland and Guthridge 2009). However, ryegrass DM responses to applied potassium are rare and smaller than clover DM responses (Bolland et al. 2002; Bolland and Guthridge 2009).
the extent of potassium and sulfur leaching, and resulting pasture yield decreases due to induced potassium and sulfur deficiency, depend on rainfall and cannot be predicted. For traditional clover-ryegrass pastures, the solution is to always apply fertiliser potassium in autumn each year, which is usually only required for clover (Bolland et al. 2002), and always apply fertiliser sulfur after July each year (Bolland et al 2003).
Despite the above recommendations for applying phosphorus, potassium and sulfur to traditional clover-ryegrass pastures, many farmers apply fertiliser phosphorus, potassium and sulfur to these pastures twice a year, in autumn and in late winter/early spring (hereafter called spring), to ensure adequate nutrients for pasture production throughout the growing season, and for silage and hay production in spring (Angell 1999).
Recent local research on intensively grazed ryegrass pastures has shown that, in addition to fertiliser nitrogen, fertiliser sulfur also needs to be applied after each grazing, with the required ratio being between 3-4N and 1S (M. D. A. Bolland and I. F.
Guthridge, unpublished data).
Despite soil and plant testing invariably indicating these pastures are unlikely to be phosphorus and potassium deficient, farmers also apply low levels of fertiliser phosphorus and potassium after each grazing. to evaluate this strategy, separate phosphorus and potassium experiments were undertaken between May
2006 and June 2010 on intensively grazed ryegrass pastures on soils with adequate soil test p.
For the experiments, there was a nil treatment (no fertiliser phosphorus or potassium applied for the duration of the experiments) and three phosphorus or potassium levels were applied by three different methods in each growing season: all in autumn, half in autumn and half in spring, one sixth applied in autumn and after each of the next five grazings, there typically being at least five grazings in each growing season.
For the phosphorus experiment, located at three sites, we hypothesised no ryegrass DM response to applied phosphorus would be obtained when soil test p was above the critical value for each soil type and, when no fertiliser phosphorus is applied, soil test p would decline gradually and phosphorus deficiency would take some time to develop. A recent small plot mowing study undertaken on perennial Ryegrass (Lolium perenne L.) pastures in north-western tasmania, with adequate soil test p, showed no ryegrass DM responses to applied fertiliser phosphorus, regardless of the phosphorus level applied or how it was applied, including when small levels of phosphorus were applied after each defoliation (Burkitt et al. 2010).
For the potassium experiment, located at two sites, we hypothesised ryegrass DM response to applied potassium would be rare and soil potassium testing would be unreliable for indicating when fertiliser potassium needed to be applied.
plant testing is an alternative.
the experiments were grazed rather than mown because, while grazing, cows deposit faeces and urine onto pasture, with faeces supplying phosphorus and urine supplying potassium (Barrow 1967), as occurs on farms, so the data are relevant for intensively grazed ryegrass pastures.
the results of the experiments are reported in this report.
Materials and methods
Location of experiments and some soil properties
the same phosphorus experiment was located at three sites: paddock 41 on the Mottershead farm, Witchcliffe;
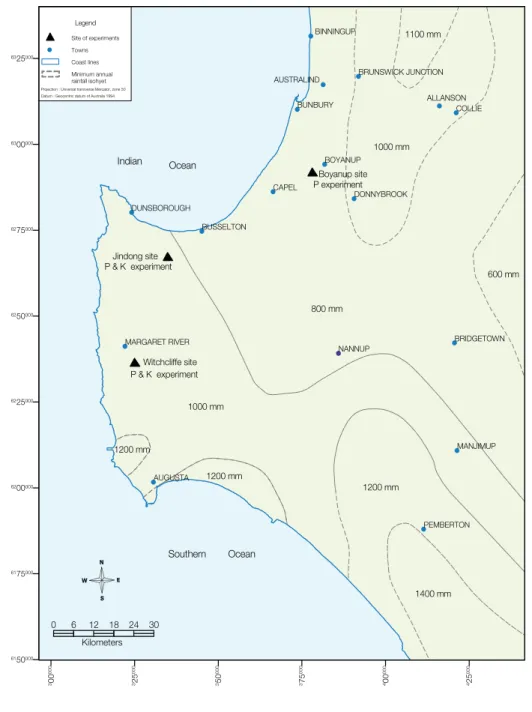
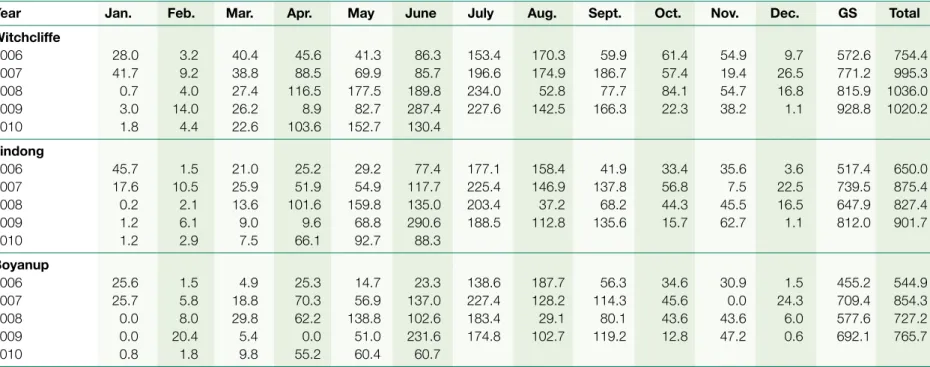
paddock 38 on the evans farm, Jindong; paddock 30 on the Rodwell farm, Boyanup. the same potassium experiment was located at two sites: adjacent to the phosphorus experiment in paddock 41 on the Mottershead farm, Witchcliffe, and paddock 50 on the evans farm, Jindong. the location of the sites, together with average annual rainfall, is indicated in Fig. 1. For the duration of the experiments, monthly rainfall, growing season (May-october) rainfall and total annual rainfall are listed in table 1. Soil classification, soil texture and some soil properties are listed in table 2.
Experimental details
Both the phosphorus and potassium experiments had the same design and comprised completely randomised blocks of ten treatments replicated three times, giving a total of 30 plots. each plot was 10 m by 10 m. the 10 treatments were a nil treatment (no fertiliser phosphorus or potassium applied in each growing season) and three phosphorus or potassium levels applied by three different methods in each growing season.
AUGUSTA MARGARET RIVER DUNSBOROUGH
NANNUP
PEMBERTON MANJIMUP BRIDGETOWN CAPEL
BOYANUP
DONNYBROOK AUSTRALIND BRUNSWICK JUNCTION
BINNINGUP
ALLANSON
BUSSELTON
BUNBURY COLLIE
1200 mm 1200 mm
1000 mm
1200 mm
1400 mm 800 mm
600 mm 1000 mm
1100 mm
Boyanup site
Jindong site
Witchcliffe site
Legend Site of experiments Towns Coast lines Minimum annual rainfall isohyet
Indian Ocean
Southern Ocean
0 6 12 18 24 30
Kilometers
300000 325000 350000 375000 400000 425000
6150000
6175000
6200000
6225000
6250000
6275000
6300000
6325000
Projection : Universal transverse Mercator, zone 50 Datum : Geocentric datum of Australia 1994
P experiment
P & K experiment
P & K experiment
Figure 1 Map showing the location for the 3 sites of the phosphorus (P) experiment (Witchcliffe, Jindong and Boyanup) and for the 2 sites of the potassium (K) experiment (Witchcliffe and Jindong) in the dairy areas of south-western Australia, and average annual rainfall.
the three levels applied in each growing season were 10, 20 and 30 kg p/ha or 50, 75 and 100 kg K/ha, typical levels applied during the growing season on dairy pastures in the region. the phosphorus was applied as triple superphosphate (20 per cent total phosphorus, 80 per cent being initially water-soluble) and potassium was applied as potassium chloride (muriate of potash, 50 per cent potassium).
the three methods of applying phosphorus or potassium in each growing season were: (i) 10, 20 and 30 kg phosphorus/ha or 50, 75 and 100 kg potassium/ha all applied in autumn (three weeks after pasture emerged at the start of the growing season, before the first grazing); (ii) half of each level (5, 10 and 15 kg
phosphorus/ha or 25, 37.5 and 50 kg potassium/ha) applied in autumn and half in spring; and (iii) one sixth of each level (1.67, 3.33 and 5 kg phosphorus/ha or 8.33, 12.5 and 16.67 kg potassium/ha) applied in autumn and after each of the next five grazings in each growing season.
the phosphorus experiment was continued at all three sites in the 2010 growing season before it was terminated on 30 June 2010. there were two grazings at the Witchcliffe and Jindong sites and one grazing at the Boyanup site.
only the potassium experiment at the Witchcliffe site was continued into 2010, when there were two grazings before it was terminated on 30 June 2010.
Table 1 Monthly, growing season (GS, May-October) and total annual rainfall (mm) recorded near the 3 sites of the phosphorus (P) experiment and 2 sites of the potassium (K) when the experiments were conducted (May 2006 to 30 June 2010)
Year Jan. Feb. Mar. Apr. May June July Aug. Sept. Oct. Nov. Dec. GS Total
Witchcliffe
2006 28.0 3.2 40.4 45.6 41.3 86.3 153.4 170.3 59.9 61.4 54.9 9.7 572.6 754.4
2007 41.7 9.2 38.8 88.5 69.9 85.7 196.6 174.9 186.7 57.4 19.4 26.5 771.2 995.3
2008 0.7 4.0 27.4 116.5 177.5 189.8 234.0 52.8 77.7 84.1 54.7 16.8 815.9 1036.0
2009 3.0 14.0 26.2 8.9 82.7 287.4 227.6 142.5 166.3 22.3 38.2 1.1 928.8 1020.2
2010 1.8 4.4 22.6 103.6 152.7 130.4
Jindong
2006 45.7 1.5 21.0 25.2 29.2 77.4 177.1 158.4 41.9 33.4 35.6 3.6 517.4 650.0
2007 17.6 10.5 25.9 51.9 54.9 117.7 225.4 146.9 137.8 56.8 7.5 22.5 739.5 875.4
2008 0.2 2.1 13.6 101.6 159.8 135.0 203.4 37.2 68.2 44.3 45.5 16.5 647.9 827.4
2009 1.2 6.1 9.0 9.6 68.8 290.6 188.5 112.8 135.6 15.7 62.7 1.1 812.0 901.7
2010 1.2 2.9 7.5 66.1 92.7 88.3
Boyanup
2006 25.6 1.5 4.9 25.3 14.7 23.3 138.6 187.7 56.3 34.6 30.9 1.5 455.2 544.9
2007 25.7 5.8 18.8 70.3 56.9 137.0 227.4 128.2 114.3 45.6 0.0 24.3 709.4 854.3
2008 0.0 8.0 29.8 62.2 138.8 102.6 183.4 29.1 80.1 43.6 43.6 6.0 577.6 727.2
2009 0.0 20.4 5.4 0.0 51.0 231.6 174.8 102.7 119.2 12.8 47.2 0.6 692.1 765.7
2010 0.8 1.8 9.8 55.2 60.4 60.7
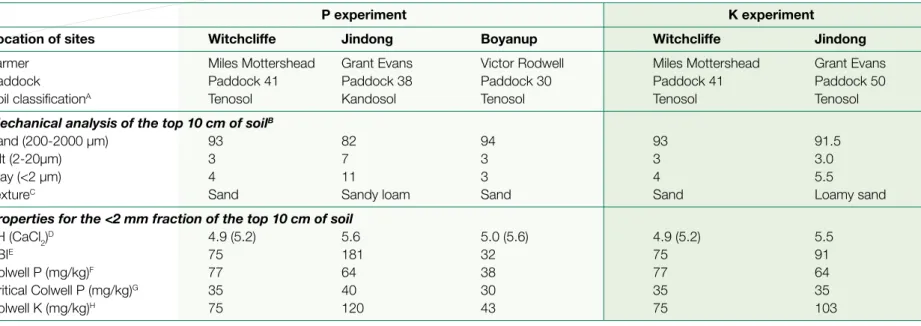
Table 2 Location, soil classification, soil texture, and some properties of soil for the 3 sites of the phosphorus (P) experiment and 2 sites of the potassium (K) experiment, as measured on samples of the top 10 cm of soil collected May 2006 before the experiments started
the phosphorus and potassium experiments were located adjacent to one another at the Witchcliffe site; the phosphorus and potassium experiments at the Jindong site were located on different sandy soils in different paddocks; lime was applied in the dry period between the 2006 and 2007 growing seasons when soil pH was <5.5, and so was applied to paddock 41 at the Witchcliffe site and to paddock 30 at the Boyanup site, and for these 2 sites, soil pH after liming is shown in brackets
P experiment K experiment
Location of sites Witchcliffe Jindong Boyanup Witchcliffe Jindong
Farmer Miles Mottershead Grant Evans Victor Rodwell Miles Mottershead Grant Evans
Paddock Paddock 41 Paddock 38 Paddock 30 Paddock 41 Paddock 50
Soil classificationA Tenosol Kandosol Tenosol Tenosol Tenosol
Mechanical analysis of the top 10 cm of soilB
Sand (200-2000 µm) 93 82 94 93 91.5
Silt (2-20µm) 3 7 3 3 3.0
Clay (<2 µm) 4 11 3 4 5.5
TextureC Sand Sandy loam Sand Sand Loamy sand
Properties for the <2 mm fraction of the top 10 cm of soil
pH (CaCl2)D 4.9 (5.2) 5.6 5.0 (5.6) 4.9 (5.2) 5.5
PBIE 75 181 32 75 91
Colwell P (mg/kg)F 77 64 38 77 64
Critical Colwell P (mg/kg)G 35 40 30 35 35
Colwell K (mg/kg)H 75 120 43 75 103
AIsbell (2002)
BPlummet method, as modified by Loveday (1974).
CMcDonald et al. (1990).
D1:5 soil:0.01 M CaCl2 (Rayment and Higginson 1992).
EPBI, the Phosphorus Buffering Index (Burkitt et al. 2002).
FColwell (1963).
GDetermined from PBI, as described by Bolland and Russell (2010).
HColwell and Esdaile (1968).
the phosphorus and potassium treatments all applied in autumn were applied at all sites in 2010. For the treatments applied in autumn and spring each year, only the autumn treatments (5, 10 and 15 kg phosphorus/ha, or 25, 37.5 and 50 kg potassium/ha) were applied in 2010 before termination of the experiments. For the phosphorus and potassium treatments applied in autumn and after each of the next five grazings: (i) there was only one grazing in the phosphorus experiment at the Boyanup site so 1.67, 3.33 and 5 kg phosphorus/ha was applied in autumn before the first grazing; (ii) when there were two grazings, 1.67, 3.33 and 5 kg phosphorus/ha or 8.33, 12.5 and 16.67 kg potassium/ha were applied twice, in autumn before the first grazing, and after the first grazing, so totals of 3.34, 6.66 and 10 kg phosphorus/ha or 16.66, 25 and 33.34 kg potassium/ha were applied before termination of the experiment.
In March 2009, a centre pivot was installed in the paddock in which the phosphorus experiment at the Boyanup site was located so pasture in the paddock could be irrigated in the dry November-April period. the paddock was sown to Italian Ryegrass cv. Crusader in March 2009 and to perennial Ryegrass cv. Aber Magic in March 2010.
Basal fertilisers
Basal fertilisers were applied to ensure either phosphorus or potassium were the only nutrients to limit pasture DM production in all years. trace elements were applied to each site three weeks after pasture emerged at the start of the 2006 growing season and were: 5 kg/ha manganese (Mn) as manganese sulfate (32 per cent Mn), 3 kg/ha copper (Cu) as copper sulfate (25 per cent Cu), 2 kg/ha zinc (Zn) as zinc sulfate (22.4 per cent Zn) and 80 g/ha molybdenum (Mo) as sodium molybdate (39 per cent Mo).
Basal fertiliser nitrogen and sulfur were applied to both experiments after each grazing and comprised a mixture of 50 per cent urea (46 per cent nitrogen) and 50 per cent ammonium sulfate (21 per cent nitrogen and 24 per cent sulfur), so the mixture comprised 33.5 per cent nitrogen and 12 per cent sulfur. the ratio of nitrogen and sulfur applied was based on results of field experiments conducted on intensively grazed ryegrass pastures in the region (M. D. A. Bolland and I. F. Guthridge, unpublished data). the recommendation is to apply 1 kg nitrogen/ha per day after each grazing to intensively grazed ryegrass pastures (Bolland and Guthridge 2007b; Staines et al. 2008). Consequently, basal nitrogen and sulfur were applied to supply 1 kg nitrogen/ha per day so, if it was 30 days since the last grazing, 30 kg nitrogen/
ha and 11 kg sulfur/ha, as 90 kg/ha of the urea and ammonium sulfate mixture, was applied after the next grazing.
For the phosphorus experiment, basal fertiliser potassium was applied in autumn and spring of each year, as potassium chloride, with 75 kg potassium/ha being applied at each application, so a total of 150 kg potassium/ha was applied in each growing season.
For the potassium experiment, basal phosphorus fertiliser was applied in autumn and spring each year, as triple superphosphate, with 20 kg phosphorus/ha being applied at each application, so a total of 40 kg phosphorus/ha was applied in each growing season.
Grazing management
When ryegrass plants had 2-3 leaves per tiller, the experiments were grazed by the lactating dairy herd during the about 6-h period between the morning and afternoon milkings. to minimise the opportunity for preferential grazing of the phosphorus or potassium treatments, all pasture in the section of the paddock in which the experiment was located was grazed in common to 3-5 cm, leaving 1.0-1.5 t/ha pasture DM. otherwise, no cows were in the paddocks in which the experiments were located either during the growing season or in the dry period between growing seasons. No silage or hay was produced in the paddock for the duration of the experiments.
Measuring pasture dry matter (DM) yields
the amount of pasture DM on each plot before and after each grazing was calculated using a rising plate meter, similar to that described by earle and McGowan (1979). For each measurement before and after grazing, the meter readings were calibrated with pasture DM yields by cutting the pasture herbage below the plate at ground level and drying the cut herbage for three days at 70oC in a forced-draught oven before weighing.
pasture DM yields shown are for pasture DM consumed by dairy cows because these are the most relevant pasture DM data for dairy production. Subtracting the DM left after grazing from DM measured before grazing provided an estimate of the DM consumed by dairy cows at each grazing. Yield data shown for 2006-2009 are the total DM consumed at all grazings in each growing season, there being 5-8 grazings each year. the experiments were terminated 30 June 2010 so, in 2010, total DM consumed up to the end of June was calculated, there being two grazings for both the phosphorus and potassium experiments at the Witchcliffe and Jindong sites and one grazing for the phosphorus experiments at the Boyanup site.
Soil testing
Before the start of the experiments in May 2006, samples of the top 10 cm of soil were collected at 60 random locations within the area to be used for each site of the phosphorus and potassium experiments. the samples from each site were bulked and air-dried and sent for analysis to the Chemistry Centre (WA) at east perth, Western Australia.
After the experiments started, samples of the top 10 cm of soil were collected each February 2007-2010 during the dry period before fertiliser was applied in the next May-october growing season, the standard sampling depth and time for collecting soil samples for soil testing high rainfall pastures (Russell 2010).
Soil samples were collected at 30 random locations within each plot. the samples from each plot were bulked, air-dried and subsamples of the less than 2 mm fraction were sent for analysis to the major commercial soil and plant testing laboratory in the region, CSBp laboratories at Bibra Lakes, Western Australia.
Sand, silt and clay contents of soil (plummet method, as modified by Loveday 1954) were only measured on soil samples collected before the start of the experiments. the following soil properties were measured for the less than 2 mm fraction of soil collected before the start of the experiments and from each plot at each site February 2007-2010: soil pH, as measured in 1:5 soil:0.01 M CaCl2 (Rayment and Higginson 1992); Colwell soil test phosphorus (Colwell 1963); and Colwell soil test potassium (Colwell and esdaile 1968). In addition, the phosphorus buffering index (pBI, Burkitt et al. 2002), used to rank the capacity of soil to retain (sorb) phosphorus, was measured on soil samples collected before the start of the experiments in 2006 and on soil samples collected in February 2010 from each plot of the three sites of the phosphorus experiments. As described by Bolland and Russell (2010), pBI was used to determine critical Colwell soil test phosphorus for soil at each site, which is the
soil test phosphorus that was required to produce 95 per cent of the maximum pasture DM yield.
Plant testing ryegrass samples collected from nil plots at the start of the 2010 growing season
Before termination of the phosphorus and potassium experiments in the 2010 growing season, pasture samples were collected for plant testing just before grazing. Ryegrass herbage samples were collected from the nil-phosphorus treatment of the phosphorus experiment and the nil-potassium treatment of the potassium experiment. Using district practice, young tissue 5 cm above the soil surface was collected, representing the pasture typically consumed by lactating dairy cows at the next grazing. the 40-50 samples collected from each plot were bulked and dried in a forced-draught oven at 50ºC for two days.
the dried samples were ground and sent to CSBp laboratories for analysis. Subsamples of the dried ground herbage were dissolved in a nitric acid and perchloric acid mixture (Yuen and pollard 1954) and concentrations of elements in the digest were measured by inductively coupled plasma-atomic emission spectrometry (ICp-AeS) (Zarcinas et al. 1987). the concentration of the following elements was measured in dried herbage and reported: nitrogen (N), phosphorus (p), potassium (K), sulfur (S), copper (Cu), zinc (Zn), manganese (Mn), iron (Fe), calcium (Ca), magnesium (Mg) and boron (B).
Analysis of data
ANoVA (GeNStAt 2006) was used to compare means of treatments.
For the nil-phosphorus treatment of the phosphorus experiment, data for the relationship between soil test phosphorus and the years in which no fertiliser phosphorus was applied was adequately described by linear regression. For soil at each site, the negative slope of the line provided an indication of the decrease in soil test phosphorus per year when no fertiliser phosphorus was applied.
Page 13
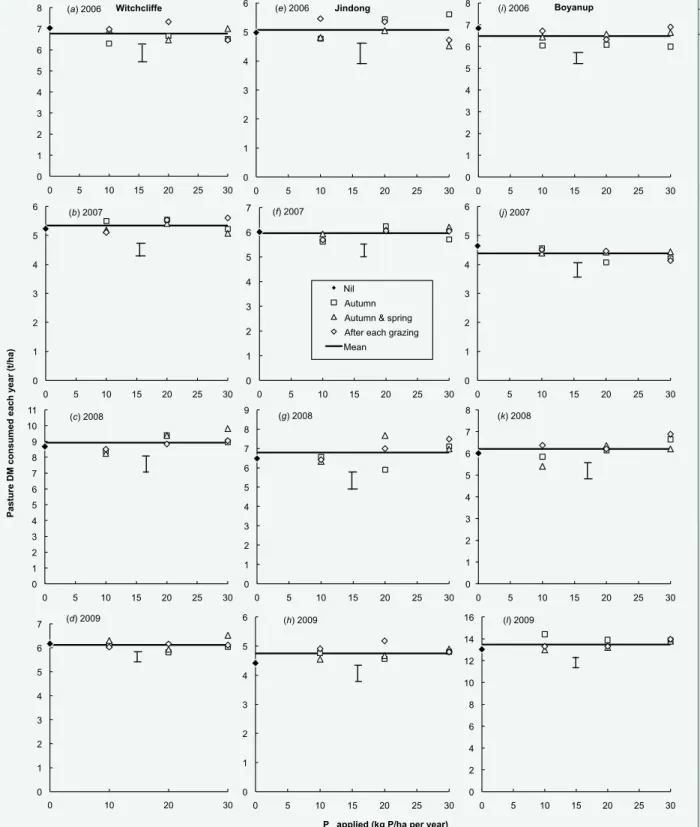
Figure 2 Relationship between total pasture dry matter (DM) consumed at all grazings in each year and the phosphorus (P) level applied during 2006-2009 for the 3 sites of the P experiment for the nil-P treatment (♦) and the 3 P levels applied each growing season (10, 20 and 30 kg P/ha) applied either all in autumn (□), half in autumn and spring (∆), and one sixth was applied in autumn and after each of the first 5 grazings in each year (◊). Vertical bars indicate l.s.d. at P = 0.05. At the Boyanup site in 2009, data are for Italian ryegrass cv. Crusader which was rain-fed April-October 2009, and irrigated from November 2009-January 2010.
0 1 2 3 4 5 6 7 8
0 5 10 15 20 25 30
(a) 2006
0 1 2 3 4 5 6
0 5 10 15 20 25 30
(b) 2007
0 1 2 3 4 5 6 7 8 9 10 11
0 5 10 15 20 25 30
Pasture DM consumed each year (t/ha)
(c) 2008
0 1 2 3 4 5 6 7
0 10 20 30
(d) 2009
0 1 2 3 4 5 6
0 5 10 15 20 25 30
(e) 2006
0 1 2 3 4 5 6 7
0 5 10 15 20 25 30
(f) 2007
Nil Autumn Autumn & spring After each grazing Mean
0 1 2 3 4 5 6 7 8 9
0 5 10 15 20 25 30
(g) 2008
0 1 2 3 4 5 6
0 5 10 15 20 25 30
(h) 2009
0 1 2 3 4 5 6 7 8
0 5 10 15 20 25 30
(i) 2006
Witchcliffe Jindong Boyanup
0 1 2 3 4 5 6
0 5 10 15 20 25 30
(j) 2007
0 1 2 3 4 5 6 7 8
0 5 10 15 20 25 30
(k) 2008
0 2 4 6 8 10 12 14 16
0 5 10 15 20 25 30
(l) 2009
Results
Phosphorus experiment
Pasture DM responses to applied phosphorus
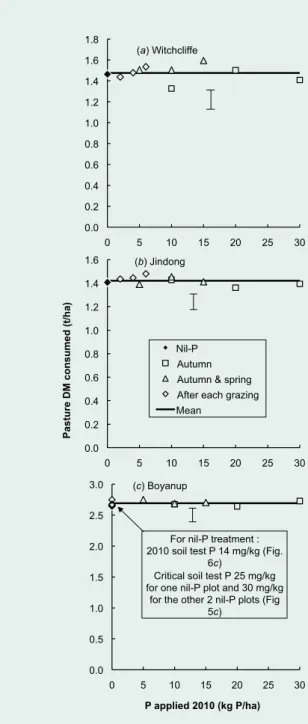
No significant pasture DM responses to applied phosphorus were obtained at any of the three sites of the phosphorus experiment for all grazings in 2006-2009 (Fig. 2) or for the first one or two grazings in 2010 (Fig. 3).
Growing season (May-october) and total annual rainfall was largest at the Witchcliffe site, followed by the Jindong sites (paddock 38 and 50) and was lowest for the Boyanup site (table 1). total pasture consumed each year was mostly largest for Witchcliffe, followed by Jindong and smallest at Boyanup (Fig. 1). Consumed pasture DM was largest at the Boyanup site in 2009 after installation of the centre pivot in early 2009 so the pasture was irrigated in the dry November 2009 to January 2010 period when no rain- fed pasture could be grown at the Witchcliffe and Jindong sites.
Soil test phosphorus
these are soil test phosphorus levels measured on soil samples collected February 2007-2010. For each phosphorus level applied in each growing season, soil test phosphorus was not significantly different for the three methods of applying phosphorus (all in autumn, half in autumn and spring, one sixth in autumn and after each of the next five grazings). Consequently, for each phosphorus level, mean soil test phosphorus is shown for the three phosphorus application methods.
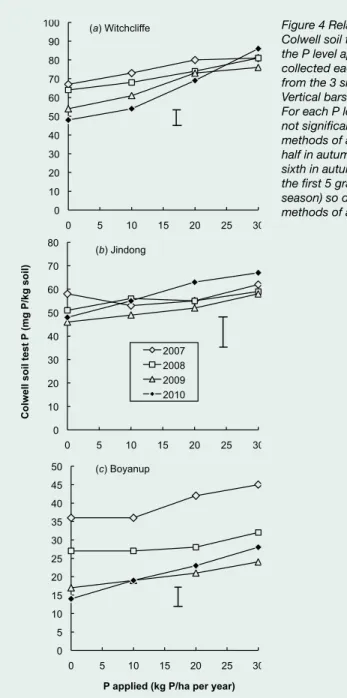
Within each year at the Witchcliffe and Boyanup sites, there was a general trend for soil test phosphorus to increase as more phosphorus was applied, and some of these trends were significant (Fig. 4a and 4c). Within the large errors for data at the Jindong site, there were no significant trends or differences (Fig. 4b).
For the nil-phosphorus and 10 kg phosphorus/ha per year treatments at the Witchcliffe site, soil test phosphorus declined with increasing years from 2007-2010, with differences between years not being significant when 20 and 30 kg phosphorus/ha per year were applied (Fig. 4a).
At the Boyanup site, soil test phosphorus declined from 2007- 2009 for all the phosphorus treatments (nil-phosphorus and the three phosphorus levels applied), with the 2010 data not being significantly different to the 2009 data (Fig 4c).
PBI, and critical Colwell soil test phosphorus
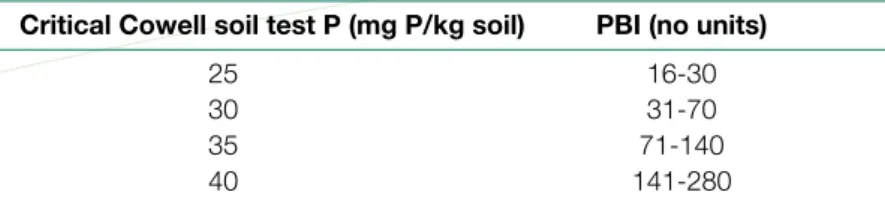
Based on all available data for various sandy soil types of south-western Australia, critical Colwell soil test p has recently been summarised for different soils with different capacities to sorb phosphorus as ranked using pBI (Summers and Weaver 2006). table 3 lists critical soil test phosphorus and pBI values for the major soils types in the dairy areas of the region. If pBI for a sandy soil in the region is 48, then critical Colwell soil test phosphorus for that soil is 30 mg/kg (table 3). In this fashion,
Figure 3 Relationship between cumulative pasture dry matter (DM) consumed in 2010 and the phosphorus (P) level applied for the Witchcliffe (a), Jindong (b) and Boyanup (c) sites of the P experiment.
Data are for the first 2 grazings at Witchcliffe and Jindong. There was only 1 grazing at Boyanup. For all 3 sites, data are for the nil-P treatment (♦) and when 10, 20 and 30 kg P/ha were applied all in autumn (□), and when only the autumn applications (5, 10 and 15 kg P/ha) were applied in the autumn and spring P application treatment (∆). For the treatment treated with P in autumn and after the first 5 grazings in each year (◊), only 1.67, 3.33 and 5 kg P/ha were applied in autumn before the first grazing at Witchcliffe, Jindong and Boyanup, and 1.67, 3.33 and 5 kg P/
ha was applied after the first grazing at Witchcliffe and Jindong. Vertical bars indicate l.s.d. at P = 0.05. At the Boyanup site, data are for perennial ryegrass (Lolium perenne L. cv. Aber Magic).
0.0 0.2 0.4 0.6 0.8 1.0 1.2 1.4 1.6 1.8
0 5 10 15 20 25 30
(a) Witchcliffe
0.0 0.2 0.4 0.6 0.8 1.0 1.2 1.4 1.6
0 5 10 15 20 25 30
Pasture DM consumed (t/ha)
(b) Jindong
Nil-P Autumn Autumn & spring After each grazing Mean
0.0 0.5 1.0 1.5 2.0 2.5 3.0
0 5 10 15 20 25 30
P applied 2010 (kg P/ha) (c) Boyanup
For nil-P treatment : 2010 soil test P 14 mg/kg (Fig.
6c)
Critical soil test P 25 mg/kg for one nil-P plot and 30 mg/kg
for the other 2 nil-P plots (Fig 5c)
15
Table 3 Critical Colwell soil test phosphorus (P) for sandy soils in the dairy areas of south-western Australia as determined from the phosphorus buffering index (PBI) used to rank the capacity of the soils to sorb P (from Summers and Weaver 2006)
Critical soil test values listed are for 95 per cent of the maximum p non- limiting yield
Critical Cowell soil test P (mg P/kg soil) PBI (no units)
25 16-30
30 31-70
35 71-140
40 141-280 0
10 20 30 40 50 60 70 80 90 100
0 5 10 15 20 25 30
(a) Witchcliffe
0 10 20 30 40 50 60 70 80
0 5 10 15 20 25 30
Colwell soil test P (mg P/kg soil)
(b) Jindong
2007 2008 2009 2010
0 5 10 15 20 25 30 35 40 45 50
0 5 10 15 20 25 30
P applied (kg P/ha per year) (c) Boyanup
Figure 4 Relationship between Colwell soil test phosphorus (P) and the P level applied for soil samples collected each February 2007-2010 from the 3 sites of the P experiment.
Vertical bars indicate l.s.d. at P = 0.05.
For each P level applied, data were not significantly different for the 3 methods of applying P (all in autumn, half in autumn and spring, and one sixth in autumn and after each of the first 5 grazings in each growing season) so data are the mean of the 3 methods of applying P.
using pBI and soil test phosphorus measured before the start of the phosphorus and potassium experiments at each site, critical Colwell soil test phosphorus (mg/kg) was 40 for soil in paddock 38 at the Jindong site, was 35 for soil in paddock 41 at the Witchcliffe site and for soil in paddock 50 at the Jindong site, and was 30 for soil in paddock 30 at the Boyanup site (table 2).
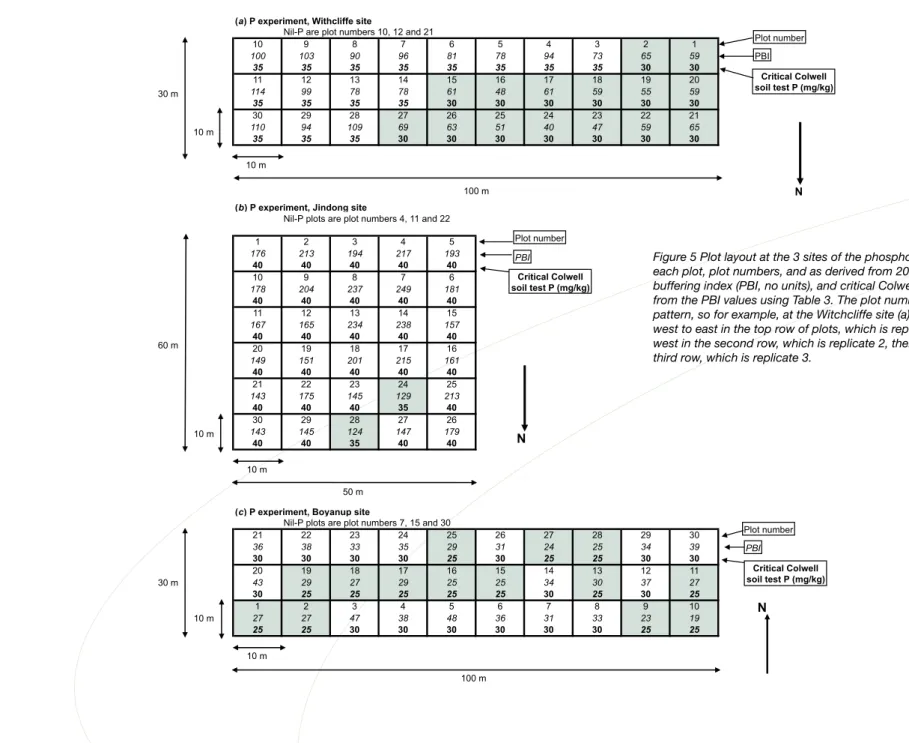
For pBI and soil test phosphorus measured on soil samples collected in 2010, table 3 was used to determine critical Colwell soil test phosphorus for each plot at the three sites of the phosphorus experiment (Fig. 5). Spatial variation in pBI was large at all the sites and resulted in two critical soil test phosphorus values being determined for each site. only two of the 30 plots had different critical soil test phosphorus values at the Jindong site, compared with about half the plots having different values at the Witchcliffe and Boyanup sites. Summary of the data shown in Fig. 5 are as follows:
• Witchcliffe, mean PBI 75 (range 40-114), critical soil test phosphorus is 30 mg/kg for 15 plots and 35 mg/kg for 15 plots.
• Jindong, mean PBI 181 (range 124-249), critical soil test phosphorus is 35 mg/kg for 2 plots and 40 mg/kg for 28 plots.
(a) P experiment, Withcliffe site
Nil-P are plot numbers 10, 12 and 21
10 9 8 7 6 5 4 3 2 1
100 103 90 96 81 78 94 73 65 59
35 35 35 35 35 35 35 35 30 30
11 12 13 14 15 16 17 18 19 20
114 99 78 78 61 48 61 59 55 59
35 35 35 35 30 30 30 30 30 30
30 29 28 27 26 25 24 23 22 21
110 94 109 69 63 51 40 47 59 65
35 35 35 30 30 30 30 30 30 30
(b) P experiment, Jindong site
Nil-P plots are plot numbers 4, 11 and 22
1 2 3 4 5
176 213 194 217 193
40 40 40 40 40
10 9 8 7 6
178 204 237 249 181
40 40 40 40 40
11 12 13 14 15
167 165 234 238 157
40 40 40 40 40
20 19 18 17 16
149 151 201 215 161
40 40 40 40 40
21 22 23 24 25
143 175 145 129 213
40 40 40 35 40
30 29 28 27 26
143 145 124 147 179
40 40 35 40 40
(c) P experiment, Boyanup site
Nil-P plots are plot numbers 7, 15 and 30
21 22 23 24 25 26 27 28 29 30
36 38 33 35 29 31 24 25 34 39
30 30 30 30 25 30 25 25 30 30
20 19 18 17 16 15 14 13 12 11
43 29 27 29 25 25 34 30 37 27
30 25 25 25 25 25 30 25 30 25
1 2 3 4 5 6 7 8 9 10
27 27 47 38 48 36 31 33 23 19
25 25 30 30 30 30 30 30 25 25
Plot number
Critical Colwell soil test P (mg/kg)
N PBI
10 m
100 m 30 m
10 m
N
Plot number
Critical Colwell soil test P (mg/kg)
PBI
50 m 10 m
10 m 60 m
Plot number
Critical Colwell soil test P (mg/kg)
N
PBI
100 m 10 m
10 m 30 m
Figure 5 Plot layout at the 3 sites of the phosphorus (P) experiment, listing within each plot, plot numbers, and as derived from 2010 soil testing, the phosphorus buffering index (PBI, no units), and critical Colwell soil test P (mg/kg) determined from the PBI values using Table 3. The plot numbers were allocated in a ‘snake’
pattern, so for example, at the Witchcliffe site (a), plot numbers increase going from west to east in the top row of plots, which is replicate 1, then increase from east to west in the second row, which is replicate 2, then increase from west to east in the third row, which is replicate 3.
• Boyanup, mean pBI 32 (range 19-48), critical soil test phosphorus is 25 mg/kg for 14 plots and 30 mg/kg for 16 plots.
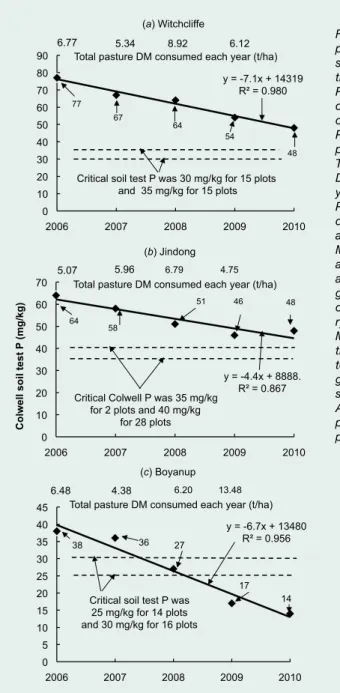
Soil test P for the nil-phosphorus treatment
For the nil-phosphorus treatment at all three sites of the phosphorus experiment, soil test phosphorus significantly declined gradually each year when no phosphorus was applied but remained above the critical soil test value for the soil at the Witchcliffe and Jindong sites (Figs. 6a and 6b). However, for soil at the Boyanup site, soil test phosphorus for the nil-phosphorus treatment was above the critical value in 2006 and 2007, was about similar to the critical value in 2008 and declined below the critical value in 2009 and 2010 (Fig. 6c).
the slope of the linear equation fitted to data in Fig. 6 for the relationship between soil test phosphorus for the nil- phosphorus treatment and the years in which no phosphorus was applied provides an estimate for the rate of decline in soil test phosphorus per year when no fertiliser phosphorus was applied. the rate of decline was (mg/kg per year) 7.1 for soil at the Witchcliffe site (pBI 75), 6.7 for soil at the Boyanup site (pBI 32) and 4.4 for soil at the Jindong site (pBI 181) (Fig. 6), with the rate of decline being smallest for the highest phosphorus sorbing soil.
Potassium experiment
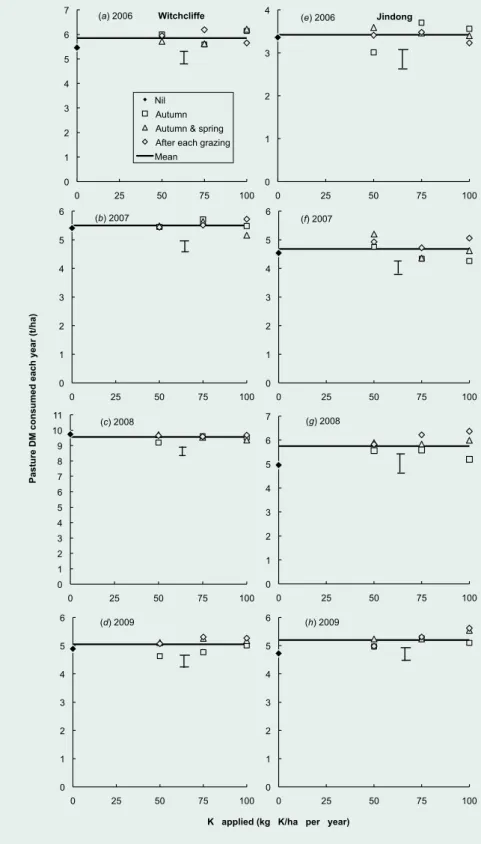
Pasture DM responses to applied potassium
No significant pasture DM responses to applied potassium were obtained 2006-2009 at either site of the potassium experiments (Fig. 7). For the Jindong site in 2008 and 2009, despite total pasture DM consumed at all grazings being lower for the nil-potassium treatment, differences in yield among the 10 treatments in these years were not significant (Fig. 7g and h). As measured for two grazings at the Witchcliffe site in 2010,
y = -7.1x + 14319 R = 0.980
0 10 20 30 40 50 60 70 80 90
2006 2007 2008 2009 2010
(a) Witchcliffe
48 54
67 64 77
y = -4.4x + 8888.
R = 0.867
0 10 20 30 40 50 60 70
2006 2007 2008 2009 2010
Colwell soil test P (mg/kg)
(b) Jindong
46 48
51
64 58
y = -6.7x + 13480 R = 0.956
0 5 10 15 20 25 30 35 40 45
2006 2007 2008 2009 2010
(c) Boyanup
5.07 5.96 6.79 4.75
6.48 4.38 6.20 13.48
38 36 27
17 14
6.77 5.34 8.92 6.12
Critical soil test P was 25 mg/kg for 14 plots and 30 mg/kg for 16 plots Critical Colwell P was 35 mg/kg
for 2 plots and 40 mg/kg for 28 plots
Critical soil test P was 30 mg/kg for 15 plots and 35 mg/kg for 15 plots Total pasture DM consumed each year (t/ha)
Total pasture DM consumed each year (t/ha)
Total pasture DM consumed each year (t/ha)
Figure 6 Decline in soil test phosphorus (P) measured on soil samples collected from the nil-P treatment at the 3 sites of the P experiment. Dashed lines are critical Colwell soil test P for 95%
of the maximum yield below which P deficiency is likely to reduce pasture dry matter (DM) production.
There were no significant pasture DM responses to applied P in all years at all 3 sites so yields for all P treatments were not significantly different regardless of P level applied or how the P was applied.
Mean total pasture DM consumed at all grazings in each year are listed at the top of each year of each graph. For the site at Boyanup, a centre pivot was installed and Italian ryegrass cv. Crusader was sown in March 2009 in the paddock in which the experiment was located so mean total pasture DM consumed at all grazings (13.48 t/ha) listed for this site in 2009 are for all grazings from April 2009 to January 2010, with the pasture being irrigated in the dry period after November 2009.
Page18
0 1 2 3 4
0 25 50 75 100
Nil Autumn Autumn & spring After each grazing Mean
0 1 2 3 4 5 6
0 25 50 75 100
Pasture DM consumed each year (t/ha)
(b) 2007
0 1 2 3 4 5 6 7 8 9 10 11
0 25 50 75 100
(c) 2008
0 1 2 3 4 5 6
0 25 50 75 100
(d) 2009
0 1 2
0 25 50 75 100
0 1 2 3 4 5 6
0 25 50 75 100
(f) 2007
0 1 2 3 4 5 6 7
0 25 50 75 100
(g) 2008
0 1 2 3 4 5 6
0 25 50 75 100
K applied (kg K/ha per year) (h) 2009
Figure 7 Relationship between total pasture dry matter (DM) consumed at all grazings in each year and the potassium (K) level applied during 2006-2009 growing seasons for the 2 sites of the K experiment. Data in each year of each site are for the nil-P treatment (♦) and the 3 K levels applied (50, 75 and 100 kg K/ha) each year either all in autumn (□), half in autumn and spring (∆),and one sixth was applied in autumn and after each of the first 5 grazings in each growing season (◊). Vertical bars indicate l.s.d. at P = 0.05.
consumed pasture DM was not lowest for the nil-potassium treatment and differences in yield among the 10 treatments were not significant (Fig. 8).
Soil test potassium
these are soil test potassium measured on soil samples collected February 2007-2010. For each plot of the potassium experiment at each of the two sites, soil test potassium was very variable, with no significant, consistent trends due the potassium level applied or how the potassium was applied within and between years (table 4).
Plant testing nil-phosphorus and nil-potassium plots in the 2010 growing season
plant testing indicated nitrogen, phosphorus, potassium, sulfur, copper, zinc, manganese, iron, calcium, magnesium and boron were adequate to high for ryegrass DM production at the three sites of the p experiment and the Witchcliffe site of the potassium experiment (table 5).
Discussion
Phosphorus experiment
the results from the three sites of the phosphorus experiment support our hypotheses for the experiment:
• When soil test phosphorus was above the critical value for that soil, no significant ryegrass DM responses to applied phosphorus occurred, regardless of the phosphorus level