Opal Vale Pty Ltd (Opal Vale) intends to develop a landfill at this site of the old clay pit at 11 Chitty Road, Toodyay, in one phase. The regional geology and hydrology of the area was reviewed from a literature review of available data for the region obtained from the Geological Survey of Western Australia. This report provides the details of the groundwater investigations and monitoring of the pit installation program, as well as the groundwater quality analytical results for the site.
The reviewed reports should be synthesized into a short form to provide a summary of the groundwater status at the site. Available information should be assessed for correctness and adequacy in terms of proposed development and placement and recording of monitoring wells. Information and data interpretation are presented in this document as a separate report.
LOCATION
Sam Mangione of Opal Vale Pty Ltd requested that Stass Environmental submit a proposal for a groundwater location assessment, baseline groundwater quality database and installation of groundwater monitoring pits at the Opal Vale facility.
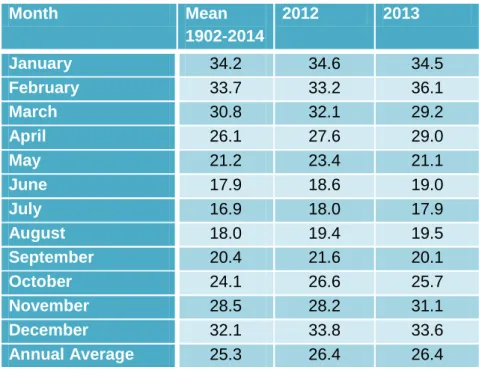
CLIMATE
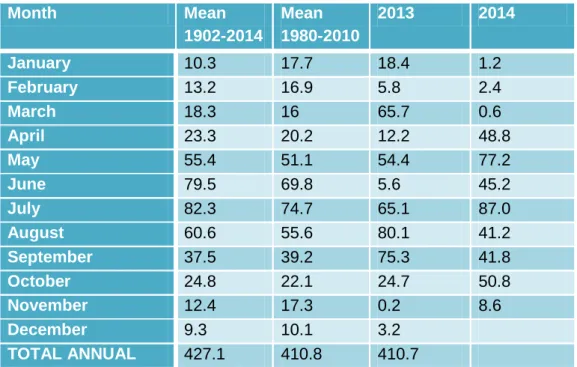
During summer (September-March) a belt of anticyclones extends over the region producing dry easterly winds and high temperatures. During the winter this belt moves north and the prevailing winds blow ashore from the southwest bringing cold temperatures and cold fronts that produce 90% of the region's total annual rainfall. Average annual rainfall ranges between 300mm and 420mm and average daily temperatures range from 17oC to 30oC in summer and 6oC to 17oC in winter.
GEOLOGY AND LANDFORMS
Geology - Regional
This contrast in scale between the metamorphic belts appears to be partly related to their location, with the highest pressure accumulations occurring at the western edge of the craton, associated with ductile shear zones associated with early movement along the Fault Zone. Darling (Blight et al., 1981; Bretan, 1985). Three lower-grade greenstone belts are present near the western margin of the Yilgam Craton;. The sequence is also poorly exposed and the full extent of the belt is unknown.
Granitoids occur as two large batholiths that occupy a significant portion of the southwestern Yilgarn Craton. The granitodes of the Darling Range Batholith are quite diverse and show considerable structural variation. Most granitoids are undeformed, although plutons of porphyritic granite occurring close to the eastern limits of the Chittering and Balingup Metamorphic Belts show evidence of intense ductile shear.
Geology - Site
Soils
R EGIONAL H YDROGEOLOGY – P REVIOUS I NVESTIGATIONS
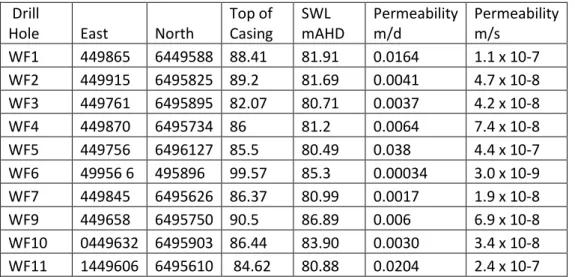
Permeability
The distribution of particle sizes showed that the material in Williamson's Pit consists of a clayey silty sand with minor gravel. The falling head permeability tests for samples compacted to 90% standard compaction at optimum moisture content gave permeability coefficients of 3.12xI0-9 and 1.49x10⁻⁸ meters per m, respectively. second for WF2 and WF4. The compression tests indicate that maximum dry densities of 1.87 and 1.74 tonnes per cubic meters at optimum moisture content of 13% and 17% could be obtained for the material obtained from WF2 and WF4 respectively.
The above tests indicate that the clay can be used as a landfill lining material, if compacted.
REGIONAL GROUNDWATER QUALITY
Further installation of monitoring wells was required as a result of the SAT process in 2013, and a further 5 monitoring wells were installed in April 2013. All fieldwork performed, including a summary of survey methodology used, is summarized in chronological order in the following paragraphs.
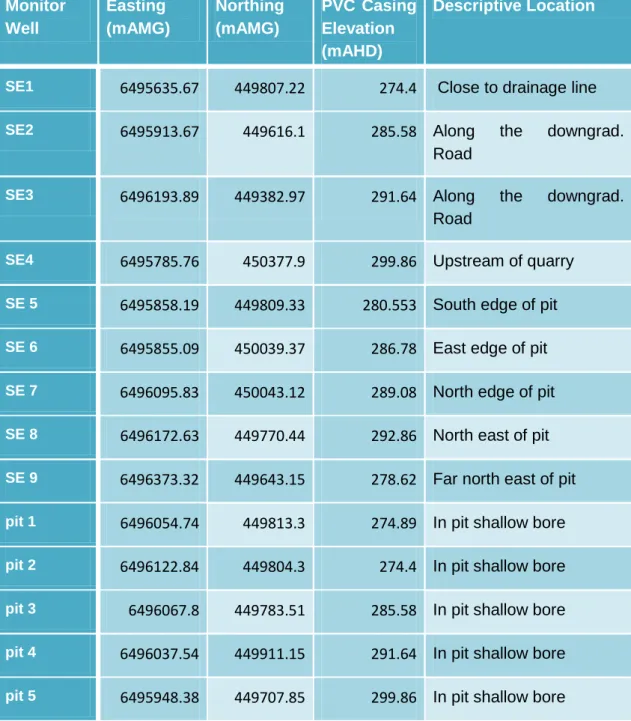
LOCATION OF GROUNDWATER MONITOR WELLS
- Previously Installed Monitor Wells
- Monitor Well Site Selection
- Drilling
- Development
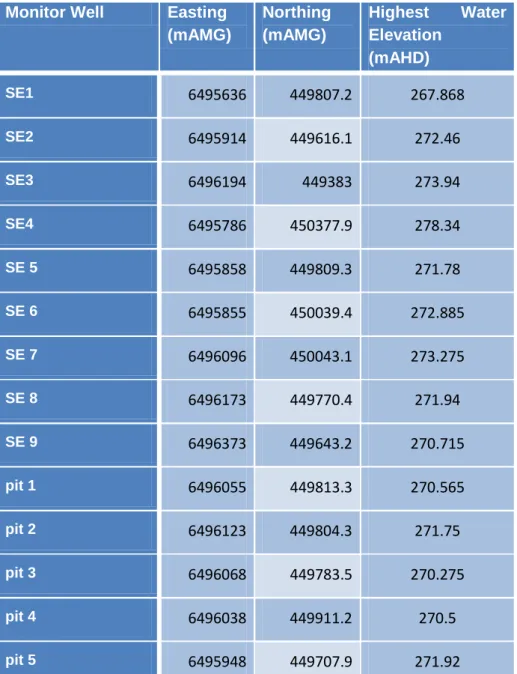
- Position and level survey
Casing was inserted and sand filled to one meter above the slotted interval (see Figures 8 to 17). Bentonite pellets were placed directly over the sand fill and measured with a weighted tape until a one meter thick seal was formed. The annulus of the hole was filled with local excavated materials mixed with cement grout on the soil surface and sealed with bentonite on the soil surface to prevent leakage of surface water into the groundwater.
A cement pad measuring 300 mm from the center of the drill ring was also placed to further reduce the potential for surface water to short into the drill ring. Steel protective surface covers projecting approx. 600 mm above ground level, was also installed over all PVC houses and lockable with padlocks. During the level survey, elevations of each monitor well were obtained from the highest point on the well's protective cover opening, which was also permanently marked for future reference.
W ATER L EVEL M EASUREMENT
Purging and Sampling
Groundwater samples were taken from the 9 new monitoring wells at a total of 4 locations on and around the site. After withdrawing the submersible pump, groundwater samples were collected in lab-supplied and preservative-treated containers from each monitor well. All samples were stored on ice and transported to MGT Eurofins laboratories in Melbourne for analysis with proper traceability documentation.
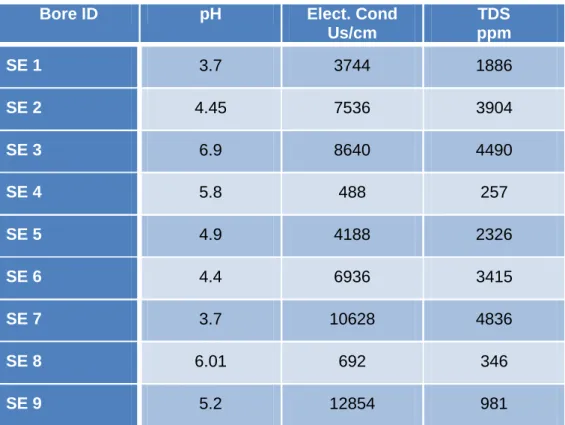
Field Water Quality Data
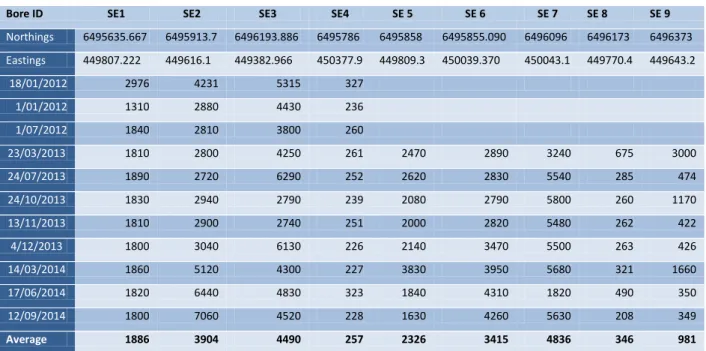
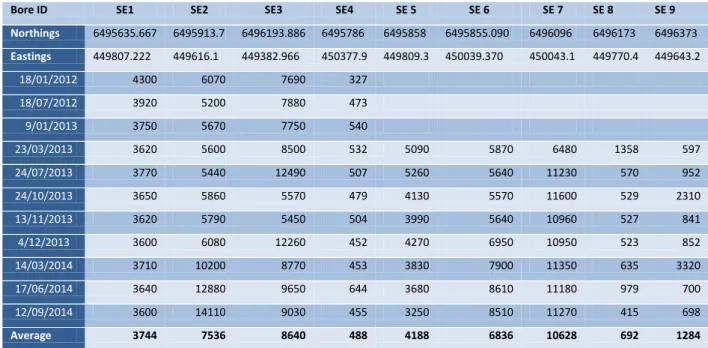
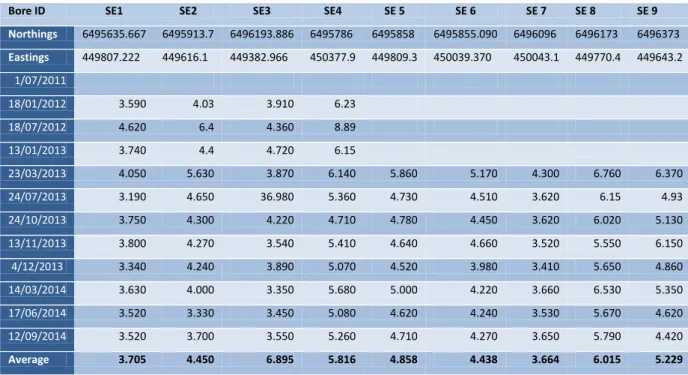
From the water quality results in the field, it can be seen that 9 wells installed around the site intersected two different groundwater aquifers. Wells SE-1, SE-2, SE-3, SE-5, SE-6 and SE-7 report poor water quality of a brackish nature, while wells SE-4, SE-8 and SE-9 located relatively fresh waters are reported to the east and north of the site. Field water quality records for field testing of pH, electrical conductivity, and salinity are listed in Tables 7 through 9.
It is worth noting that while most boreholes presented relatively stable water quality, the variation in pH and EC in borehole SE 9 was sometimes significant, with salinity increasing with decreasing acidity (increasing pH) of the groundwater.
A NALYTES
Q UALITY C ONTROL
F IELD D UPLICATES AND B LANK S AMPLES
L ABORATORY C ONTROL S AMPLES , S PIKE R ECOVERIES , D UPLICATES AND B LANKS
M AJOR I ONS AND G ROUNDWATER P ARAMETERS
G ROUNDWATER H YDRAULICS
C ONCEPTUAL H YDROGEOLOGICAL M ODEL
This was confirmed during the drilling of the monitor wells (see geological logs of SE-1 through SE-9), as the groundwater strikes were all well below the actual potentiometric surface. Potentiometric head stabilized relatively close to the surface (within 10 to 20 m of the natural ground surface). This was indicated by the relatively long time (up to 2 days) it took for the monitoring holes to stabilize a SWL after drilling was completed (see cross sections in DWG OV-03-ACW and site plan in DWG OV-02- ACW).
Groundwater chemistry recorded between July 2011 and September 2014 indicates that waters south and southwest of the site are not suitable for human consumption. Groundwater east and northeast of the site is of good quality. The potential primary beneficial use of groundwater in the vicinity of the site is (i) the aquatic environment in Jimperding Brook 900m to the south and south-west, (ii) stock irrigation from Jimperding Brook, (iii) possible future groundwater abstraction at a residence to the north, potentially for domestic purposes (see DWG OV-01-ACW).
G ROUNDWATER FLOW
Direct Calculation for Travel Time from Proposed Landfill to Jimperding Brook
An assumed hydrogeologic connection between the site and Jimperding Creek is used to provide a worst-case scenario for the contamination impact of a sensitive receptor. The receptor route would be along a quartzite geologic structure which would allow groundwater to flow from beneath the proposed landfill and be captured by the base flow of Jimperding Creek. The following model calculation seeks to provide the time period it would take a contaminant to reach the stream under purely advective groundwater flow conditions.
While clay can have porosities on the order of 40%, silt is more likely to be in the 10% range. Note: To calculate the average linear velocity, which we use for groundwater calculations, you need to divide v by porosity. The hydraulic conductivity is assumed to be that of silt (0.08 m/day), which is the worst case scenario, as the lithological material matrix is a silt-clay mix, which can be considered less permeable.
Bioscreen Modelling
The recently installed boreholes are adequately located to define local aquifers and are conveniently positioned for groundwater monitoring below the site. The highest possible potentiometric groundwater surface (measured between July 2011 and September 2014) is below the current pit floor. This observation is related to the significant content of clay in the matrix of geological materials recorded during the installation of groundwater monitoring pits of the area.
Water yield from wells adjacent to the site is likely to be poor due to low permeability of the aquifer/conduit. Static water level (SWL) and groundwater quality should continue to be monitored at quarterly intervals. Head The height of the free surface of a body of water above a given point below the surface.
Porosity The ratio of the volume of voids to the total volume of a rock matrix. Specific yield The volume of water that an unconfined aquifer releases from storage per unit area of the surface. Water table The surface of a body of unconfined groundwater at which the pressure is equal to that of the atmosphere.
The findings presented in this report are relevant to the state of the site and current legislation as of the date of this report. We do not represent or warrant that the conclusions in this report will be valid in the future, as there may be changes in site conditions, applicable laws or other factors that would affect the conclusions in this report. Due to the inherent variability of natural soils, we cannot guarantee that the overall general condition of the site is the same or substantially similar to the representative samples.
Opal Vale is granted an exclusive license to use the report for the purpose described in the report. The results of tests, calibrations and/or measurements contained in this document are traceable to Australian/National Standards. Batch Duplicate A second batch of analysis from a sample outside of the customer sample pool, but performed within the laboratory analysis pool.
Batch SPIKE Spike recovery reported a sample outside of the customer's batch of samples but run within the laboratory batch of analysis. NCP Non-Client Parent - QC performed on samples not relevant to this report, QC is representative of the sequence or batch within which the client samples were analyzed.