Digital Library Digital Library
Bulletins 4000 - Agriculture
11-2003
Sorption of phosphorus by soils : how it is measured in Western Sorption of phosphorus by soils : how it is measured in Western Australia
Australia
Michael D A Bolland D G. Allen
(Chemistry Centre of Western Australia, East Perth) N J. Barrow
CSIRO
Follow this and additional works at: https://researchlibrary.agric.wa.gov.au/bulletins Part of the Other Environmental Sciences Commons, and the Soil Science Commons
Recommended Citation Recommended Citation
Bolland, M D, Allen, D G, and Barrow, N J. (2003), Sorption of phosphorus by soils : how it is measured in Western Australia. Department of Primary Industries and Regional Development, Western Australia, Perth.
Bulletin 4591.
This bulletin is brought to you for free and open access by the Agriculture at Digital Library. It has been accepted for inclusion in Bulletins 4000 - by an authorized administrator of Digital Library. For more information, please contact [email protected].
Bulletin 4591 ISSN 1448-0352 November 2003
SORPTION OF PHOSPHORUS BY SOILS
how it is measured in Western Australia
Disclaimer
The Chief Executive Officer of the Department of
Agriculture and the State of Western Australia accept no
liability whatsoever by reason of negligence or otherwise
arising from the use or release of this information or any
part of it.
MDA Bolland
1, DG Allen
2and NJ Barrow
31Department of Agriculture, Bunbury
2Chemistry Centre (WA), East Perth
3Formerly CSIRO, Wembley
SORPTION OF PHOSPHORUS BY SOILS
how it is measured in Western Australia
Grains Research &
Development Corporation
Contents
Summary 7
Introduction 7
Sorption of P by soils 8
Residual soil P 9
Effect of P sorption on estimating the most profitable amount of fertiliser P to apply 10
Fertiliser P for Western Australian crops and pastures 13
Partially acidulated phosphate rock fertilisers 13
Reactions of P from superphosphate and ammonium phosphate fertilisers with soil 15
Uptake of P by plant roots 17
History of methods used to rank the P sorption capacity of soils in Western Australia 18
Further development of single point P sorption indices 26
Adding Colwell soil test P to PRI 27
Conclusion 27
References 28
Appendix. 30
Summary
Most soils used for agriculture in Western Australia had insufficient indigenous (native) phosphorus (P) for the introduced agricultural plant species used in the region so fertiliser P had to be applied. For the Mediterranean-type climate of south-western Australia, manufactured water-soluble P (WSP) fertilisers are the most effective and profitable sources of P for the soils and plant species used in the region. We describe how the WSP fertilisers are made, and how the P in the fertilisers dissolves and reacts with soil to provide P for plants in the year of application and in the years after application. To predict the amount of P required for a crop or pasture, we need to know how much P the soil can supply (this is P from fertiliser applied in previous years) and how much fertiliser P is needed in the current year to reach optimum yield. Soil tests estimate the amount of P in the soil but in order to know how effective this P is for crop or pasture production we also need to know the capacity of soil to retain or sorb P. The capacity of soil to sorb P also influences the effectiveness of fertiliser P applied in the current year. We explain how soils sorb P and describe the procedures and soil tests used in Western Australia to estimate the capacity of soils to sorb P.
Introduction
Phosphorus (P) is an essential component of cell membranes, plant genetic material and of energy storage and transfer systems for chemical reactions in plant cells. Early plant growth is particularly dependent on P because of the needs for rapid cell division and expansion. The primordia for future stems, roots, leaves, flowers and seed are produced very early in plant growth so P deficiency early during growth of germinating seedlings and plants can greatly reduce yield potentials of crops and pastures.
Roots of all plant species can only take up water-soluble P from soil solution. Plant roots intercept P in moist soil as the roots grow through the soil, and P moves through the soil solution to the root by diffusion. The rate of diffusion depends on the proportion of the P in solution. The smaller the proportion, the slower it moves and so the more P is required to give an adequate rate of P supply.
The proportion in solution depends on the buffering capacity of the soil for P, which is the capacity of the soil to retain or sorb P. The P removed from soil solution by plant roots needs to be replaced and depends on the capacity of the soil to replenish the P. The P is
replaced by: (1) desorption of sorbed P nearby in the soil; (2) P released from soil organic matter as a result of activity of soil organisms on the organic matter; (3) applications of fertiliser to the soil. Both the concentration of P in soil solution (intensity factor), and the capacity of the soil to replenish the soil solution P (capacity factor), need to be considered.
The soils used for agriculture in south-western Australia are amongst the most ancient and highly weathered in the world. In their undeveloped (native) state, most of them contained very low amounts of P. The native plant species have adapted to cope with the very low P status of the soils. However, with the exception of wildflowers, none of the native plant species are profitable in Western Australian agriculture. So native plants were removed and introduced plant species developed in much better soils for agriculture elsewhere were used for agriculture in Western Australia. Most newly-cleared soils used for agriculture in Western Australia had very low concentrations of P in soil solution, and a very low capacity to replace the P taken up from soil solution by plant roots. These soils could not provide enough water-soluble P for profitable production of the introduced annual agricultural plant species unless manufactured water-soluble P fertilisers were applied to the soil.
When no fertiliser P was applied to most newly-cleared Western Australian soils, seedlings of the introduced species grew until the seed P reserves were depleted. Most then died because they could not get sufficient P from the soil to maintain growth and development. The amount of grain of crops or seed of pasture plants produced at the end of the growing season was often less than the amount of seed used to grow the crop or pasture.
Before the development of single superphosphate, the original sources of phosphorus used in agriculture were animal manures, waste vegetable materials, bones, guano and phosphate rocks, which contained little water-soluble P. For P-deficient soils in most of the world, and particularly for newly-cleared Western Australian soils, the original sources of P simply could not provide enough water- soluble P for profitable production of annual crops and pastures.
Therefore, before single superphosphate was developed, most soils in Western Australia could not be used for profitable agriculture.
Only the few soils with sufficient indigenous (native) soil P could be used for agriculture. These were red-brown loam to clay soils developed from freshly exposed rock or alluvium near valley floors, rivers and streams. These soils had enough native soil P for profitable
crop and pasture production without the addition of superphosphate.
Many of the original towns in south-western Australia were developed near these soils, including Balingup, Greenough, Walkaway, Chapman, Northampton, Mullewa, Morawa, Mingenew, Perenjori, Three Springs, Dalwallinu, Northam, York, Beverley, Merredin, Gnowangerup, Ravensthorpe, and Salmon Gums. After superphosphate became readily available in Western Australia during the 1920s, experiments using single superphosphate were conducted on newly cleared versions of the originally more-fertile soil types in Western Australia. The nil-P treatment, which was not treated with superphosphate and so only possessed native P, produced from 40 to 60 per cent of the maximum wheat grain yield. But the native P status of the soils was rapidly depleted as P was removed in product (hay, grain, milk, and meat). So agriculture soon became unprofitable for these soils until superphosphate became available.
Major agricultural development in Western Australia was only possible after single superphosphate became available. The present P status of these soils is therefore largely derived from fertiliser P (mostly single superphosphate, but more recently including triple and double superphosphate, and ammonium phosphate fertilisers) applied to the soils to grow crops and pastures over many years.
Because of the importance of fertiliser P for agriculture in Western Australia, much research has been done to determine the most profitable amount of fertiliser P to apply to crops and pastures in the south-west of the State. To provide fertiliser P advice, knowledge of two relationships is required: (1) the relationship between plant yield and the amount of P applied in the year of application (the yield response curve); (2) the relationship between plant yield and soil test P (the soil P test calibration). Both these relationships vary depending on the capacity of the soils to retain or sorb P (the buffering capacity of the soil for P). Therefore, it is necessary to also have knowledge of the capacity of the soil to sorb P to provide fertiliser advice. This is the topic of this Bulletin.
Supplies of abundant, cheap, good quality single superphosphate were vital for the development of agriculture in Australia, particularly in Western Australia. Before 1975, the Commonwealth Government of Australia paid a bounty to reduce the cost of single superphosphate for farmers, encouraging farmers to apply larger amounts of fertiliser P to raise the P status of the soils without reducing profits. This was because most newly-cleared soils for Agriculture in most of Australia had a very low P status and it
was not possible to produce profitable crops and pastures without regular applications of single superphosphate. Before 1974, single superphosphate cost about $25 per tonne in Western Australia, with the bounty paying about half the cost. Though many field experiments were conducted to determine the most profitable amount of fertiliser P to apply to crops and pastures in south-western Australia, single superphosphate was so cheap it was profitable to apply liberal quantities to crops and pastures. That is, economics was not taken into account and it was recommended to apply sufficient fertiliser P to produce 95-99% of the maximum yield.
However, things changed about 1975. The bounty on single superphosphate was removed. The price of phosphate rock imported into Australia to make fertiliser increased. Wages of crews on ships importing phosphate rock to Australia also increased. Suddenly, single superphosphate cost farmers about $50 per tonne (it now cost about $200 per tonne). Consequently, it was no longer profitable to apply large amounts of superphosphate to crops and pastures. Much more precise advice about the most profitable amount of fertiliser P to apply to crops and pastures was required, leading to the development of the “Decide” and “NP Decide” models (Bowden and Bennett 1974; Burgess 1998; Bowden 1989).
Sorption of P by soils
P is not chemically stable in the water-soluble form in the presence of soil. Water-soluble P in soil solution readily reacts, largely with aluminium and iron, to form less soluble, more stable compounds. The reactions mostly take place on the surfaces of soil constituents (clays; oxides of iron and aluminium; organic matter;
and aluminium and iron compounds coating surfaces of sands). After the initial surface reaction, the adsorbed P diffuses slowly towards the interior of the particle and so becomes less available to plants.
The whole reaction, adsorption plus penetration, is called sorption.
Penetration of adsorbed P into the soil particles continues even in dry soil, albeit more slowly. As a result of sorption of P by soil, the concentration of P in soil solution is usually very low, typically less than 0.2 µg P/mL (0.2 mg P/L).
“Fixation” is sometimes used to describe sorption and sometimes to describe the penetration reaction. Because its use is ambiguous, and because it suggests that†“fixed” P is unavailable, it will be avoided here. Under some conditions soluble P may also
react with ions in the soil solution. This is a precipitation reaction.
Precipitation occurs when reaction with superphosphate dissolves some of the soil constituents and so releases ions into the soil solution.
Mostly the precipitates so formed continue to react with ions in soil solution or exposed at the surfaces of soil constituents to from new compounds. Precipitation of calcium phosphates can also occur in alkaline soils with very high P concentrations.
Much of the P taken up by plants, and by the many organisms that live in the soil (insects, earthworms, bacteria, fungi, protozoa, amoeba), is returned to the soil as organic matter. In addition, animals that graze pastures or stubbles of crops return P to the soil as faeces, which contributes to both inorganic and organic soil P. Only traces of P are usually secreted in urine of ruminants. P is normally excreted through the intestinal wall and consequently faeces contains both inorganic and organic P. Soil organic matter is processed by many soil organisms, that physically and chemically change it. One of the end products is the release of P from organic matter as water-soluble P. This is called mineralisation of P from
soil organic matter.
Over the growth of an annual crop, only some of fertiliser P applied to the soil is taken up by plant roots and soil organisms growing in the soil; most is sorbed by the soil. Research in WA has shown that when superphosphate is applied to the soil, at the end of the growing season (6 months or about 180 days after P application), about 20 per cent of the applied P remained in the fertiliser granule, 5 to 30 per cent was taken up by plants, and 50 to 75 per cent was sorbed by the soil.
Any increase in concentration of P in soil solution, by application of superphosphate, in which 80 percent of the total P is initially water-soluble, or by mineralisation of P from soil organic matter, is very rapidly decreased. The decrease in concentration is mostly caused by the water-soluble P being sorbed by soil. But some is also due to P being taken
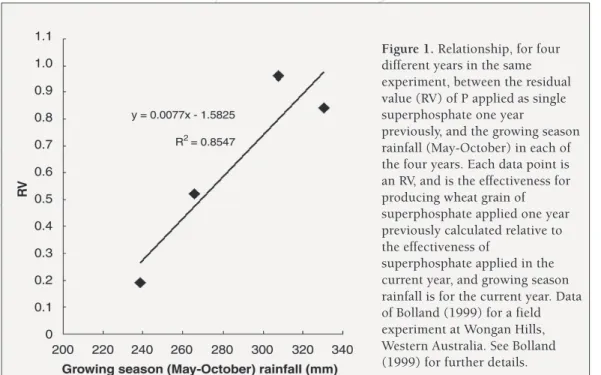
Figure 1. Relationship, for four different years in the same experiment, between the residual value (RV) of P applied as single superphosphate one year
previously, and the growing season rainfall (May-October) in each of the four years. Each data point is an RV, and is the effectiveness for producing wheat grain of superphosphate applied one year previously calculated relative to the effectiveness of
superphosphate applied in the current year, and growing season rainfall is for the current year. Data of Bolland (1999) for a field experiment at Wongan Hills, Western Australia. See Bolland (1999) for further details.
up by plant roots or organisms growing in moist soil, and in very sandy soils, by leaching of P from soil horizons explored by plant roots. Some of the P taken up by crops and pastures is exported in products, such as grain, hay, milk, meat and hides.
Residual soil P
Superphosphate applied to a crop or pasture provides P for plant growth and development in the year of application. The P sorbed by soil, the undissolved P in old fertiliser granules, and P in organic matter derived from the fertiliser, all provide a reserve of P for uptake by crops and pastures in future years (Barrow 1980).
Fertiliser P is said to have a residual value that provides P for plants (and soil organisms) in the years after application. The residual value of fertiliser P needs to also take account of P exported as product, or in very sandy soils in high rainfall areas, lost by leaching (Barrow 1980).
Residual value is conveniently expressed relative to freshly applied P (Barrow 1980). For example, in the year after P was applied we might say that its residual value was equivalent to say 60 per cent of a fresh application. This value will vary depending on the amount of P applied and seasonal conditions. Residual value does depend on the level of application: the smaller the application, the greater the proportion removed in produce and the lower the residual value.
The effect of seasonal conditions (growing season rainfall) on the residual value of fertiliser P is illustrated in Figure 1. The figure shows results for the residual value (RV) of superphosphate applied one year previously. The RV was determined in the same experiment in four different years (Bolland 1999). In each of those years, the effectiveness of superphosphate applied one year previously was calculated relative to the effectiveness of superphosphate applied in the current year, to provide the RV value for each year. Then RV values for all four years were related to growing season rainfall measured in those four years (Figure 1). The figure shows that the RV varied depending on growing season rainfall. In the driest year, the RV of the superphosphate applied one year previously was about 20 per cent as effective as the freshly-applied superphosphate in that year. In the two wettest years, the RV of the superphosphate applied one year previously was almost as effective as the fresh superphosphate applied in those years. Evidently when the superphosphate applied in a previous year was in moist soil for longer, then relative to the freshly-applied fertiliser that year, it was much more effective for producing wheat grain. See Bolland (1999) for more details.
Effect of P sorption on estimating the most profitable amount of fertiliser P to apply
To provide fertiliser advice, it is first necessary to determine, for defined enterprises, for soil types and for environments, and for methods of application, the relationship between plant yield and the amount and source of fertiliser P applied in the year of application.
This is known as the yield response curve. Examples of enterprises are grain production, and silage and hay production. Methods of P application include: applying the fertiliser to the soil surface, known locally as “topdressed” P and overseas as “broadcast” P; placing the fertiliser with the seed while sowing crops, known locally as “drilled”
P; and placing the P below the seed while sowing crops, known
locally as “banded” P. Different sources of P are superphosphate or phosphate rock. All the manufactured, water-soluble P fertilisers, such as single, double or triple superphosphate, and the ammonium phosphate fertilisers, are all about equally effective per unit of applied (see later). However, in Western Australia, phosphate rock fertilisers, for climatic conditions, and soils and plant species used, are much less effective (Bolland, Lewis, Gilkes and Hamilton 1997). Much larger amounts of phosphate rock need to be applied to produce the same yield as superphosphate. Consequently, it has not been profitable to use phosphate rock for most Western Australian soils.
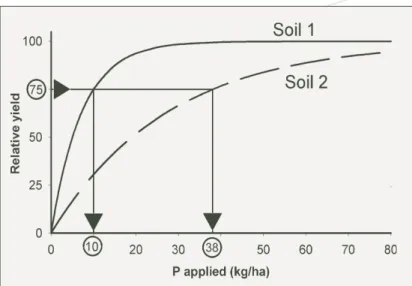
Yield response curves differ for different grain crops; they differ for pasture, wool and dairy production; they also differ from site to site and from year to year. An example of a yield response curve is shown for grain production of wheat in Figure 2. Examples
Figure 2. The yield response curve, which is the relationship between plant yield, here expressed as a percentage of the maximum (relative) yield, and the amount of P applied in the year of application for two newly-cleared soils with no previous P fertiliser history. Soil 1 has a lower capacity to sorb P than soil 2 so more fertiliser P needs to be applied to soil 2 to produce the same relative yield.
of defined soil types and environments in Western Australia are the Eradu sandplain soils east of Geraldton, the loamy sandy soils in the Wongan and Ballidu region, the Kumarl clay soils near Salmon Gums, the Fleming gravelly soils near Gibson, and the Dardanup loamy soils near Bunbury. For the yield response curve, yields are expressed as a percentage of the maximum (relative) yield, because for the same soil type and environment, yields vary from year to year due to different seasonal conditions experienced in the different years. As already discussed, yields also vary depending on the enterprise, soil type and environment. So by expressing yield as relative yield, then for the diverse enterprises, soil types and seasons, the yield axis has the same scale, 0 to 100 per cent. Comparisons are then easier to
make between the different soils, crop species, enterprises and seasons. The rescaling reduces differences between years due to rainfall, but does not completely eliminate the differences (Figure 3).
Yield response curves are different for different soils largely due to the different capacities of the various soils to sorb P (Ozanne and Shaw 1967). For example, in Figure 2, soil 1 has a much lower buffering capacity for P than soil 2. Therefore, diffusion through the soil solution is faster and less fertiliser is needed to produce the same rate of supply and the same relative grain yield of wheat.
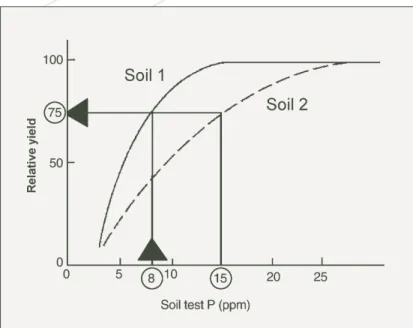
To define the complete yield response curve for each soil and environment, experiments were done on newly-cleared soils that had never been fertilised with P. Most such Western Australian soils contain negligible native soil P. However, farmers are now dealing with soils that have been fertilised with P in previous years and have therefore accumulated stocks of residual P. To determine if it is profitable to apply any more fertiliser P to the next crop or pasture, some idea of the yield that could be produced from the P already present in the soil is required. This includes both P present as native soil P, which is usually negligible for most Western Australian soils as indicated above, and P applied to the soil as fertiliser P in all the previous years before any fresh fertiliser P is applied to this year’s crop or pasture. The value of the P already present in the soil, called the current P status of the soil, is estimated with the aid of a soil test for P. An ideal soil test would extract P in exact proportion to its availability to plants. Unfortunately existing soil tests do not meet this ideal and their results need to be calibrated with plant yield, using a soil P test calibration. An example of a soil P test calibration is shown for grain yield of wheat in Figure 4, determined for the same soil type and environment as the yield response curve shown in Figure 2. For the soil P test calibration, soil samples to measure soil test P are collected in January-February, and the soil test values are related to grain yields measured later in that year. In Western Australia, the soil test is measured using the Colwell procedure, which measures the amount of P extracted from soil by sodium bicarbonate. The top 10 cm of the soil is used for the test. The shape of the soil P test calibration is also largely affected by the capacity of the soil to sorb P (Helyar and Spencer 1977). Soils with a greater capacity to sorb P need more applied P to give the same yield. Soil tests partly reflect this – they extract less P from soils with greater sorption capacity (Figure 4). But they seldom mirror the effects on availability perfectly. The Colwell test usually undervalues the effects Figure 3. Relationship between percentage of the maximum
(relative) yield of dried subterranean clover herbage and the amount of P applied as superphosphate as measured in the year of application at the same site for 5 successive years (1976-1980). Years were: ◆ 1976, ▲ 1977, 1978, 1979, and ■ 1980. Lines are fit of a Mitscherlich equation to the data. Data of Bolland (1995) for a field experiment at Mt Barker, Western Australia.
◆ ▲
of sorption. A larger soil test P is therefore required to produce the same relative yield.
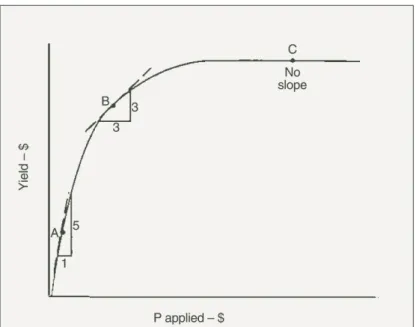
As already stated, the soil P test calibration is used to predict pasture and grain yields produced from the P already present in the soil. How this is done for soils 1 or 2 is shown in Figure 4. The yield predicted from the soil P test calibration in Figure 4 is then transferred to the yield response curve in Figure 2. This estimates the yield likely to be produced by the next crop or pasture from P already present in the soil. It is then possible to determine the likelihood of obtaining a profitable return from money spent on applying fresh P fertiliser to the next crop or pasture grown in that paddock. Figure 5 illustrates the simple theory of how the decision can be made. Figure 5 is produced from Figure 2, by converting grain yield of wheat and the amount of P applied to $ terms. This is done by multiplying
yield, as tonnes per hectare, by the price obtained per tonne of wheat. Costs per hectare include the cost of the fertiliser P and applying it. At each point on the curve in Figure 5, marginal costs and returns can be estimated. Point A in Figure 5 is on the steeply rising part of the curve. At A, each dollar spent on applying fertiliser P returns $5 for grain produced so it is very profitable to apply fresh fertiliser P to the next crop or pasture grown in a soil at about this part of the yields response curve. At point B in Figure 5, marginal costs equal marginal returns so the maximum profit is made by adding fertiliser P up to this point. At point C in Figure 5, there is no yield increase from adding fertiliser P, so money is wasted and would be better spent elsewhere.
Figure 4. Soil P test calibration, which relates plant yield, here expressed as a percentage of the maximum (relative) yield, to soil test P measured by the Colwell sodium bicarbonate procedure. Soil 1 has a lower capacity to sorb P than soil 2 so a larger Colwell soil test P is required by soil 2 to produce the same relative yield.
Figure 5. The yield response curve, which is the relationship between plant yield and the amount of fertiliser P applied to newly-cleared soil with no previous P fertiliser history when yields and the amount of P applied are converted to $ returns and costs. A, B and C are marginal costs and returns at different parts of the response curve.
Fertiliser P for Western Australian crops and pastures
Single (ordinary) superphosphate was the first fertiliser to be manufactured on a large scale. Single superphosphate (9.1 per cent total P, 10.5 per cent total sulfur and 20 per cent total calcium) is made by adding sulfuric acid to calcium phosphate rock, known as apatite phosphate rock. Typically 6 tonnes of acid is added to 10 tonnes of phosphate rock. The phosphorus and calcium in single superphosphate come from the phosphate rock, and the sulfur from sulfuric acid.
If more sulfuric acid is added to apatite phosphate rock, phosphoric acid is made. The calcium sulfate also made is removed by filtration. The phosphoric acid is then added to apatite phosphate rock to make triple superphosphate (20 per cent total P, 16 per cent total calcium, and up to 1.5 per cent total sulfur from the small amount of calcium sulfate or unreacted sulfuric acid still present in the phosphoric acid). When triple superphosphate was first made in the United States of America, high quality apatite phosphate rock was available. It produced a product with about triple the P content of single superphosphate; hence the name triple superphosphate.
However, the lower quality apatite phosphate rocks now available produce “triple” superphosphate typically containing only about double the P content of single superphosphate. Despite this, the name “triple” is usually used. An exception is a local Western Australian version of triple superphosphate which is called double superphosphate. It contains 17.5 per cent total P, 16 per cent total calcium and 3.5 per cent total sulfur.
Passing anhydrous (dry) ammonia gas through phosphoric acid makes the ammonium phosphate fertilisers. The most common are mono-ammonium phosphate (MAP, containing 22 per cent total P and 11 per cent total nitrogen) and di-ammonium phosphate (DAP, containing 20 per cent total P and 18 per cent total nitrogen).
Ammonia is a by-product of oil refining, so manufacturing plants that make ammonium phosphate fertilisers are frequently located near oil refineries.
In Western Australia, local versions of ammonium phosphates, originally known as ‘Agras’ fertilisers, are made by adding ammonium sulfate to phosphoric acid, so the fertilisers contain sulfur in addition to P and nitrogen. An example is Agras No. 1, containing 7.6 per cent total P, 15.4 per cent total nitrogen and 11.5 per cent total sulfur.
The development of methods to make these manufactured, solid, granulated, stable water-soluble P fertilisers all had huge impacts on developing newly-cleared soils to grow profitable crops and pastures worldwide, particularly in Western Australia.
Initially, about 80 per cent of the total P in single, double and triple superphosphates is water-soluble mono-calcium phosphate (Ca(H2PO4)2.H2O). About 90 per cent of the total phosphorus in the ammonium phosphate fertilisers is water-soluble ammonium phosphate.
There are many water-soluble P compounds, but mono- calcium phosphate and the ammonium phosphates are the only water-soluble phosphorus compounds that can economically be used to make stable granulated fertilisers that can be stored, transported and applied in agriculture. The other compounds fail to produce granules that remain dry and stable; the granules become sticky and collapse to form a gelatinous mess.
In field experiments, it is difficult to demonstrate differences in the effectiveness, for production of agricultural crops or pastures, of the two different water-soluble phosphorus compounds (mono- calcium and ammonium phosphates) present in the different commercial manufactured water-soluble P fertilisers. Therefore, all these fertilisers are considered to be equally effective as P fertilisers for plant production per unit of phosphorus.
All the manufactured, solid, water-soluble phosphorus fertilisers are granulated (typically 1 to 5 mm) and are easy to handle, store and apply. Other essential nutrient elements can be incorporated into the granules if required, and so applied in the same operation.
These include potassium, sulfur, copper, zinc, manganese, molybdenum, cobalt and selenium (needed for animals).
Partially acidulated phosphate rock fertilisers
Partially acidulated phosphate rock fertilisers (PAPR) are made by adding 20-50 per cent less acid to phosphate rock than is required to make fully acidulated single superphosphate. The PAPRs therefore contain much unreacted apatite and from 25 to 50 per cent less water-soluble P than single superphosphate.
The only PAPR made and used in Western Australia has been coastal superphosphate. Since 1984, coastal superphosphate has been made for pastures on very sandy soils in high rainfall (greater than 800 mm annual average) areas to reduce leaching of water-soluble P
from fertiliser freshly-applied to the pastures. Coastal superphosphate was originally made by adding apatite phosphate rock and elemental sulfur to single superphosphate before granulation as it emerged from the den (the chamber where sulfuric acid and phosphate rock are mixed and the reaction starts to produce single superphosphate).
This version of coastal superphosphate contained 9.0 per cent total P, with 27 per cent of the total P (2.4 per cent P in the fertiliser) being water-soluble, and 30 per cent sulfur (Table 1). Sulfur also leaches from the very sandy soils in the region. This results in the pastures becoming sulfur deficient requiring regular applications of sulfur fertiliser. Superphosphate is applied to the pastures near the start of the growing season. The sulfur applied as single superphosphate to pastures on sandy soils in the high rainfall areas usually provides insufficient sulfur to cater for pasture production after July because of leaching of sulfur from soil by rainfall (Barrow 1966). Therefore, extra sulfur fertiliser needs to be applied after July. The extra sulfur incorporated into the original version of coastal superphosphate during manufacture was elemental sulfur. Previous research (Barrow 1971) showed that elemental sulfur, with particle sizes ranging from 40 to 100 mesh, applied near the start of the growing season to high rainfall pastures on sandy soils supplied enough sulfur to the pasture for the whole year. Therefore, extra sulfur was applied as elemental sulfur to the original version of coastal superphosphate. Plant roots can only take up the sulfate form of sulfur from soil solution. Soil bacteria oxidise elemental sulfur to sulfate sulfur. Barrow (1971) showed that elemental sulfur with particles between 40 and 100 mesh provided the best compromise between too fast and too slow oxidation to supply adequate sulfate sulfur for high rainfall pastures on very sandy soils in Western Australia. It was hoped that the elemental sulfur present in the coastal superphosphate applied three weeks after pasture emerged at the start of the growing season would provide adequate sulfur to pasture after July each year. It was expected that the coastal superphosphate would be a more effective sulfur fertiliser for the pastures than single superphosphate after July each year. However, field studies done from 1985 to 1990 in the high rainfall areas of Western Australia showed that the sulfur component of the first version of coastal superphosphate was no more effective than the sulfur in single superphosphate (Bolland, Yeates and Clarke 2003). In the study of Bolland, Yeates and Clarke (2003), seven amounts of sulfur were applied as each fertiliser to the same plot each year for five successive
years, the fertilisers being applied three weeks after pasture emerged at the start of each growing season. The coastal superphosphate contained about 9.5 per cent sulfate-sulfur and 20.5 per cent elemental-sulfur, giving a total of 30 per cent sulfur. The 10.5 per cent total sulfur in single superphosphate was all derived from sulfate- sulfur. Even though Barrow (1971) has shown that elemental sulfur of less than 200 mesh was rapidly oxidised in the field, elemental- sulfur in the coastal superphosphate was added in this form. It was added to the superphosphate before granulation. Given its known rapid rate of oxidation, it is not surprising that coastal superphosphate was not an effective source of sulfur and did not have a superior residual value to the sulfate-sulfur present in single superphosphate.
After 1990, coastal superphosphate was made by adding half the amount of sulfuric acid to apatite phosphate rock required to make single superphosphate. “Sulfur residues”, a by-product of fertiliser manufacture, comprising 50 per cent calcium sulfate and 50 per cent elemental sulfur, were added to the fertiliser as it came out of the den before granulation. Both the calcium sulfate and elemental sulfur in “sulfur residues” were in a very finely powdered form (less than 200 mesh). Compared with single superphosphate, the post 1990 version of coastal superphosphate contained about half the total P (5.6 compared with 9.1 per cent total P) (Table 1). It
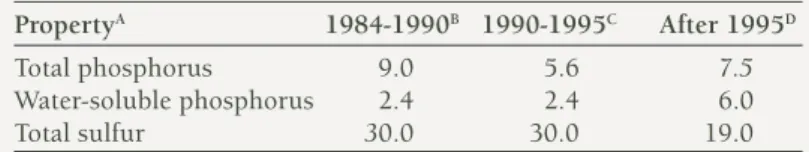
Table 1. Some properties of three version of coastal superphosphate made in Western Australia
PropertyA 1984-1990B 1990-1995C After 1995D
Total phosphorus 9.0 5.6 7.5
Water-soluble phosphorus 2.4 2.4 6.0
Total sulfur 30.0 30.0 19.0
A Expressed as a percentage (weight/weight).
B Made by adding phosphate rock and elemental sulfur to superphosphate before granulation.
C Made by adding half the amount of sulfuric acid to phosphate rock required to make superphosphate, and by adding “sulfur residues” (half calcium sulfate and half elemental sulfur, both as very fine powders [less than 200 mesh]) before granulation.
D Made by adding “sulfur residues” (see footnote C above) to superphosphate before granulation.
also contained one-third the water-soluble P (2.4 compared with 7.3 per cent). Therefore, water-soluble P comprised 80 per cent of the total P for single superphosphate compared with 45 per cent for coastal superphosphate. Coastal superphosphate contained three times as much sulfur (30.0 compared to 10.5 per cent).
Since about 1995, yet another version of coastal superphosphate was made. This version of the fertiliser was made by only adding “sulfur residues” to single superphosphate before granulation. Consequently, as for single superphosphate, 80 per cent of the total P is water soluble, so that in the year of application, leaching of P is no longer likely to be reduced by using the present version of coastal superphosphate instead of single superphosphate for very sandy soils in high rainfall areas. The present version of coastal superphosphate contains 7.5 per cent total P and 19 per cent total sulfur
For deep sandy soils in high rainfall areas of south-western Australia, research showed that the P in the two early versions of coastal superphosphate was equally or more effective per unit of applied P as P present in single superphosphate (Bolland, Clarke and Yeates 1995; Bolland, Clarke and Boetel 1995). It is not known how the sulfur component in the two final version of coastal superphosphate performed as sulfur fertilisers for pastures in the region.
Coastal superphosphate was more expensive per tonne of fertiliser than single superphosphate and little has been sold.
Reactions of P from superphosphate and ammonium phosphate fertilisers with soil
Present day understanding of the reactions of P from the superphosphate and ammonium phosphate fertilisers with soil have been derived from two types of studies. The first type investigated the fate of fertiliser P when granules of the fertilisers are added to the soil. The second type of study measured adsorption and desorption of water-soluble P (potassium di-hydrogen phosphate, calcium di- hydrogen phosphate, mono-calcium phosphate, ammonium phosphate, single superphosphate, triple superphosphate) added to suspensions of soils or synthetic soil minerals (usually oxides of iron and aluminium made in the laboratory) and pure clays found in natural deposits, such as the kaolinite clay deposits near Greenbushes and Goomalling, Western Australia.
Dissolution and reaction of P from water-soluble fertilisers with soil
The mono-calcium phosphate and ammonium phosphate compounds present in granulated fertilisers are soluble and hygroscopic so that even in soil with a moisture tension of about 3 bars (well below field capacity) sufficient water moves from the soil into the granule to initiate dissolution. Once water is in the fertiliser granule, dissolution of the water-soluble P is rapid and almost complete and the resultant fertiliser solution moves rapidly into the soil. The water is drawn into the granule by capillarity and vapour transport, vapour transport being more important in dry soils, because a strong osmotic gradient is developed between the mono- calcium phosphate or ammonium phosphate in the granule and the water in the adjacent soil. The osmotic potential gradient present when the fertiliser solution first enters the soil gradually disappears as the fertiliser solution is diluted by reacting with the soil and as it moves further into the soil by leaching, capillarity and diffusion.
There are concentration gradients for all fertiliser constituents going from the granule into the soil so the net movement is away from the granule into the soil. The dissolved P reacts with dissolved calcium, aluminium and iron in soil solution, as well as calcium, aluminium and iron exposed at the surfaces of soil constituents and organic matter, thereby maintaining the concentration gradient between the granule and the soil. The first precipitated P compounds and adsorption complexes with soil constituents are metastable, so that dissolution and desorption reactions followed by sorption reactions (precipitation and adsorption) continue producing more stable, less soluble P forms. These reactions continue, even in quite dry soils, albeit more slowly. Therefore, in time, as a consequence of the continuing reactions, most P becomes incorporated into more stable, less soluble forms that are less available to plants than the forms that initially developed adjacent to granules.
Some reactions of the dissolved P can occur in the granule before the concentrated fertiliser solution enters the soil. Dicalcium phosphate (DCP), as DCP (CaHPO4) and DCP dihydrate (CaHPO4.2H2O), may precipitate in superphosphate granules. The iron and aluminium impurities in the phosphate rock used to make the fertilisers may also cause P to precipitate in the granule, forming complex iron and aluminium phosphates; this process may occur either during manufacture and storage of the fertiliser, or during dissolution in the soil.
Once the concentrated fertiliser solution has entered the soil, it reacts with the soil near the granule. In the first few millimetres of soil, the concentrated fertiliser solution can dissolve soil constituents, increasing concentrations in the soil solution of silica, iron, aluminium, manganese, calcium, magnesium and potassium. These dissolved ions take part in reactions with P from the fertiliser solution in the soil, resulting in the precipitation of P from solution as the solubility products for various P compounds are exceeded.
As a result of precipitation and adsorption of P from solution occurring near granules, the concentration of P in soil solution rapidly falls with increasing distance from the granule. Eventually, on moving further away from the granule, the typically low P concentrations in soil solution is reached, less than 0.2 µg P/mL (mg P/L), commonly encountered for agricultural soils. At these low concentrations, P retention by the soil is more likely to be due to adsorption than precipitation, because the solubility products of many P compounds are less likely to be exceeded. The distance from the granule at which adsorption of P dominates over precipitation depends on the soil and fertiliser properties, but is commonly about 10 millimetres from the granule. The distribution of P in soil adjacent to a fertiliser granule has been measured in some soils from south-western Australia (Benbi and Gilkes 1987). For a high-P-sorbing lateritic soil, about 55 per cent of P from a triple superphosphate granule was present within 5 millimetres of the granule after four weeks in the soil. The corresponding value was 28 per cent for a low-P-sorbing sandy podzol, because as P dissolved from the granule relatively more of the dissolved P was able to move further away from the granule due to low P sorption by the sandy podzol soil.
Adsorption of P by soil
Much P (phosphate ion) is adsorbed by reacting with iron, aluminium, calcium and other ions coordinated with oxygen and hydroxide ions exposed at the surface of soil constituents. In acid soils, the soil constituents that adsorb P include crystalline iron and aluminium oxides and oxyhydroxides, clay minerals, amorphous compounds of iron and aluminium that may exist as coatings on soil constituents, and aluminium that is associated with organic matter.
In Western Australian soils, those constituents that adsorb P in acid soils also adsorb P in alkaline soils. In addition, alkaline soils commonly contain carbonates that can adsorb P and at high P
concentration P is also precipitated as calcium phosphate from the alkaline, calcium-rich soil solution.
Phosphate ions are adsorbed onto the surfaces of soil constituents when oxygen atoms of the phosphate ion donate a lone pair of electrons to fill the outer electron shell of metal atoms, principally iron and aluminium, which are coordinated with oxygen and hydroxide ions exposed at the surfaces of soil constituents. The phosphate ion can replace surface ions, including hydroxide, sulfate, bicarbonate, and molybdate ions. This exchange occurs because the phosphate ion is more strongly adsorbed than the ion it replaces, so more stable surface compounds are formed by the adsorbed phosphate ion. In addition, it appears that phosphate ions eventually diffuse into the crystal lattice of soil constituents and are even less available to plants (Barrow 1999).
The adsorption of P onto the surfaces of soil constituents is influenced by many factors that affect the charge on the surfaces of soil constituents and the forms of phosphate in soil solution. These factors influence the affinity of the surface for phosphate. The effect of pH on P sorption is now well understood. Changes in soil pH result in adsorption or desorption of hydrogen ions at the surface of soil constituents. The adsorbed hydrogen ion takes its positive charge onto the surface and so increases the positive charge on the surface.
Thus at low pH, these soil constituents tend to have a more positive charge. Conversely, at higher pH, desorption of hydrogen ions will make the charge on the surface more negative. The constituents that behave this way are referred to as having variable charge. Phosphate ions are negatively charged and so are strongly repelled by negative surfaces. Nevertheless they can react with such surfaces if the affinity and the concentration are large enough. Phosphate reacts via two of its hydroxide (OH) ligands to form two links to the surface. This means that the surface P ligands are in equilibrium with divalent P ions in solution. The concentration of these ions in solution increases about 10 fold for each unit increase in pH up to about pH 6.0. So there are opposing effects of increasing pH: an increasingly negative surface charge opposed by an increasing proportion of divalent ions.
For phosphate the effect of the surface charge is somewhat greater and the net effect is a gentle decrease in sorption with increasing pH up to about pH 6.0, then a somewhat steeper decline. The expression of these effects depends on the ions in solution. If calcium ions dominate, rather than say sodium ions, the calcium ions make it
easier for phosphate ions to react with negative surfaces and the decrease in phosphate sorption with increasing pH is less marked.
Such effects have sometimes been misinterpreted as due to precipitation of calcium phosphates. The same principles determine the effects of pH on sorption of such other ions as borate, selenate, molybdate, sulfate and even organic phosphates (Barrow 1999).
Adsorption of positively charged metal ions (for example, zinc, copper) onto the surface of synthetic iron oxide also increases the positive charge of the surface and this will increase the adsorption of negative ions, such as phosphate and molybdate, onto the surface (Bolland, Posner and Quirk 1977). Such effects are smaller in soil than on synthetic oxides because there is a range of sites differing in charge. Zinc tends to react with the most negative end of the spectrum of charged sites, phosphate with the most positive end. Consequently the interaction is smaller (Barrow 1987). Likewise, adsorption of phosphate ions onto the synthetic iron oxide surface will increase the negative charge of the surface, and so reduce adsorption of additional negative phosphate ions while increasing the adsorption of positive zinc and copper ions from solution onto the surface (Bolland, Posner and Quirk 1977).
Uptake of P by plant roots
P is strongly sorbed by most soils and so is effectively immobile in the soil. Plant roots intercept P as they grow through the soil. Most P is taken up by root hairs that grow near root tips.
Plant roots use energy to take up P from the soil, known as active uptake of P by plant roots. Consequently, the concentration of P in plant tissue, including roots, is very much greater than in soil solution near by the roots. Plant roots can only grow and develop root hairs and take up P from soil solution in moist soil. No soil P can be taken up by plant roots from dry soil. Root hairs are only active for a short time. New ones are produced near the root tips as the roots continue to grow and meander through moist soil. The root hairs greatly increase the volume of soil explored near growing root tips. In this fashion, when the soil is moist, roots scavenge the soil for any P and use energy to actively take up water-soluble P encountered in soil solution very close to the root hairs. Many plants also cooperate with fungi to form “mycorrhizal” associations. In these cases fungal hyphae extend from the root and serve as the primary site for nutrient uptake. The active uptake of P from soil solution by plant roots or
fungal hyphae drives dissolution and desorption of nearby P. A very simple explanation of how this occurs is now provided.
All sparingly soluble compounds of P in the soil will support a small number of phosphate ions in soil solution nearby. The concentration of P in soil solution is dictated by the solubility products and desorption characteristics of the P compounds involved.
Dissolution of P is from precipitated P compounds in the soil;
desorption is from P that had been adsorbed by the surface of soil constituents. The P is either sorbed or desorbed by the soil to maintain a nearly constant P concentration in soil solution near the root hair. However, very close to the root hair, the active uptake of P will deplete P. This causes a concentration gradient towards the root hair and P will diffuse toward the root hair. Thus the concentration of P in soil solution will vary spatially, vertically, and horizontally in the soil depending on the spatial distribution of:
• Fertiliser P applied in previous years.
• Surface properties of the various soil constituents.
• Both the surface properties of each soil constituent, and the proportion of the various soil constituents present in the soil.
• Other ions (calcium, zinc, iron, aluminium etc.) present in soil solution or on the surfaces of soil constituents.
• Soil moisture content.
• Soil pH.
• Presence of living roots.
To give an artificial example, suppose the soil in a small volume around the root hair has a moderate buffering capacity. If 500 soluble phosphate ions dissolve into the volume of solution from a phosphate granule nearby, 400 will be sorbed by the soil to leave 100 phosphate ions in the volume of soil solution. If the root hair actively takes up 60 of the phosphate ions from the volume of soil solution, perhaps 50 more will dissolve or desorb. Thus the concentration in solution will decrease slightly to 90 ions. In this fashion, active uptake of P by plant roots drives dissolution and desorption of insoluble P in soil close by root hairs and the concentration close to the root decreases causing diffusion of ions in the soil solution down the concentration gradient. Further, the desorption of some of the surface P ions causes some of the P ions that had previously diffused into the soil particles to start diffusing back towards the surface. In this example, in a soil of higher buffering
capacity, say 490 ions might be sorbed and only 10 ions might remain in solution and higher levels of application are needed to maintain an adequate P supply.
The active uptake of P by plant roots initiates the process by which plant roots obtain P from the residual portion of P that is present in the soil as sorbed P. Much residual P in long-term pastures is derived from organic matter. As already described, P mineralised from soil organic matter is removed from soil solution by either being actively taken up by plant roots or organisms growing in the soil, or it is sorbed by the soil. Most is usually sorbed by the soil.
History of methods used to rank the P sorption capacity of soils in Western Australia
The methods of Ozanne and Shaw
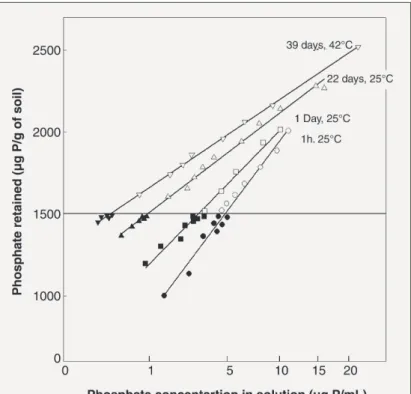
The laboratory procedure described by Ozanne and Shaw (1967, 1968) has become the standard method used in Western Australia to measure P sorption by soils. In the procedure, samples of 2.5 g of soil are mixed with 50 mL 0.01 M calcium chloride (1:20, soil:solution ratio), to which 5 to 8 levels of P, ranging from 0 to 25 mg P/L, are added. The concentrations are chosen so that the observed concentrations of P in the final solution are within the range 0 to 1 mg P/L. Chloroform (0.25 per cent, volume/volume) is added to inhibit microbial activity. Mixing of the soil and solution is for 16 hours on an end-over-end shaker (10 rpm) at 23° Celsius.
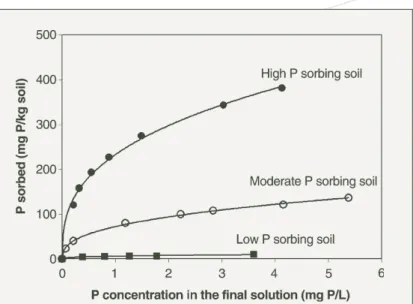
After centrifugation, to separate the soil and solution, the concentration of P in the solution (final solution or extract) is measured colorimetrically by the Murphy and Riley procedure (1962). The amount of P sorbed by the soil is then calculated by subtracting the concentration of P measured in the final solution from the concentration of P added. The method provides a defined curve for the relationship between the amount of P sorbed by the soil, as the dependent (y) axis, and the amount of P measured in the final solution, as the independent (x) axis (Figure 6).
For convenience, we need to be able to summarise the behaviour described by such curves, preferably by a single number.
At least two numbers are needed to describe curves. However, if the curves are of similar shape, one number may suffice. This seems to be the case for Western Australian surface soils. Originally, Ozanne and Shaw (1967) proposed that P sorption be calculated from the
complete sorption curve by interpolating the amount of P sorbed by soil when the concentration of P in the final solution was 0.3 mg P/
L. This was known as P sorption at 0.3 mg P/L (Ozanne and Shaw 1967). Subsequently, Ozanne and Shaw (1968) proposed that P sorption by soil be determined from the complete sorption curve by calculating the amount of P sorbed by the soil as the concentration of P in the final solution was raised from 0.25 to 0.35 mg P/L. This value was called the P buffer capacity of the soil (or simply PBC), and is now called the O&S value in recognition of the contribution of Ozanne and Shaw (Barrow 2000; Burkitt, Moody, Gourley and Hannah 2002).
Ozanne and Shaw measured P sorption by soils when the P concentration in the final solution was at 0.3 mg P/L, or between
Figure 6. Phosphorus sorption curves for three different soils collected from Western Australia. The soils had not been treated with any fertiliser. The highly P sorbing soil was a lateritic gravelly loam from Mount Barker Research Station.
The moderately P sorbing soil was a latertic ironstone gravelly sand near New Norcia. The low P sorbing soil was a pale yellow sand from Badgingarra Research Station.
0.25 and 0.35 mg P/L, because these were about the concentration of P in soil solution at which the P was believed to be both non-limiting and non-toxic for the growth of most agricultural plant species.
Effect of previously sorbed P on O&S values The O&S value became widely used as the standard laboratory method for ranking the capacity of soils to sorb P. Ozanne and Shaw proposed that the O&S value of soil was an “intrinsic” soil property and so only needed to be measured once because the O&S value did not change as more fertiliser P was applied to the soil. That is they proposed that after addition of P fertiliser, curve 2 of Figure 7b changed to curve 5. A similar approach was used by Jones and Fox (1977). By contrast, as the figure also shows, the amount of P sorbed at 0.3 mg P/L decreased as more fertiliser P was applied to the soil.
The original proposition that the O&S value did not change as more P was applied to the soil has since been questioned. In laboratory studies, Barrow (1974) showed that, for any given soil, the capacity of the soil to sorb P decreased as more P was applied.
That is, curve 2 of Figure 7b changed into curve 6 rather than curve 5. That is, not only was it moved
“down” but the slope was also decreased. This was subsequently supported for superphosphate in field studies (Barrow, Bolland and Allen 1998). Why should this happen? We think it is a consequence of the slow penetration of phosphate into the soil particles. This causes the charge on the P ligands to become semi-permanent. As a consequence the adsorbing surfaces are less able to react with freshly added P. Thus the capacity of soil to sorb P is not a fixed property of the soil which need be determined only once (Barrow 1999); continuing reaction with fertiliser P decreases the capacity of the soils to sorb P (Barrow, Bolland and Allen 1998; Barrow 1999).
An important consequence is that the effectiveness for plant production of fertiliser P subsequently applied is increased (Bolland and Baker 1998) Figure 7. Some typical sorption curves. All curves were generated using the
Freundlich equation: S = axb – q, where S is P sorbed, x is solution concentration of P, and a, b and c are coefficients.
Plot (a) shows the effect of varying the coefficient b. For curve 1 the value of b was 0.2; for curve 2 it was 0.4 and for curve 3, 0.6. For all three curves q is 0.
Plot (b) shows the effect of varying the other coefficients. Curve 4 differs from curve 2 in that the
a coefficient is decreased to 80 per cent of the value for curve 2. Curve 5 differs in that q is 20. Curve 6 differs in that the a parameter is decreased to 80 per cent and the q parameter is 5.
Plots (b), (c) and (d) differ in the scale used for the horizontal axis.
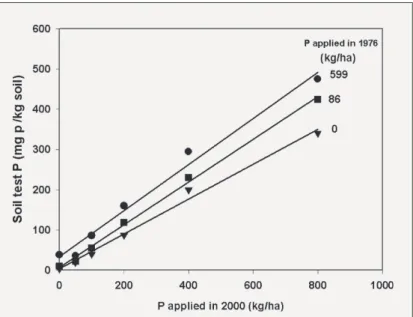
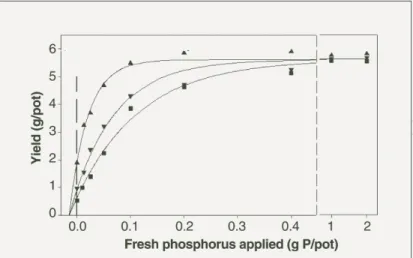
(Figure 8). This figure shows that 20 years after application, fertiliser P was virtually unavailable. Nevertheless, the previous application made newly applied P more effective. An application of 86 kg P/ha more than doubled the effectiveness of newly applied P. In addition, more P is extracted from soil by the Colwell sodium bicarbonate procedure as more P was applied in a previous year (Bolland and Allen 2003a) (Figure 9). The increase in Colwell soil test P as more P was applied in a previous year was about 20-30 per cent, which was smaller than the increase in fertiliser effectiveness measured using plant yield in the study of Bolland and Baker (1998).
Recent work has shown the decrease in the capacity of soil to sorb P as more P was applied in a previous year is indeed widespread
Figure 8. Relationship between yield of dried wheat shoots and the amount of fresh phosphorus applied in 1996 to samples of soil collected from a field experiment to which different amounts of P were applied once only in May 1976 (●, 0 kg P/ha; ▼, 86 kg P/ha; ▲, 599 kg P/ha). Lines are fits of a Mitscherlich equation of the form: Yield = a(1-exp(- cI(x†– b)) where x is the amount of freshly-applied P. In this formulation, b is the P supplied from the soil and seed. The value was 0.015 g P/pot and was not significantly different amongst the residual fertiliser treatments. The relative effectiveness of the fresh fertiliser treatments is calculated from the ratio of the cI coefficients for the 1976 P treatments. On the treatment that had received 599 kg P/ha, effectiveness of the fresh fertiliser was 3.5 times greater than that of the control. For treatments that had received 86 kg P/ha the value was 2.3. Recalculated from the data of Bolland and Baker (1998).
Figure 9. Relationship between Colwell soil test P measured on sub-samples of soil collected in October 2001, and the amount of P applied in July 2000, for three 1976 P treatments applied to a field experiment on Newdegate Research Station:
0 kg P/ha (◆); 86 kg P/ha (■); and 599 kg P/ha (▲). The l.s.d. (P = 0.05) for Colwell P, calculated from analysis of variance, was 37 mg P/kg soil. Data of Bolland and Allen (2003a).
for lateritic soils in which aluminium and iron exposed at the surfaces of soil constituents dominates P sorption (Bolland and Allen 2003b;
Figure 10).
Simpler methods of estimating P sorption by soil
Generating a sorption curve requires measurements at several different P concentrations in order to measure O&S values, or P sorption at 0.3 mg P/L. It is too time consuming and expensive to be adopted as a routine procedure by commercial laboratories in Western Australia. Simpler procedures were therefore studied and two such methods have been widely used for up to 20 years in Western Australia (see later). But before the simple laboratory methods were used, soil type was used as the first simple procedure to rank the capacity of Western Australian soils to sorb P, and the reason for doing this, and how it was done, is now described.
Ranking the P sorption capacity of soils by soil type
In 1974, the “Decide” model was proposed (Bowden and Bennett 1974) to provide better fertiliser P advice for crops and pastures in south-western Australia. In those days there was no simple, rapid, cheap method for estimating the capacity of soils to sorb P that could be used by commercial laboratories in Western Australia. So in the original “Decide” model, soil type was used to rank the capacity of soils to sorb P. The capacity of soils to sorb P was based on the native vegetation that grew on the soils before agricultural development. Several examples follow. Karri loam soils, that used to grow Karri trees ( Eucaluptus diversicolor), had amongst the highest capacity of soils to sorb P in south-western Australia when the soils were newly-cleared and are indeed high on a world scale. By contrast, banksia sands, that used to support Banksia spp., have very low capacities to sorb P. Salmon gum soils, on which Figure 10. Relationship between O&S values and the amount of P applied in a previous year measured on soil samples collected from field experiments in south-western Australia to which P was applied as superphosphate once only in a previous year. The experiments were located on (a) three low P sorbing sandy soils (▲ Badgingarra, ◆ Wongan Hills site 1, and ■Wongan Hills site 2), (b) soils with larger capacities to sorb P ( Gibson, South Carrabin and North Cunderdin), and (c) two soils with even larger capacities to sorb P (● New Norcia and
West Dale). Data of Bolland and Allen (2003b).
◆ ■ ▲
●
salmon gums (E. salmonophloia) grew, are red-brown alkaline soils with much clay with moderate capacities to sorb P. Lateritic ironstone gravel sandy soils that supported jarrah (E. marginata) and marri (E. calophylla) trees have much larger capacities to sorb P than banksia sands and salmon gum soils, but not as large as Karri loam soils.
In the early version of Decide, knowledge of the capacity of soils to sorb P was required in order to select the appropriate yield response curve to calculate the optimum amount of fertiliser P to apply to the next crop or pasture. The early version of Decide did not use soil testing for P. The amount of soil P (the current P status of the soil) was estimated using fertiliser history.
However, farmers kept poor records of amounts of fertiliser P applied to individual paddocks in different years. Consequently, soil testing was eventually used in the Decide model to estimate the current P status of soil. Then knowledge of the capacity of soil to sorb P was needed to estimate how effective the soil P was for producing yield of the next crop or pasture so the optimum amount of P to apply to the next crop or pasture could be estimated.
Reactive iron
Until the mid 1980s, CSBP provided the major commercial laboratory services for soil and tissue testing in Western Australia.
The laboratory wished to use a more objective method for estimating the P sorption capacity of soils than the soil type (original native vegetation) method used at the time. They decided to use a simple method developed in Germany. This was to measure the amount of iron extracted from the soil by ammonium oxalate, which CSBP called “reactive iron”. The method used was developed by Schwertmann (1964) and is as follows: soil is mixed with 0.3 M ammonium oxalate at pH 3.25 for 2 hours at 23° on an end-over- end shaker (10 rpm) using a soil to solution ratio of 1 to 33.3. After centrifugation, to separate soil and solution, the concentration of iron in the solution is measured by flame atomic spectrometry.
Consequently, reactive iron was the first objective method used by a commercial laboratory in Western Australia to rank the capacity of soils to sorb P. Note that Schwertmann (1964) used the amount of
iron and aluminium extracted by ammonium oxalate to estimate P sorption by soil. CSBP opted to use only iron. In addition to reactive iron, CSBP also use soil pH, per cent organic carbon and soil texture to select appropriate yield response curves and soil P test calibration curves to calculate optimum amounts of fertiliser P to apply to the next crop or pasture.
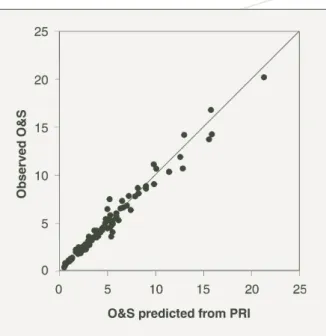
Subsequently both the amount of iron and aluminium extracted from soil by ammonium oxalate (reactive iron and reactive aluminium) were studied (Singh and Gilkes 1991; Bolland, Gilkes, Brennan and Allen 1996; Allen, Barrow and Bolland 2001) as possible methods of ranking the capacity of Western Australian soils to sorb P. In these studies, the reactive iron and reactive aluminium values were related the values to buffering capacity of soil measured by the O&S method. Reactive iron was often poorly correlated to the O&S value (Figure 11). Reactive aluminium was mostly more closely correlated to O&S values than reactive iron but correlations were nevertheless weak (Figure 11). Both reactive iron and reactive Figure 11. Prediction of the buffering capacity as measured by the
O&S value by reactive iron and reactive aluminium (from Allen, Barrow and Bolland 2001).
aluminium are indirect methods of estimating the P sorption capacity of soils. Simple methods that directly measured P sorption by soil were preferred. This eventually lead to the development and use of the PRI method to rank the capacity of Western Australian soils to sorb P as the preferred simple, direct commercial method to rank the capacity of the soils to sorb P. The history of the development of the PRI procedure, and details of the procedure, are now described.
PRI
In the late 1970s in Western Australia, J.W. Bowden proposed a simple direct measure of P sorption which was developed by D.G.
Allen. It was a simple index called the Phosphorus Retention Index (PRI). PRI was first used to study P sorption using soil samples collected from a field experiment on Mt Barker Research Station.
The soil had a very high capacity to sorb P (it had an O&S value of 30 mg P/kg soil, very high for a Western Australian soil). In hindsight, the amount of P added to measure PRI (10 mg P/mL) was too small to measure P sorption by the soil. Subsequently, Allen and Jeffery (1990) continued the major development of PRI for use in the Peel- Harvey estuary.
In the early 1980s, pollution by P in the Peel-Harvey estuary, about 75 km south of Perth, Western Australia, became a major problem, causing eutrophication of the estuary (Hodgkin and Hamilton 1993). The P was derived from either ‘point sources’, such as piggeries, or leaching of P from fertilised pastures located in the catchments of the estuary. The high amounts of P in the estuary caused algal blooms that consumed the oxygen in the water, killing organisms growing in the water, and the decaying bodies of the dead organisms added to the problem. A large project was conducted to overcome the problem (Hodgkin and Hamilton 1993). The capacity of the soils to sorb P was an important measurement in the study of soils from the catchments of the estuary. The O&S value was used for laboratory studies, and initially reactive iron was used for field studies. However, in the field studies it was found that reactive iron values were always low and very variable and failed to discriminate between low and high P sorbing sandy soils of the region. The Government Chemical Laboratories of Western Australia, now known as the Chemistry Centre (WA), investigated alternative procedures to better rank the P sorption capacity of the sandy soils in the Peel- Harvey region. It was decided that a direct measure of P sorption was more appropriate than indirect measures such as reactive iron.
Rather than develop P sorption indices by adding several levels of P to a soil, as Ozanne and Shaw did for calculating O&S values, Bache and Williams (1971) developed P sorption indices by only adding one level of P to soil. Their method depended on the assumption that plots of sorption against the log of concentration were linear. This was not the case for Western Australian soils; rather plots on this scale curved upwards (Figure 7c). Allen and Jeffery (1990) decided to use a similar approach as Bache and Williams (1971), in so far as they used only one level of P in further developing the PRI procedure. Such a procedure was simple, cheap and could be used as a routine method by commercial laboratories. The PRI procedure successfully differentiated between low and high P sorbing sandy soils in the Peel-Harvey region.
The PRI procedure is as follows: 5 g of soil is mixed with 100 mL of 0.02 M potassium chloride (1:20, soil:solution ratio) containing 10 mg P/L, added as potassium dihydrogen phosphate, for 16 hours on an end-over-end shaker (10 rpm) at 23° Celsius. Chloroform (0.25 percent) is added to the mixture to inhibit microbial activity.
The soil and solution are separated by centrifugation, and the concentration of P in the final solution is measured colourimetrically by the Murphy and Riley (1962) method. The amount of P sorbed by the soil is then calculated by subtracting the concentration of P measured in the final solution from the initial concentration of P added to the mixture. PRI (mL/g soil) is the amount of P sorbed (mg P/kg soil) divided by the concentration of P measured in the final solution (mg P/L).
The PRI procedure measured P sorption in potassium chloride instead of calcium chloride used in most procedures worldwide to measure P sorption by soil. Potassium chloride was used to avoid possible precipitation of P in some alkaline soils (Spearwood sands, Tuart sands, Cottesloe sands) if calcium chloride was used. However, subsequent research found no evidence for precipitation of P when PRI was measured in calcium chloride instead of potassium chloride for acidic and alkaline Western Australian soils (Allen, Barrow and Bolland 2001).
About the mid 1980s, Summit Fertilisers was established to supply fertilisers to farmers in Western Australia. Originally Summit Fertilisers used Australian Agricultural Laboratories (AAL) as the commercial soil and tissue testing laboratory for their clients. Summit Fertilisers and AAL decided to use PRI to rank the capacity of soils