http://researchcommons.waikato.ac.nz/
Research Commons at the University of Waikato
Copyright Statement:
The digital copy of this thesis is protected by the Copyright Act 1994 (New Zealand).
The thesis may be consulted by you, provided you comply with the provisions of the Act and the following conditions of use:
Any use you make of these documents or images must be for research or private study purposes only, and you may not make them available to any other person.
Authors control the copyright of their thesis. You will recognise the author’s right to be identified as the author of the thesis, and due acknowledgement will be made to the author where appropriate.
You will obtain the author’s permission before publishing any material from the thesis.
Impact Investing: Can impact be achieved in public markets?
Seeking additionality from investments.
A thesis
submitted in fulfilment of the requirements for the degree
of
Master of Management Studies in Finance at
The University of Waikato by
STUART PEARSON
2023
Abstract
Risk-adjusted returns are no longer the sole metric investors consider. A growing number of investors are now wanting to know that their capital is having a positive impact for society and the planet, as well as risk-adjusted returns. The existing options tend to focus on being ‘less bad’ and have mixed efficacy in delivering comparable risk-adjusted returns. In addition, they are unlikely to create any additional positive impact than otherwise would have been achieved without the investor’s capital, so why invest in them at all? This research examines an emerging investment strategy that has the potential to deliver additional positive impact as well as excess financial returns by repurposing a mechanism stigmatized by corporate raiders and private equity firms historically, that mechanism being shareholder activism. Our dataset of companies, who have been targets of such a strategy, exhibit materially positive excess stock returns over the shorter-term event window. Results suggest that this strategy is more effective when the target companies are smaller or when the investor acquires a larger shareholding. Importantly, the target companies across all subsamples experience a material uplift in environmental, social, and governance scores in the year after the activism event, suggesting success in creating additionality of impact.
Table of Contents
Table of Contents ... 3
1.0 Introduction ... 5
2.0 Background ... 10
3.0 Literature Review ... 16
Section 1: Status Quo SRI Strategies ... 16
Section 2: Shareholder Activism ... 20
Section 3: Spillover Effect ... 22
4.0 Hypothesis Development ... 23
5.0 Data ... 25
Section 1: Secondary Data ... 25
Section 2: Identifying Activism Events ... 26
Section 3: Sample Overview ... 27
Section 4: Endogeneity ... 27
6.0 Findings ... 29
Section 1: Cumulative Abnormal Returns ... 30
Section 2: Buy-and-hold returns ... 36
Section 3: ESG Score ... 39
7.0 Conclusion ... 42
8.0 References ... 45
9.0 Tables ... 51
Table 1: Descriptive statistics of the activism events within the sample .. 51
Table 2: CAR of the sample portfolio ... 52
Table 3: CAR of the small company size subsample portfolio ... 53
Table 4: CAR of the large company size subsample portfolio ... 53
Table 5: CAR of the small investment size subsample portfolio ... 54
Table 6: CAR of the large investment size subsample portfolio ... 54
Table 7: The long-term abnormal buy-and-hold financial returns ... 55
Table 8: ESG score change for the sample portfolio ... 57
10.0 Appendices... 58
Appendix 1: Description of activism events ... 58
Appendix 2: CAR Tables... 60
Appendix 3: Abnormal Buy-and-Hold Returns Tables ... 61
Appendix 4: Transformation of ESG scoring scale ... 62
1.0 Introduction
Traditionally, financial metrics, such as return and risk, have dominated the portfolio decision making considerations of investment and asset managers. In recent years, additional considerations have been included to reflect the needs of society and its stakeholders. This is referred to as sustainable investing (“SI”), which is an approach to investing that considers non-financial outcomes, such as environmental, social, and governance (“ESG”), in addition to financial metrics. This form of investing has benefitted from increasing awareness and demand in recent years (Tattersall, 2022). The raised level of awareness can be attributed to the increased attention of the role that traditional profit maximization behaviour of the financial markets and its various participants had in either the creation or exacerbation of some negative global events such as the Global Financial Crisis, COVID-19 pandemic, and cost of living crisis (Agnew et al., 2022; Klingler-Vidra, 2019). With this has come a surge in the underlying investors prioritising, or even demanding from their asset managers, that their invested capital achieves a positive impact, or at the very least, minimizes the negative impact (Agnew et al., 2022).
This drive for impact has left asset managers several options; first, maintain a business-as-usual approach and risk losing assets under management as investors transfer to more impactful asset managers. Second, make a minimal adjustment to practices to appease investors but fundamentally change very little, also referred to as greenwashing (U.S. Bank, 2022). Third, adapt to this changing demand and genuinely attempt to achieve meaningful financial and non-financial outcomes. This research focuses on the third option and examines the performance of a specific type of investment strategy that could be implemented.
Essentially, investors, asset managers, and market participants who desire to create financial and non-financial positive outcomes from their investing activity are seeking impact investments. The Global Impact Investing Network (The GIIN) defines impact investments as “investments made with the intention to generate positive, measurable social and environmental impact alongside a financial return” (The GIIN, 2022). Impact investing is a relatively new strategy within the investment sector with a more established presence in direct or unlisted markets, rather than listed or public equities (Trelstad, 2016).
One view on impact investment is that “a particular investment has impact only if it increases the quantity of the enterprise’s social outcomes beyond what would otherwise have occurred” (Born et al., 2013). This is also referred to as additionality.
Additionality can be further defined as “the extent to which desirable outcomes would have occurred without public interventions” (Impact Management Project, 2018).
Within public equities, this is a challenging task, some consider impossible, as an investment in a company is done so generally within a secondary market (with the exception of initial public offerings). Meaning the incoming investors’ capital only purchases shares of an outgoing shareholder and provides no additional capital for the investee company and very little, if any, difference in outcomes occurs.
While ESG investing has dominated the SI space, this strategy of investing also creates no, or limited, additionality, as companies generally already have high ESG scores before an asset manager invests. Any additional improvement in non-financial outcomes would likely have occurred without the investors’ capital.
Existing literature on the topic of additionality and impact investment in public equities is limited. The first stream of relevant literature this research examined was regarding the efficacy of existing SI strategies to deliver the intended results. Those intended results being both improved financial returns and non-financial outcomes.
The results are often contradictory, or inconclusive. Several studies noted that the outcomes may be due to data mining or selection bias. Intuitively, by excluding some companies or sectors due to their poor ESG scores, you are therefore overweighting the portfolio into other companies or sectors. For example, if a diversified portfolio removes all oil extraction and refinery companies from its portfolio then they are overweighting all other companies and sectors when compared to a market tracking portfolio, for a given portfolio size. If these remaining sectors did well over the sample period, as technology companies have in recent years, then the over performance should be attributed to a particular portfolio tilt rather than the implementation of the ESG investment strategy, although there may be overlap between the two.
The second stream of relevant literature is regarding an empirically proven investment strategy to deliver performance above benchmark and its applicability in the SI space. Specifically, we examine shareholder activism, sometimes referred to as corporate raiding, which is the mechanism by which an incoming shareholder acquires
a large block of shares in a company to influence its strategy, generally against management’s intentions. While historically such mechanisms have generally been stigmatized for short-term asset and value stripping, there is a sound empirical base for the strategy delivering change in a company’s behaviour to influence several factors, including firm value. Simply by initiating an activism event there are observed improvements within a company on the focal issue, regardless of the success of the activism event. There are also indicative benefits of shareholder activism which include increases in firm value, increases in ROA, positive changes in EBITDA, assets, and dividend yield, and, overall, abnormal positive returns. This is not just an initial reaction to activism by the target company, literature also suggests this change is long lasting, with positive improvements to ROA and Tobin’s Q three years after the activism.
Given the efficacy of shareholder activism to deliver positive changes to examined financial metrics, and that the mere act of initiating an activism event could deliver positive changes to non-financial issues, it suggests that shareholder activism is a potential mechanism through which additionality can be achieved. As the existing literature on shareholder activism is limited with regards to SI, this research is motivated by extending the existing shareholder activism research and concurrently providing an alternative to ESG investment as the predominant SI strategy.
This research combines the two streams of literature above to examine an emerging investment strategy that attempts to deliver both market-beating returns and impact with additionality at scale, which is the holy grail of impact investment.
This approach involves an asset manager acquiring a large shareholding of greater than 5% in a publicly listed company and influencing the company through appointments of directors to the board, shareholder proposals, and other similar shareholder activism behaviours. Essentially, utilizing the pre-existing activist investor mechanism and strategy, but doing so with non-financial goals, in addition to financial.
By identifying asset managers who have executed investments into companies based on this strategy, with non-financial outcomes as a consideration, we have built a portfolio of investments to examine the financial and non-financial outcomes to assist in determining whether additionality, and by extension impact, was achieved.
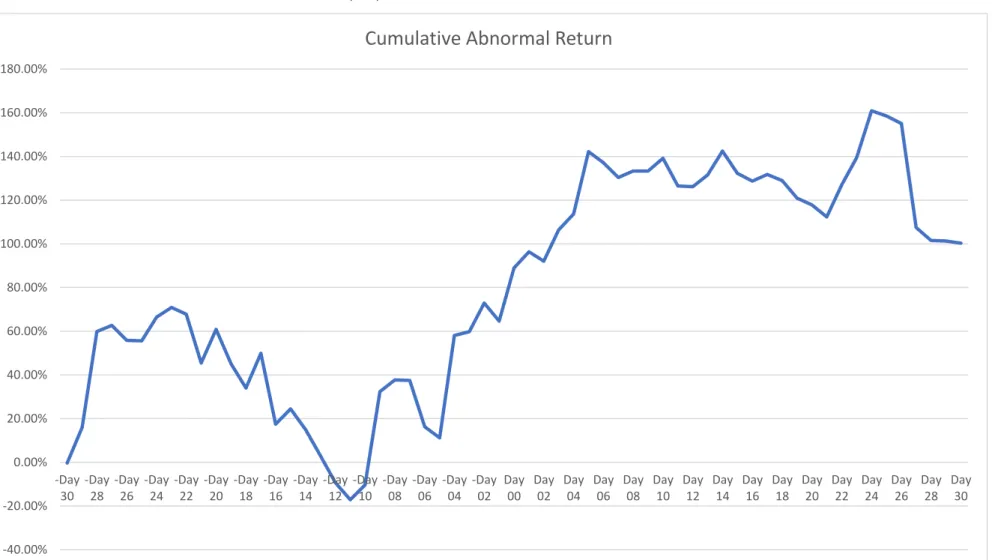
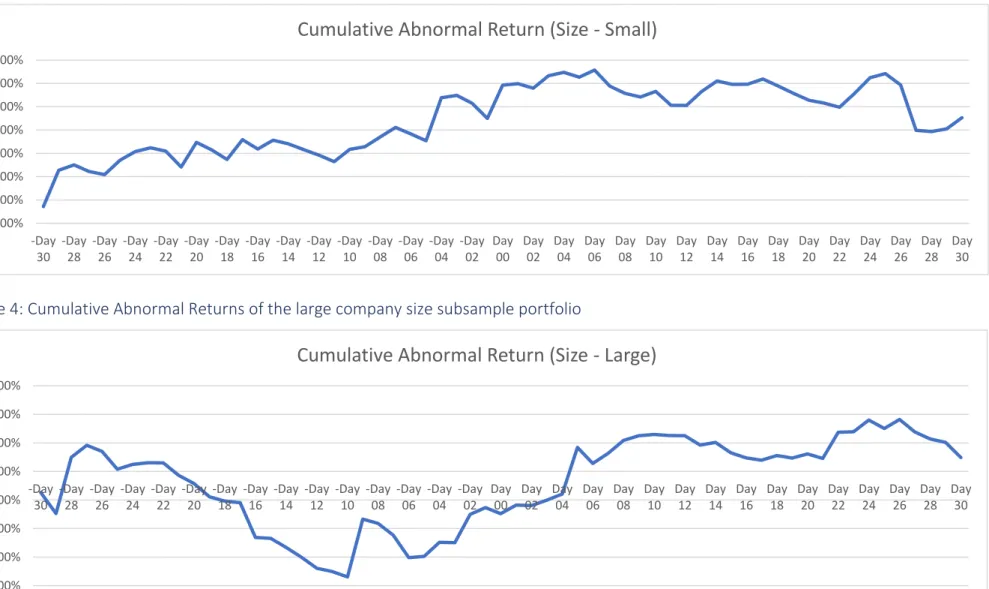
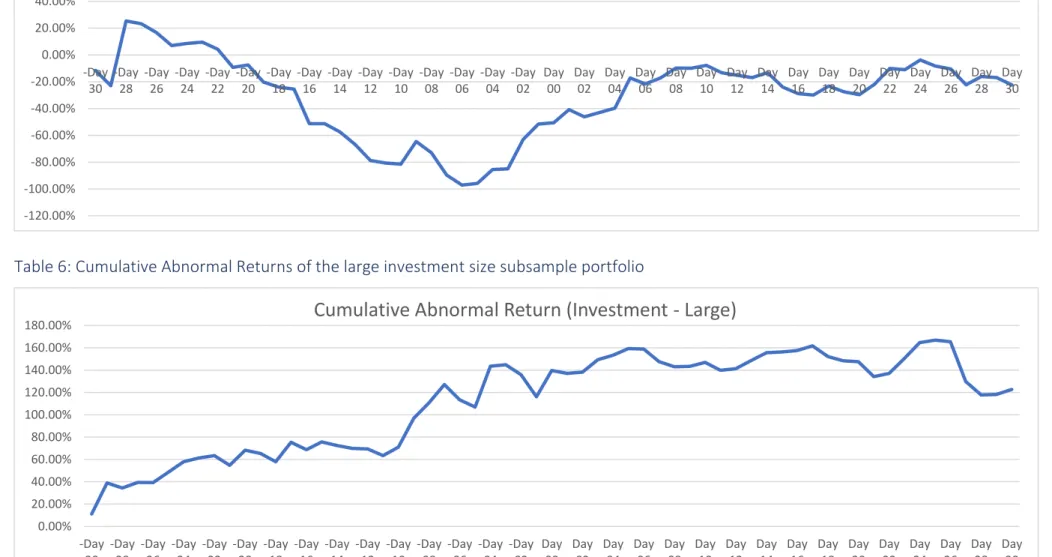
When considering the stock returns, we examined short-term performance with an event window of -30 day to +30 days, with day 0 being the day a public announcement of the investment was made by the asset manager, which included ESG considerations as a driver for investment. The whole sample achieved an industry- adjusted Cumulative Abnormal Return (“CAR”) of 100.33% on Day +30, suggesting that strategy could achieve significant financial returns above the market over the short- term investment horizon. When the portfolio was segregated into both company size (small & large) and shareholding size (small & large), the results diverged. Within company size, investments into small companies yielded a higher CAR compared to larger companies over the event window, 90.61% and 9.73% respectively. The same divergence was true, however inverted, with shareholding size. Smaller shareholdings had a CAR of -22.46% compared to larger shareholdings of 122.79%, which is a material difference. These results suggest a large investment or investment in a smaller company could result in market-beating financial returns over a short-term investment horizon.
We also examine medium- to long-term stock return across various time horizons, from Day +90 to Day +365 the results are mixed. While across all time horizons within the windorized sample there are a greater proportion of positive outcomes within the portfolio companies, the larger negative buy-and-hold financial returns skew results to the negative, particularly at Day +365. When the portfolio is split into company size and shareholding size, once again, investment into smaller companies or larger shareholdings achieve the best buy-and-hold returns over all examined event windows. We note that the sample size restricted the statistical significance of these findings, and the only statistically significant result was that a small shareholding resulted in a negative buy-and-hold return with a p-value of 0.02.
We next examine non-financial performance, using ESG scores as a proxy. We look at the ESG scores of the companies within the portfolio the year before the event (i.e., investment) and the year after the event and compare the difference. The results show a 98.36% occurrence of improvement in ESG scores across total ESG score as well as its individual pillars (environmental, social, and governance). The mean total ESG score improvement is 2.25 out of a total score of 12 (18.75% improvement). Once again, the results are more positive when it is an investment in a small sized company,
2.67 (22.22%), compared to large companies, 1.00 (8.33%), and large shareholdings, 3.00 (25.00%), compared to small investments, 1.50 (12.50%). This pattern largely holds true across the individual pillars (environmental, social, and governance pillars).
In addition, when assessing the non-financial impact and the individual pillars of the ESG score, we find it is the social score which is positively influenced the most with a mean improvement of 3.25 points (27.08%), then environmental of 1.75 (14.58%) and, finally, governance of 1.50 (12.50%). We note positive governance scores are only achieved when the company is small or when the investment is large. We assume this is due to the ability to appoint a director to the board in these scenarios and being more likely to influence the governance composition with larger shareholdings or within smaller companies. These results suggest that this strategy could achieve a non- financial positive impact.
Practically, the findings of this research could have importance to investors and asset managers alike. For investors seeking impact or additionality from their invested capital, they could potentially do so by aligning with asset managers who implement a similar strategy. For asset managers, the possibility of positive abnormal returns, while achieving impact, could lead to an increase in assets under management.
Academically, this research contributes to existing literature primarily by extending the research into shareholder activism and comparing outcomes against ESG scoring. Additionally, the research utilizes a novel dataset of companies which were exposed to activism events in the last 5 years. This in itself is a valuable contribution as literature on this topic is largely dated.
This paper proceeds as follows; first, we present background information on the need and advancement of sustainable investment practices in recent years. Second, we review literature on the topics of sustainable investing and shareholder activism which informs the hypothesis development. Next, we describe how data for the sample is collected, filtered, and presented. Then, we explore the findings of the sample by examining cumulative abnormal returns, buy-and-hold returns, and ESG score change of the sample and various samples. Finally, we present the conclusion of the research alongside the contribution and limitations of the findings.
2.0 Background
The multilateral climate change treaty known as the Paris Agreement was signed in 2015 with the ambitious goal of reducing global warming to below 2 degrees Celsius below pre-industrial levels (United Nations, 2022). To achieve such a goal social and economic transformation must take place, with few, if any, sectors remaining immune from the need to adapt their behaviours.
In addition to these environmental concerns, social considerations, such as poor labour conditions and inequality, have increasingly become a societal focus over a similar period. These considerations have historically been deemed to be the responsibility of government policy but have progressively become a consideration for the private sector also. The need for improved social outcomes from the private sector was accelerated by the onset of the Global Financial Crisis and COVID-19, which highlighted the pitfalls of a system which focuses purely on maximizing financial outcomes and emphasized the negative effect this causes some stakeholders (Klingler- Vidra, 2019; Agnew et al., 2022).
As a result, there has been widespread adaptation and integration of environmentally and socially conscious practices and policies by the private sector.
Governments are also reacting to this pressure by increasingly committing to more ambitious climate commitments to address their respective nations emissions (Mountford et al., 2021). At an individual level, customers are increasingly ‘voting with their wallets’ by spending on goods and services at organisations which align with their values (Preserve, 2020). The paradox of this transformation is that it has simultaneously been rapid and not-fast-enough.
This is causing obvious pressure on companies, who are now extrinsically motivated to improve environmental and social outcomes of operations, under threat of facing the displeasure of regulators, shareholders, customers, or public perception.
To highlight the growing importance, the Governance & Accountability Institute (2019) found that 20% of S&P 500 companies reported on their own sustainability and corporate social responsibility performance and issues in 2011, but by 2019 this figure had increased to 86%.
The investment sector is one sector facing growing pressure to contribute
positively to environmental and social outcomes. Investors, from retail investors to pension funds, are becoming increasingly selective with where they invest their capital. For asset managers responsible for investing on behalf of these capital allocators, continuing to invest without consideration for the negative environmental and social outcomes could result in a reduction in assets under management as investors move capital to other managers whose values are more aligned. One of the challenges to adoption within this sector is that asset managers and investors are risk- averse by nature and deviation from business-as-usual practices represents risk (Markowitz, H., 1952). Compounding this, asset managers are generally bound by a fiduciary duty to act in the financial best interests of their underlying investors (Tretina & Curry, 2021). Because there is a perception that to achieve improved environmental or social outcomes requires concessionary financial returns, this puts these environmental and social outcomes at direct conflict with the asset managers fiduciary duties (Madden and Dial, 2021).
To adapt to societal pressure, the investment industry has begun implementing sustainable investment (“SI”), which is investing that takes environmental, social, and governance information into account. Asset managers have begun to implement a range of these practices into their investment decision-making process. The extent of their SI practices can be best considered on a spectrum. At the lowest end of the spectrum is ESG unaware, i.e., a traditional fund which puts no weighting of ESG scoring into their investment decisions. Next is the adoption of exclusionary policy, also known as negative screening, which refers to excluding companies for investment consideration which operate within particular industries or that exhibit undesirable behaviours, such as oil extraction or weapons manufacturing. Subsequent to this, a spectrum of positive screening investment techniques exists, such as ESG aware; which requires a minimum level of ESG score to invest, ESG integration; which weights the ESG score alongside financial metrics to determine whether to invest or not, and then best-in-class investment; which is an extension of ESG integration where the investor will invest in the forerunners in ESG scoring for the particular industry (Fidelity, n.d.).
To get a grasp of the total size of the market, Bloomberg (2021) estimates that the ESG assets under management may exceed $53 trillion USD by 2025, which would equate to one third of all assets under management. The industry has grown at
approximately 30% per year over the past five years as the values of investors in funds push fund managers to incorporate environmental and sustainable practices or risk the investor moving their capital to another fund (Bloomberg, 2021).
The motivations for adoption of SI practices, particularly positive screening, vary and can include to achieve better risk-adjusted returns, better environmental outcomes, better societal outcomes, reward the ‘good’ companies, and punish the ‘bad’
companies (Jansson & Biel, 2011). As SI is a relatively new field, the data is constantly growing, however, as it does, there are conflicting results to some of the above claims.
Some influential people within the financial industry have spoken out about the ineffectiveness, or incoherence, of some of the arguments. Specifically, Damodaran (2020, 2021) who cites the inconclusive evidence of ESG in effecting firm value and that the sales pitch of improved risk-adjusted returns being achievable is flawed, as the market is efficient, and the stock price would already reflect any additional future returns attributed to having a high ESG score.
In addition, literature regarding these claims has been found to generally be ambiguous, inconclusive, or contradictory (Aupperle, Carrol, and Hatfield, 1985;
Griffin and Mahon, 1997; Rowley and Berman, 2000; van Beurden and Gossling, 2008;
Heopner and McMillan, 2009; Rivelli and Vivianni, 2015). Rivelli & Vivianni (2014) finds that positive results may be data-driven and a result in data mining or selection bias of the sample stocks. Further investigation is required within this area to conclusively determine whether these mechanisms do cause the positive outcomes, as claimed, or whether it is indeed a “goodness gravy train” for asset managers, who are able to use it to justify higher fees, as described by Damodaran (2021).
When considering the status quo SI strategies implemented by asset managers, such as negative and positive screening, and the effect on companies, a contradiction exists. In keeping with Damodaran’s labelling of ‘good’ and ‘bad’ companies as those with high ESG scores and those without, respectively (2021). ‘Good’ companies are invested in by asset managers with SI strategies, such as negative and positive screening criteria, generally after the company is already deemed ‘good’, as that is when it can pass the asset managers screening criteria. The major shareholders then appoint directors to the board, if they have not already done so, and the company is structured as a ‘good’ company (which was ‘good’ regardless of SI asset managers
investment) with ‘good’ shareholders and a board of directors, who are also ‘good’, who will likely hold environmentally and socially oriented values. Given the absence of any change from would have happened without the ‘good’ investor’s capita, there is a clear lack of additionality in this strategy.
The converse of this is the ‘bad’ companies, who fail negative and positive screening criteria, which results in having no, or few, ‘good’ investors as shareholders.
Therefore, the shareholding is owned by investors who only focus on financial gain, for simplicity and consistency these are referred to as ‘bad’ investors, who then nominate
‘bad’ directors to the board. The company then undergoes no positive social or environmental change, unless it is in the company’s best financial interest, because the governance has no reason or motivation to do so.
This creates a dichotomy between ‘good’ and ‘bad’ companies in terms of policies, practices, and environmental and social performance, where change is limited, and companies from both ends of the spectrum continue with business as usual. The issue with this is that the ‘bad’ companies are disproportionately responsible for the negative environmentally and social outcomes. To highlight this, 71% of global emissions are produced by just 100 companies, who would likely be considered ‘bad’ in terms of ESG scores (Riley, 2017). So even if the ‘good’ companies were perfect and produced net zero emissions, or even slightly positive social and environmental outcomes, it wouldn’t be enough to counterbalance the ‘bad’
companies.
In an attempt to get individual companies to consider the externalities of their business operations, a class action lawsuit was recently filed against one large company, Meta Platforms. They argue that if companies adopt the Friedman (1970) philosophy of shareholder primacy, in that the goal of a company is to maximise shareholder wealth, then they also should consider “that modern investors are generally diversified, so that their interests extend beyond (and may be in opposition to) the maximization of the value of future cash flows to be received from owning a company’s shares” (Alexander, 2022). Essentially, that by Meta Platforms maximising its own value it is simultaneously burdening other companies which the diversified shareholders will have holdings in. Should the negative externalities be greater than the increase in Meta Platforms value then this results in a net decrease in shareholder
wealth. This case is ongoing but may have repercussions in reducing the quantity or magnitude of ‘bad’ companies.
While this court case has promise, an alternative strategy for delivering excess returns and positive change already exists, although less well known, less marketed, and has had limited application in the SI subsector, that being shareholder activism.
Shareholder activism came to prominence in the 1980’s when investors, generally purely focused on financial returns, would acquire shareholdings of companies and have a strategy to implement significant change, generally in opposition to the desires of the current management. This method of shareholder activism has been labelled
“corporate raiding” and has since been heavily stigmatised (Isa, 1996; Weiner &
Weber, 2015). More recently, shareholder activism has been used as a mechanism to generate additional environmental and social change while delivering financial returns, which is the strategy this research will examine.
It is worth noting that shareholder activists can adopt a variety of tactics, ranging from passive to confrontational. The strategy more commonly used in the SI subsector is generally at the more passive end of the spectrum, such as dialogue or voting of existing shareholders, where if investors disagree with the companies’
governance, their disagreement is signalled but generally inconsequential (Fernandez Sanchez et al., 2020). This research focuses on the more active, and on some occasions confrontational, version of shareholder activism which literature is supportive of the strategies potential efficacy.
While the motivations of shareholders to implement shareholder activism may differ, from value protection, value maximisation to more values or more beliefs-based drivers the results have been positive (Lee & Lounsbury, 2011; Del Guercio & Hawkins, 1999). With coordinated and institutional shareholder activism leading to improved corporate social responsibility in the target companies (Neubaum and Zahra, 2006).
Grewal et al. (2016) also find that regardless of the success of a shareholder activism, the mere act of initiating and filling an activism event is related to the subsequent improvements in the performance of the company on the focal environmental and social issue.
From a financial perspective, indicative benefits of shareholder activism include
increases in firm value, increases in ROA, positive changes in EBITDA, assets, and dividend yield, and, overall, abnormal positive stock returns (Grewal et al., 2016;
Clifford, 2008; Cuñat et al, 2016; Krishnan et al., 2015; Ryan, 2006). Literature also points to this change being long lasting, with increases positive ROA and Tobin’s Q three years after the activism (Bebchuk et al., 2015).
This research examines whether shareholder activism as a strategy provides a mechanism through which asset managers can invest in order to achieve their aspirations of positive environmental, social, and financial outcomes and, as a result, impact.
As literature on the alternative SI strategies, such as negative and positive screening, is providing mixed results, in terms of effectiveness across environmental, social, and financial metrics, this emerging shareholder activism strategy could offer a potential alternative. David et al. (2007) supports the need for more active shareholding to deliver the desired outcomes by stating that ownership is not enough to elicit change, and shareholder activism is required to effect certain metrics.
The research will focus on asset managers who acquire shareholdings in companies with the purpose of implementing rapid change through activism, rather than existing shareholders who pursue more passive incremental change over their hold period. The hypothesis being that this strategy could result in positive additional change in both financial and non-financial metrics at a faster rate than the market would achieve on its own. In addition, upon achieving desired outcomes, asset managers could liquidate their position and repeat the process with another company, compounding the financial and non-financial returns. Given the immediacy of the need for change, environmentally in particular, this strategy could be attractive to asset managers and investors alike.
3.0 Literature Review
The literature review is segregated into two sections. First, into research that highlights the limitations of the status quo SRI investment strategy, being negative and positive screening based on ESG scores, and second, literature surrounding the efficacy of shareholder activism.
Section 1: Status Quo SRI Strategies
With regards to the status quo SRI investment strategies, several studies, and meta-studies, have found results to be ambiguous, inconclusive, or contradictory (Aupperle, Carrol, and Hatfield, 1985; Griffin and Mahon, 1997; Rowley and Berman, 2000; van Beurden and Gossling, 2008; Heopner and McMillan, 2009; Rivelli and Vivianni, 2015). The Rivelli & Vivianni (2014) research also indicate that positive results may be data-driven and a result in data mining or selection bias of sample stocks.
Aupperle et al. (1985) summarise that “although many studies concluded that a relationship existed, those studies that appeared to be the most methodologically sound did not reach that conclusion.” Their study, which used a forced-choice instrument to determine whether there was a relationship between a company’s corporate social responsibility and profitability also was unable to support the notion that such a relationship existed. Griffin and Mahon (1997) corroborate such findings using more recent data, differing metrics for determining corporate social performance, and several different accounting measures to examine the effect on a company’s financial performance. Once again, they find that whether a company is identified as a high or a low social performer does not correlate to any of the examined financial metrics.
Rowley and Berman (2000) examine possible conditions in which corporate social performance and financial performance could be positively correlated. The first they find is that the two metrics can indeed be positively correlated, however, they were unable to find a causal link. They report that these examples of positive correlation tend to be tied with corporate actions that simultaneously have positive social implications and operational efficiency gains. The researchers point to examples that improve employee relationships, such as on-site day care, and profit share
schemes. These actions “may lead to higher worker satisfaction and better recruitment, which could translate into better financial performance. It is not necessarily the case that the social good resulting from the actions create (cause) financial gain, but rather, the behaviour has implications in both realms”. The second condition they investigate is when “social good and financial performance are joint outcomes of specific firm behaviours, under some conditions, social outcomes of a firm’s actions will be causally related to financial performance.” They provide an explanation of when this causal link could be present is when “stakeholders tack action to sanction – reward or punish – a firm’s action in attempt to change or reinforce that behaviour.” This pathway is very similar to the proposed shareholder activism method this research examines.
Further examining existing SI research, in a recent study, Bernal et al (2021) finds that European publicly listed SI firms provide underperformance of risk-adjusted returns compared to the market. Contrary to the claims of superior, or returns in excess of the market, found in companies and investment vehicles with strong ESG scores.
From a theoretical perspective, Markowitz (1952) highlighted that the most efficient portfolio is one which follows the market and that no additional expected return can be gained without increasing the risk of the portfolio. Therefore, to implement SI practices is to exclude some companies and, by extension, have heavier weightings in others, which results in a less efficient portfolio in terms of risk-adjusted return. Le Maux & Le Saout (2004) reiterate this by indicating that negative screening some companies, and excluding some with lower ESG scores, the portfolio is less efficient and will result in a lower risk-adjusted return. Chow (1999) compliments these findings and shows that implementing screening like this could result in a sector bias, towards the more ESG friendly industries, and therefore increase portfolio risk.
In general, claims of ESG delivering outperformance fall into three categories;
first, that being ‘good’ can deliver higher profits for the company, presumably through adding a premium, and lower risk. Second, that ‘good’ companies will generate a higher return than ‘bad’ companies for investors. Third, and finally, that those ‘good’
companies help fight societal issues, such as climate change, or inequality (Damodaran, 2020).
Damodaran (2020) examines each of these categories of claims and the mechanisms through which they propose to deliver the claimed outcomes. Ultimately, for the value of a company to change either the cashflows, both present and future, must change or the risk to those cashflows (or both). When assessing cashflows to the firm, research examines revenue growth, which is a function of the size of the total accessible market and market share; operating metrics, which is determined by pricing power and cost efficiencies; and investment efficiency, which is a measure of how much investment is needed to deliver growth. The literature surrounding revenue growth shows little evidence that ‘good’ companies revenue grows at a faster rate than
‘bad’ companies, the effect of ESG on revenue growth is neutral at best and negative at worst, due to anecdotal evidence of ‘good’ companies, in some sectors, challenged with achieving scale. Operating margins also have mixed results as studies find that ‘good’
companies are comparatively more profitable however the question remains whether it is causal. It is inconclusive whether profitable companies find it easier to look good or whether doing good causes companies to be more profitable. Finally, investment efficiency is also difficult to determine a causal link with ESG. Regarding the cashflows of a firm the research which finds a “positive correlation between profitability and ESG scores trips up on the causality question” (Damodaran, 2021).
The cashflow risk has the strongest evidence of influence over company value.
This is spit into cashflow risk, proxied for using the cost of equity and cost of debt, and the failure risk, being the risk of a grievous or catastrophic event putting the business model at risk. Studies examine the cost of equity and find that investors aversion to
‘bad’ companies, through mechanisms like screening, increases the cost of equity, presumably through liquidity premium needing to be applied. The evidence within these findings however comes primarily through fossil fuel companies and further research could validate whether these findings hold consistent across all sectors.
Likewise, cost of debt studies indicate that ‘good’ companies can borrow money at a lower rate comparatively, but much of these examples are confined to the green energy sector. Exploring whether this is the case across the other sectors is important before extrapolating claims of reduced cost of debt to all ‘good’ companies. Failure risk also has neutral to positive research results that indicates that ‘bad’ companies are more likely to be exposed to crises and catastrophic risk (Damodaran, 2021).
The evidence noted above tackles the first of the ESG category of literature, that being a ‘good’ ESG companies delivers higher profits and reduced risks, and the evidence finds mixed or, at best, weakly positive results. The second category, that investing into ‘good’ companies, as denoted by high ESG scores, delivers excess returns for investors, however, is a simpler discussion. The ESG variable is public information and, should a high ESG score generate higher returns, then these higher returns would already be priced into the stock price. Let us examine three scenarios, which look at how a high ESG score could affect the company’s value, whether positively, neutrally, or negatively, and the corresponding market reaction and effect on long term returns.
In scenario one, the market has fully priced in the ESG effect on value, whether positive or negative, and therefore whether you invest in a ‘good’ or a ‘bad’ company will have no effect on excess returns. As we looked at earlier however, ‘good’ companies sometimes have lower risk, using cost of equity and debt as proxies, and therefore absolute returns, before adjusting for risk, in ‘good’ companies will be lower (and equal after adjusting for risk). Scenario two is if the market overvalues the high ESG score when determining stock price, and its corresponding effect on improved cashflow or reduced risk, then investing in ‘good’ companies will result in a comparatively lower risk-adjusted return than investing in ‘bad’ companies. The only scenario where this high ESG companies could deliver excess returns is if the market underestimated the effects of high ESG. In this scenario, ‘good’ companies would outperform however over time the error of underestimation would not go unnoticed by the market and it is likely that with more data the market would fully price in the effect and scenario one would play out (Damodaran, 2021).
Damodaran notes the importance of considering market pricing, as above, when considering the mechanism through which excess returns could possibly be generated by high ESG scores (2021). By considering how market pricing interreacts with excess returns logically the only place where excess returns could be present is investing ahead of, or during, a significant change in ESG value. This is important to note with regards to this research, which entails activist shareholders acquiring shares, forcing change, and then the market pricing the proposed change into firm value.
Given the motivation of the underlying investors can include value protection,
value maximisation, or values driven, as well as contributing towards additional positive environmental and social outcomes, the literature indicates that these investors are not getting any of their desired outcomes from the status quo SI investment strategies and an alternative should be explored (Del Guercio & Hawkins, 1999; Lee & Lounsbury, 2011).
Section 2: Shareholder Activism
The second stream of literature we will examine is shareholder activism.
Goranova and Ryan (2014) define shareholder activism as “actions taken by shareholders with the explicit intention of influencing corporations’ policies and practices”. Shareholder activism in the environmental and societal sense is a relatively young field of research. However, shareholder activism in a financial sense is not. In the 1980s the alternative term, corporate raider, was applied to those who used this strategy. These were typically asset managers, such as hedge funds and private equity funds, that would buy underperforming companies, sell off poorly performing assets, and then either sell the main business for a profit or claim bankruptcy and walk away with a profit from the sale of assets (Isa, 1996). Weiner & Weber (2015) highlight that this has historically been stigmatised as a tool to strip firms of corporate assets and values.
Shareholder activism can use several tactics. These can be grouped as follows:
shareholder dialogue or engagement; where activist shareholders meet with companies to discuss issues, shareholder proposals and voting; when activist shareholders propose a vote at an annual meeting on an issue in order to implement change, and shareholder punishment; disciplining managers through sale of shares, removal of certain members of management, or campaigns to cause damage to the irresponsible company (Fernandez et al., 2020). These methods range from passive and collaborative to active and hostile. This research portfolio contains examples across this whole spectrum but more commonly contains active examples, whereby an incoming shareholder implements change by appointing one or more directors onto the board, proposing voting, or through another active method.
When examining activism with an SI lens, Grewal et al. (2016) find that, regardless of the success of an activist’s proposal, the mere act of filing of shareholder proposals is related to the subsequent improvements in the performance of the
company on the focal environmental and social issue. Also, crucially, proposals on material issues are associated with a subsequent increase in firm value. Fernandez et al. find empirical evidence which suggests that activism is effective when institutional shareholders pressure firms through presentation of proposals or disclosing information that could cause reputational damage to irresponsible firms (2020).
Eesley and Lenox (2006) find that it is more likely to get a positive response to an issue if they have greater power. This is examined further by Mitchell et al. (1997)
& Gifford (2010) to understand which of a company’s stakeholders views the management prioritises. They categorise shareholders into classes with the following attributes: power, legitimacy, and urgency. There is a variety of combinations of classes, which are ranked in likelihood of influencing management, with the combination of all three attributes eliciting a high degree of salience to the firm’s management (Mitchell et al., 1997). Within our sample portfolio, all three elements are present to varying degrees.
Further financial performance benefits are found by Cuñat et al. (2016), who show an increase in ROA is present after a proposal on pay, Clifford (2008) show activism leads to positive changes in EBITDA & assets, as well as dividend yield.
Krishnan et al. (2015) and Ryan (2006) show activism leads to positive abnormal returns. Bebchuk et al. (2015) also show that activism leads to positive ROA and Tobin’s Q, three years after the activism event.
There are multiple ways to present a shareholder proposal, and on different topics. Of these, Neubaum and Zahra (2006) find that coordinated and institutional shareholder activism could lead to improved corporate social responsibility. Boyson &
Mooradian (2011) examine activism aimed at changing corporate governance and find this causes significant long-lasting change. Activism from hedge funds generates positive abnormal returns, improves operating performance and corporate innovation (Brav et al., 2014). Caton et al. (2001) supports these findings noting that “institutional activism will improve performance in underperforming firms if they can respond to the challenge”. Overall, the literature points to evidence that shareholder activism can create long-lasting improvements.
The literature on impact investment within the public equities space is limited,
although it is growing. Kölbel et al. (2020) in particular is one of the few pieces of research which examines delivering impact through shareholder engagement within public equities. Their findings suggest that impact can be achieved through shareholder engagement and that screening of companies should be done only when there is an “absence of specific environmental, social, and governance practices that can be adopted at reasonable costs”. This contrasts with how the status quo SI asset managers screen and could provide an insight into which “bad” companies to screen and which to not.
Section 3: Spillover Effect
An additional stream of literature exists which points to an additional benefit of shareholder activism, which is not present in the status quo SI investment strategy, which is the spillover effect. The spillover effect encourages companies in the same industry as one who has just had an activism event, to change in fear of them becoming the target of activism. Gantchev et al (2017) note that the mere threat of shareholder activism increases the operating performance of peer firms. While outside the scope of this research, the spillover effect with regards to shareholder activism is a potential topic for further research.
4.0 Hypothesis Development
The literature highlights the potential effectiveness of shareholder activism in contributing long-lasting improvements in financial metrics and stock returns of target companies (Cuñat et al.,2016; Clifford, 2008; Krisnan et al., 2015; Ryan, 2006; and Bebchuk et al., 2015). For this reason, we hypothesize that by repurposing the shareholder activism mechanism to address a company’s ESG shortcomings an investor could create additional change which otherwise would not have occurred without the activism event. We anticipate seeing this reflected in the target companies ESG scores positive rate of change.
Historically, the most common application of shareholder activism had the primary purpose of increasing shareholder value (Isa, 1996). As such, the changes implemented were made with the lens to maximise the financial returns, generally with a short- to medium-term time horizon. Should an activist shareholder’s primary motivation be improvement of ESG related factors, particularly with a longer-term time horizon, this may conflict with the short-term financial interests of both the company and some existing shareholders. For example, increasing the number of employees on the living wage, or changing inputs to more environmentally friendly (and more expensive) alternatives. Any improvement (or lack thereof) in the financial and non-financial performance of the target company is a function of the success of the activism event and the changes actually implemented. The magnitude of the conflict of interest between the activist and the company and existing shareholders will play an important part in the success in generating positive financial and non-financial outcomes and, therefore, the additionality of the activism event.
We do not believe that it can be assumed that the shareholder activism mechanism itself improves financial metrics and shareholder returns. From the perspective of the short-term stock returns, it is unlikely the activist event will elicit any material changes in the short-term stock returns; however, the short-term stock price will reflect the market’s reaction to the public information surrounding the activism event. We hypothesize that short-term stock returns will improve upon the announcement of an activism event, particularly if there is a strong likelihood of success. As more public information about the likelihood of success and the underlying strategy becomes apparent the stock price may change.
When considering the status quo SRI strategies ability to deliver financial and non-financial outcomes, as we have discussed, the literature is mixed. As Damodaran (2021) dissected, the mechanism through which SRI strategies could potentially create abnormal financial returns have limited evidence for support. Where there is potential is taking advantage of market pricing, i.e., investing ahead of or during a significant change in ESG score. Therefore, when an activist event is accompanied by a subsequent improvement in ESG score we anticipate this to be reflected in the medium- to long- term stock return.
Based on the findings within the literature we hypothesize that upon a shareholder activist investing in the target company there will be an improved short- term cumulative abnormal return, longer-term abnormal buy-and-hold returns and environmental, social, and governance scores.
Testing the statistical significance of the results will be determined using the two-means t-test (Chieh, 2010). A statistically significant result is one in which the p- values are less than 0.05 level (or 5 percent). Should this occur, we can reject the null hypothesis, and claim that the results are statistically significant.
5.0 Data
Section 1: Secondary Data
Data for the research was gathered from several secondary data sources.
Secondary data has a wide range of benefits over primary data for this form of research. This includes reduced time to collect, a smaller budget required, replicable results, and access to large datasets (Saunders et al., 2016).
Stock returns metrics are retrieved from Refinitiv Eikon (“Eikon”). Eikon provides a rich resource for quantitative and qualitative data. This includes valuable information such as corporate actions, stock price data, return-on-assets, and industry classification codes which can date as far back as the 1950s (Refinitiv, 2021).
Regarding SI information, ESG scoring will act as a proxy. There are multiple ESG rating agencies, however scores can vary between providers and distort findings.
Berg et al. (2021) investigate the instrument validity of the ESG providers as well as the susceptibility to ‘noise’ of each. This research will use Refinitiv ESG scores, due to ease of access. As Berg et al. notes, there can be varying results between ESG scoring providers. Recent research examined six prominent ESG ratings agencies and their scoring correlation and found the correlation to be between 0.38 – 0.71, which is considered “relatively weak”. Contrast this with a 0.92 correlation between credit agencies and the distortion of using only one ESG provider becomes apparent (Agnew et al., 2022). With this research limited to Refinitiv’s ESG scoring, this creates a limitation to any potential findings. Further research into this topic could incorporate a variety of providers, such as Standard & Poor’s Global (“S&P Global”) ESG scoring and Sustainalytics ESG scoring for additional validity. S&P Global (2021) scores incorporate nearly 1,000 data points of over 7,300 companies’ responses to survey data and/or publicly available data. Given the scope and depth of historical data from primary research undertaken by S&P Global, adopting this dataset for future research could be beneficial for validation of findings within this research. “Refinitiv (previously known as ASSET4) is a key data provider whose scores are used extensively by researchers and companies; however, their ESG scoring methodology allows the scores from the five most recent years to change post-publication without any announcement” (Sahin et al., 2022). This limitation obviously has relevancy for this research as the period of data examines (2017 – 2022) completely overlaps with the
five-year period of ESG scores which are subject to change. This creates a limitation in the replicability of the findings, as the ESG scores can change for the sample period post-completion of this research.
Section 2: Identifying Activism Events
To identify shareholder activism events, the research follows the methodology of Klein & Zur (2009) and will primarily identify shareholder activism events by Schedule 13D filings. These are required to be filed when an investor acquires more than 5% of any class of a company’s equity shares (Kenton, 2021). Schedule 13D filings are retrieved from the Securities and Exchange Commission (“SEC”) website and are publicly available. As this filing captures incoming shareholders who have a sizeable shareholding, their shareholder proposals for change could hold greater importance weighting from management and more likely to be adopted. Where the filing date falls on a non-business day, the next business day is adopted.
At the time of filing incoming shareholders must identify themselves and their purpose of acquiring the shares within the Purpose Statement. These filings will be cross referenced and filtered by keywords within the Purpose Statement. If particular keywords, such as “sustainable”, “environmental”, “social”, or “ESG” are present in the Purpose Statement then the filing is included within the sample. The limitation of this method of identification is that the Purpose Statements tend to be generic in nature and extremely broad. To overcome this challenge the research follows the methodology of Brav et al. (2008) by further identifying activism events with SI motivations by searching Factiva for news events with keyword “Schedule 13D” in addition to “environmental”, “social”, or “ESG”. This method uncovered several additional activism events. Where the Purpose Statement in the Schedule 13D was a legal document and generally quite generic and vague, asset managers appeared to be more forthright with their purpose of investment in the media or company statements, particularly when they wanted to elicit pressure or urgency for change on the target company. In addition, we noted who the filers of Schedule 13D filings were, i.e., the investing asset manager, and included any additional filings these entities had made in the sample period into the sample.
Further manual filtering was completed to discard any false positive activism events. These false positives included company restructurings, initial public offerings,
transfers of shareholdings between related entities, and purely commercially motivated events.
The research examines activism events from the 1st January 2017 to the 30th April 2022.
Section 3: Sample Overview
The remaining sample contains 17 activism events with environmental, social, or governance motivations from 2017 to 2022. This sample size provides the primary limitation on the findings within this research. As the sample size is so small this almost guarantees the lack of statistical significance of findings. Commonly, research extends the sample years to capture a larger sample and increase the statistical significance however, with such an emerging investment strategy, extending the sample window before 2017 would gather no, or few, additional sample events. To illustrate the growing nature of this strategy, there were more sample events in the last 18 months of the sample window than there were in the four years before, so as time elapses, we assume the sample size will get larger and statistical significance of the findings will improve. For the purposes of this research, the terms asset managers, investment managers, and shareholders are sometimes used synonymously. Despite the capital invested coming from the underlying investors, such as pension funds or high net worth individuals, it is the asset manager who undertakes the management of the corporate actions, such as proxy voting.
Section 4: Endogeneity
An important element of empirical design is addressing any endogeneity concern. Endogeneity has two considerations. The first is the situation where the dependent and independent variables in a model are interdependent, leading to biased results. This is also referred to as simultaneity. In finance, this can arise when the stock price of a company is influenced by factors such as market conditions or economic conditions, making it difficult to determine the true effect of a specific event on the stock price. In addition, there is the omitted variable problem, where the relationship modelled is causal or correlated to a variable other than the variable examined (Gippel et al., 2015).
To mitigate any endogeneity concerns we have adopted cumulative abnormal
returns (“CAR”) as a primary metric within our empirical design. CAR separates the effects of a specific event, in this case the activism event, from other factors, such as market forces, that may affect the stock price, therefore reducing simultaneity concerns. By measuring the CAR, we can obtain a more accurate estimate of the impact of the event, independent of other factors that may influence the stock price. This allows for a more precise evaluation of the effect of a specific event on the stock market and helps to provide more reliable results for financial decision-making purposes. We would highlight that the possibility of omitted variables influencing outcomes given the limitation of the small sample size.
6.0 Findings
There is no public database of activist impact investors or asset managers in public equities. We therefore need to identify an independent sample based primarily on Schedule 13D filings, which are the mandatory federal securities law filings under Section 13(d) of the 1934 Exchange Act that investors must file with the SEC within 10 days of acquiring more than 5% of any class of securities of a publicly traded company if they have an interest in influencing the management of the company. In particular, Item 4 of Schedule 13D requires the filer to declare its reasons for acquiring the shares (Brav et al., 2008). As discussed previously, these Purpose Statements are filtered by keywords, such as “ESG”, to identify potential positive matches. As a secondary method we search Factiva using key words to identify other potentially relevant events. The tertiary identification method involves looking at the investors or asset managers previous identified and review their other Schedule 13D filings and Factiva articles for any other investments which may have been false negatives in the earlier two methods.
Once completed, events are manually filtered through to remove false positives, which include some initial public offerings or a transfer of shares between related parties.
The remaining events within the sample are displayed within Table 1. There are 17 events where the above criteria are present between 2017-2022. The median shareholding of these investors is 7.27% and the median log size, as determined by market capitalization, is 3.44.
There are several interesting observations from this sample. First, as already covered, it is extremely small. This either suggests that the criterion within this research is overly strict or that there are few examples of asset managers pursuing this strategy to date. Second, the number of events within a particular year is increasing.
From zero events in 2017 and 2018 to five in a partial 2022 year, this strategy is more frequently occurring year-on-year. Third, there are only five asset managers or investors who have implemented this strategy with two asset managers contributing to 82.35% of the events within the sample. This presents a limitation as the results will be heavily influenced by the performance of a small number of asset managers and could be indicative of the asset managers ability to select and manage investments, rather than indicative of the strategy itself. When we discuss the endogeneity concern, the ability of the asset managers may be an omitted variable.
Finance theory suggests that capital markets are efficient and reflect all publicly available information about the company within the company’s stock price (Fama, 1970). Therefore, a return event study can be used to quantify an event’s impact on the stock returns of a company, also known as abnormal returns. In this case, the event in question is the filing of a Schedule 13D form with the SEC.
Section 1: Cumulative Abnormal Returns
Abnormal returns can be calculated by estimating the normal returns, i.e., the returns that would have been earned should the event not have taken place, and the actual returns, which are empirically observable. Abnormal returns are totaled across the given sample window which then derives the cumulative abnormal return (“CAR”).
A positive CAR reflects the event having a positive effect on the company’s stock price and vice versa.
We examine the short-term stock returns, which reflects the market’s reaction to news of the Schedule 13D filing. In following Klein & Zur (2009) methodology, we define “Day 0” as the filing date recorded by SEC in the Schedule 13D filing data. Our short-term event begins on Day-30. The purpose of starting the event window before Day 0 is to allow for the 10-day filing window, which is the SEC giving asset managers 10 days to file their Schedule 13D upon achieving a shareholding of 5% or more. This wider event window start period then captures potential information leakage, and pre- filing price pressure that may occur to the activist accruing a large stake in a relatively short period of time (Klein & Zur, 2009). The end of the event window shall be Day+30.
This helps capture the lag in information dissemination through subsequent press conferences and media releases and market participants acting on the information following the filing event.
As per Klien & Zur (2009), we calculate and measure abnormal stock returns using industry-adjusted returns, which is the difference between the target firms buy- and-hold return and the return for all firms using the Fama-French (1997) 48-industry code. By calculating the CAR, we estimate the returns that would have taken place should the event not occurred (“normal returns”) from the actual returns. While the actual returns can be empirically observed, the normal returns must be estimated using Equation 1.
Equation 1: Cumulative Abnormal Returns
Where:
t1 = the start of the event window;
t2 = the end of the event window; and
AR = Abnormal Return as calculated as per Equation 2.
Equation 2: Abnormal Return
Where:
= actual stock return on the specific date; and = Expected return
Therefore, to obtain the company returns and index returns we used the following procedure:
Step One: Find relative dates for each sample company.
- Record the SEC filing date for each individual company within the sample portfolio.
- Calculate the relative date for each day within the -30 and +30 day event window.
Step Two: Find the sample company’s stock price for each relative date.
- Obtained the sample company’s stock price at the close for each relative date using Refinitiv Eikon financial data.
- Where the date falls on a weekend or public holiday, therefore markets are
closed, the close of the previous market is used.
Step Three: Calculate the daily returns for each individual firm, i.e., Ri,t from Equation 2.
- Using a simple returns calculation (Rt = (Pt – Pt-1) / Pt-1) where R = Returns and P = Price) was calculate percentage daily return for each individual company and each individual day within the sample window (Zivot, 2015).
- We record company price data for Day -31 for the purposes of calculating Pt-1
on Day -30.
Step Four: Calculate the daily returns for the corresponding Fama-French 48-industry indices, i.e., the Expected Return or α + (βiRm,t) from Equation 2.
- Each sample company has a publicly available Standardised Industrial Classification code (“SIC code”), this is converted into a 48-industry index of similar industry companies (French, 2022).
- Record the sample company’s corresponding index’s daily return on the date identified in Step One using French (2022a) Data Library.
Step Five: Calculate the daily abnormal return for each sample company on each day of the event window.
- We calculate this using Equation 2 above, or put more simply, the sample company’s daily return – 48-industry index return for the specified date.
Step Six: Calculate Cumulative Abnormal Return for each sample company using Equation 1.
- Sum the abnormal returns achieved by each sample company over the -30- to +30-day event window.
Step Seven: Calculate the Cumulative Abnormal Returns for the sample portfolio.
- Sum the abnormal returns for each sample company to determine the CAR for an equally weighted portfolio.
The use of abnormal returns, which is adjusted for industry, as opposed to
absolute returns, is an important inclusion in the empirical design given the volatility of the equities market over the sample period. Several notable market shocks occurred, including the COVID-19 pandemic, which created non-standard capital market behaviour, both positively and negatively. Particular sectors were adversely affected, and remained below pre-pandemic peaks for quite some time, namely, aerospace, banking, and oil and gas (Bradley & Stumpner, 2022). Conversely, technology companies, amongst others, saw significant positive market capitalisation change over the same period. The empirical design of the research controls for these industry specific market forces. We note that the idiosyncrasies of sample companies, usually mitigated by large sample sizes, remain present within this research, and is reflected in the lack of statistical significance of most findings.
The methodology uses the Fama-French 48-industry returns as a baseline from which abnormal returns are calculated. An argument could be made for building a comparison or control portfolio of other activism events which only include a portfolio of companies that have also experienced activism events, although without the motivations of delivering positive environmental, social, or governance outcomes. This research excludes such a comparison method as we are more focused on alternative to the status quo SI strategy or holding a diversified portfolio, rather than a comparison between our research strategy and that of corporate raiders and the like. We do note however that such a comparison would provide interesting outcomes as it could point to whether pursuing activism with some non-financial desires results in concessionary financial metrics when compared to those activism events with a purely financial purpose. The dataset to examine this is also beyond the resources available for this research.
[Insert Table 1 & 2 here]
Table 2 illustrates the sample portfolios CAR over the sample window. The findings displayed within Table 2 indicate a material positive effect on the company’s stock price within the examined event window. As shown, returns are lowest on Day - 11 and highest on Day 24. More detailed tables are located within Appendix 2. The positive market reaction to the publicly available news of an activism event with environmental, social, or governance targets suggests that the market views this as having positive implications for company value. Given it is a short-term event window,