Machine Learning and Natural
Language Processing in Stock Prediction
by
Jinan Zou
A thesis submitted for the degree of
Doctor of Philosophy
March 20, 2023
Australian Institute for Machine Learning (AIML)
The University of Adelaide
Contents
Declaration xiii
Acknowledgements xv
Publications xvii
Abstract xix
1 Introduction 1
1.1 Motivation. . . 3
1.2 Main Contributions and Thesis Outline. . . 4
1.2.1 Main Contributions . . . 4
1.2.2 Thesis outline . . . 5
1.3 Problem Formulation . . . 6
1.3.1 Stock Movement Prediction . . . 6
1.3.2 Document-level Event Extraction . . . 7
1.3.3 Out-of-distribution Detection . . . 9
2 Literature Review 11 2.1 Conventional Methods Applications . . . 11
2.1.1 Stock Movement Prediction . . . 11
2.1.2 Event Extraction . . . 13
2.1.3 Out-of-distribution Detection. . . 14
2.1.4 Limitations of Conventional Methods . . . 15
2.2 Deep Learning Based Methods Applications . . . 15
2.2.1 Stock Movement Prediction . . . 15
2.2.2 Event Extraction . . . 29
2.2.3 Out-of-distribution Detection. . . 32
2.3 Basics of Machine Learning Methods . . . 34
2.3.1 Conventional Methods . . . 34
2.3.2 Transformer. . . 35
2.3.3 Other Deep Learning Methods . . . 36
2.4 Conclusion . . . 38
3 Astock: An Automated Stock Trading Based on Stock Movement Prediction Analyzing Model 41 3.1 Introduction . . . 42
3.2 Related Work . . . 45
3.2.1 Text-based Stock Prediction . . . 45
3.2.2 Semantic Role Labeling and Self-Supervised Learning Approach . 46 3.3 Data Creation . . . 47
3.3.1 Standard of news and stock factors collection . . . 47
3.3.2 Task Formulation . . . 48
3.4 Methodology . . . 49
3.4.1 Semantic Role Labelling Pooling . . . 50
3.4.2 Self-Supervised Learning based on SRLP . . . 52
3.5 Experiments . . . 54
3.5.1 Implementation Details. . . 54
3.5.2 Evaluation metrics . . . 54
3.5.3 Compared Methods . . . 56
3.5.4 Stock Movement Evaluation . . . 58
3.5.5 Profitability Test in Real-world . . . 60
3.6 Conclusion . . . 62
4 Financial Document Event Extraction: A Generative Model is All You Need 67 4.1 Introduction . . . 68
4.2 Preliminaries . . . 70
4.3 Methodology . . . 71
4.3.1 Entity Recognition . . . 72
4.3.2 Context-Aware Encoding of Entities and Sentences . . . 72
4.3.3 Event Type Prediction . . . 73
4.3.4 Event Extraction . . . 74
4.3.5 Optimization . . . 77
4.4 Experiments and Analysis . . . 77
4.4.1 Experimental Setup . . . 77
4.4.2 Results . . . 79
4.4.3 Ablation Studies . . . 80
4.5 Related Work . . . 83
4.6 Conclusion . . . 84
5 Semantic Role Labeling Guided Out-of-distribution Detection 87 5.1 Introduction . . . 89
5.2 Related Work . . . 90
5.3 Methodology . . . 92
5.3.1 Semantic Role Labeling . . . 94
5.3.2 Self Supervised Learning based on SRL . . . 94
5.3.3 Loss Functions . . . 95
5.3.4 Scoring Functions . . . 96
5.4 Experiments . . . 97
5.4.1 Datasets . . . 97
5.4.2 Evaluation Metrics . . . 99
5.4.3 Experiments Setting . . . 99
5.4.4 Compared Methods . . . 100
5.4.5 Main Results . . . 100
5.4.6 Ablation Studies . . . 101
5.5 Conclusion . . . 101
6 Conclusion and Future Works 103 6.1 Conclusion . . . 103
6.2 Future Work . . . 105
6.2.1 Stock Movement Prediction . . . 106
6.2.2 Document-level Event Extraction . . . 106
6.2.3 Out-of-distribution Detection. . . 107
A Intro (Chapter 1) Appendix 109 A.1 The original complete document. . . 110
B Astock (Chapter 3) Appendix 111 B.1 Trading Strategy. . . 111
B.2 Stock Factors . . . 113
B.3 The study of using different alpha value . . . 113
C Document-level Event Extraction (Chapter 4) Appendix 115 C.1 More Experimental Details . . . 115
D SRLOOD (Chapter 5) Appendix 117 D.1 More Experimental Details . . . 117
D.2 Experiments with different masking probabilities . . . 117 D.3 Full Results . . . 118
Bibliography 121
List of Tables
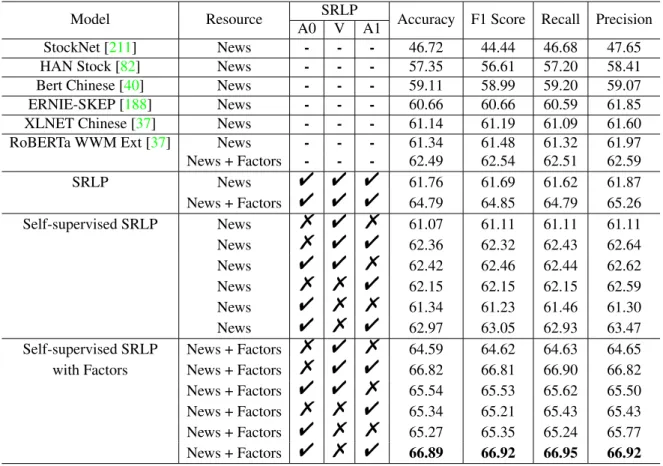
3.1 The comparison between Astock and other existing widely-used stock move- ment prediction dataset. . . 47 3.2 The performance comparison(%) of in-distribution evaluation on our scheme
and others to demonstrate the effectiveness of our self-supervised SRL method.
"indicates that the model adopted this Semantic role’s pooling information.
- indicates that the method does not adopt this semantic role’s pooling. % indicates that the semantic role’s pooling is masked. . . 55 3.3 The comparison (%) of the out-distribution evaluation on stock movement
classification with StockNet, RoBERTa-WWM Ext, HAN Stock method and our method from 1/1/2021 to 12/11/2021. . . 59 3.4 The comparison (%) of the out-distribution evaluation with StockNet, HAN
Stock, RoBERTa-WWM Ext and our method in each quarter from 1/1/2021 to 12/11/2021. . . 60 3.5 The comparison of profitability test on Maximum Drawdown(%), Annual-
ized Rate of Return(%), and Sharpe Ratio Rate(%) with strong baselines, XIN9, CSI300 and our proposed method from 1/1/2021 to 12/11/2021. . . . 60 4.1 Overall event-level precision (P), recall (R) and F1-score (F1) on the ChFi-
nAnn dataset. The top two results are highlighted in red bold and blue italic fonts, respectively. . . 78
4.2 F1-score for all event types and the averaged ones (Avg.) on single-event (S.) and multi-event (M.) sets. The top two results are highlighted in red
bold and blue italic fonts, respectively. . . 79
4.3 Ablation study: F1-score of variants of our model under each event type and the average performance. . . 82
5.1 OOD Detection performance (in %) ofRoBERTaLARGE trained on the four different ID datasets. Due to space limits, for each of our training ID datasets, we report the macro average of AUROC and FAR95 on all OOD datasets (See Appendix for full results). Following the standard [240], the results of our SRL-guided Self Supervision method achieving SOTA on both evalua- tion metrics are in blue italic fonts. . . 100
5.2 Ablation study of our method on IMDB and TREC . . . 101
C.1 The hyper-parameter setting. . . 116
D.1 OOD detection AUROC (%) of ours and w/Lmargin[240]. . . 119
D.2 OOD detection FAR95 (%) of ours and w/Lmargin[240]. . . 120
List of Figures
1.1 An example of a document from a Chinese dataset proposed by Zheng et al.
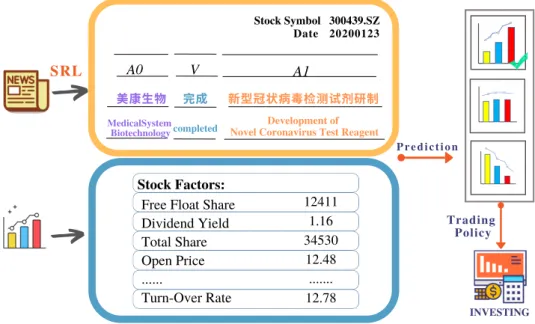
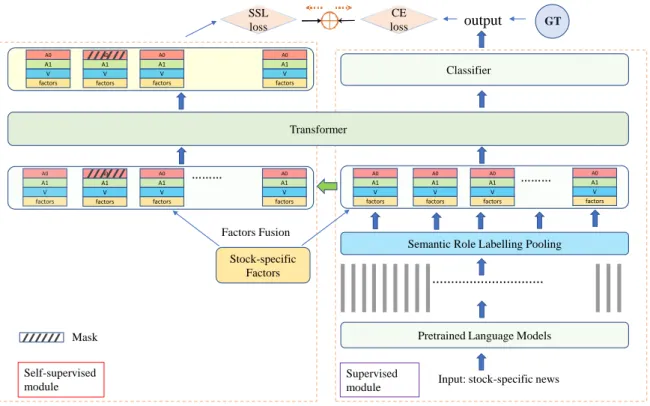
[236] that was created to study the document-level event extraction for stock companies’ announcements. The document has been translated into English for this illustration. Entity mentions are highlighted. The original document can be found in Appendix A. Due to space constraints, only four sentences and three additional roles for each event type are shown. . . 8 3.1 Overview of the automated stock trading system. . . 43 3.2 Overall framework of our approach, including a domain-adapted pre-trained
model (RoBERTa WWM Ext), Semantic Roles Pooling, transformer layer, self-supervised module (left part), and the supervised module (right part).
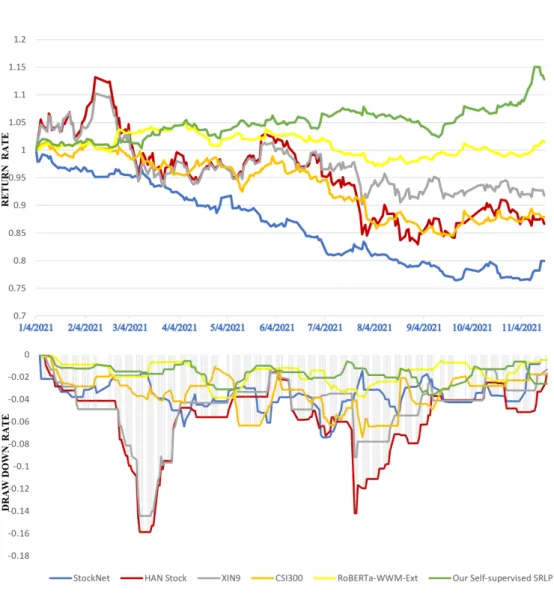
The green arrow represents a duplicate for the SRLP. The final result is gen- erated from the stock movement classifier, and the total loss is obtained from the self-supervised SRLP part and supervised stock movement classification part. . . 50 3.3 A Semantic role labelling example for a piece of news. . . 51 3.4 The comparison for the real trading performance on Return Rate, Draw
Down Rate with CSI300 index, XIN9, Roberta WWM Ext, HAN Stock, StockNet and our proposed method from 1/1/2021 to 12/11/2021 . . . 61
4.1 A simplified DEE example of the event type Equity Freeze with five related argument roles: Equity Holder, Froze Shares, Legal Institution, Start Date
andEnd Date. . . 69
4.2 The overall architecture of our decoding transformer model. Given a doc- ument, we first extract entities (e.g., “HaiTong Co.,Ltd”, “Liu Baichun”, “800,000 shares”), which serves as candidates for event arguments (Sec- tion 4.3.1). Then we predict event types that appeared in the document via learning global-awareness representations of entities and sentences (Sec- tion 4.3.2 and 4.3.3). Last, we predict the number of events for each event type and leverage a decoding transformer to generate the necessary informa- tion for event extraction (Section 4.3.4). . . 71
4.3 Illustration of generating the first event record. . . 74
4.4 The percentage of documents with different numbers of sentences in the test split. . . 81
4.5 Performance of our method against two state-of-the-art methods w.r.t. dif- ferent document lengths. . . 82
5.1 Model architecture of our framework. . . 93
A.1 The original complete document in Figure 1.1.. . . 110
B.1 The weight calculation process of each transaction. . . 112
B.2 The effect of the alpha on the accuracy performance. . . 113 D.1 Performance on different masking probabilities on four benchmark datasets. 118
Declaration
I certify that this work contains no material which has been accepted for the award of any other degree or diploma in my name, in any university or other tertiary institution and, to the best of my knowledge and belief, contains no material previously published or written by another person, except where due reference has been made in the text. In addition, I certify that no part of this work will, in the future, be used in a submission in my name, for any other degree or diploma in any university or other tertiary institution without the prior approval of the University of Adelaide and where applicable, any partner institution responsible for the joint-award of this degree.
I acknowledge that copyright of published works contained within this thesis resides with the copyright holder(s) of those works. I also give permission for the digital version of my thesis to be made available on the web, via the University’s digital research repository, the Library Search and also through web search engines, unless permission has been granted by the University to restrict access for a period of time.
Jinan Zou March 20, 2023
Acknowledgements
This thesis represents my work in more than three years of dedication at the University of Adelaide, specifically within the Australian Institute for Machine Learning (AIML). First of all, I would like to show my deepest gratitude to my principal supervisor, Prof. Javen Qinfeng Shi, who guided me through the whole project with great patience and wisdom on academic research and how to be an honest and strong person. He is the light that illuminates my way forward. I am so grateful to have him as my supervisor.
I want to thank Dr Lingqiao Liu for his constructive advice and guidance on research, which made me more committed and passionate about doing research. His knowledge and attitude towards research influenced me a lot in my research.
I would also thank Dr Ehsan Abbasnejad, Prof. Qingsen Yan, and Dr Yuankai Qi for their instructive advice with all kinds of difficulties. I am also grateful to all my supportive friends and colleagues at the University of Adelaide.
Finally, I would like to take this opportunity to thank my parents, my grandparents, and my partner. I am grateful for the comfortable and happy life they created to allow me to focus on my research.
Publications
This thesis contains the following works that have been published or prepared to be submit- ted):
• Jinan Zou, Haiyao Cao, Lingqiao Liu, Yuhao Lin, Ehsan Abbasnejad, Javen Qinfeng Shi. Astock: A New Dataset and Automated Stock Trading based on Stock-specific News Analyzing Model. In Fourth Workshop on Financial Technology and Natural Language Processing, 2022.
• Jinan Zou, Maihao Guo, Yu Tian, Yuhao Lin, Haiyao Cao, Lingqiao Liu, Ehsan Abbas- nejad, Javen Qinfeng Shi. Semantic Role Labeling Guided Out-of-distribution Detection.
ACL, Under Review, 2023.
• Jinan Zou, Yanxi Liu, Lingqiao Liu, Yuankai Cui, Javen Qinfeng Shi. Rethinking Doc- ument Event Extraction: A Generative Model is All You Need?. ACL, Under Review, 2023.
In addition, I have the following papers not included in this thesis:
• Jinan Zou, Qingying Zhao, Yang Jiao, Haiyao Cao, Yanxi Liu, Ehsan Abbasnejad, Lingqiao Liu, Javen Qinfeng Shi. Stock Market Prediction via Deep Learning Techniques: A Sur- vey.ACM Computing Surveys, Under Review, 2022.
• Jinan Zou, Haiyao Cao, Yanxi Liu, Lingqiao Liu, Ehsan Abbasnejad, Javen Qinfeng Shi.
UOA at the FinNLP-2022 ERAI Task: Leveraging the Class Label Description for Finan- cial Opinion Mining. InFourth Workshop on Financial Technology and Natural Language Processing, 2022.
• Yuhao Lin, Haiming Xu, Lingqiao Liu,Jinan Zou, Javen Qinfeng Shi. Revisiting Image Reconstruction for Semi-supervised Semantic Segmentation.CVPR, Under Review, 2023.
Abstract
In this thesis, we first study the two ill-posed natural language processing tasks related to stock prediction,i.e. stock movement prediction and financial document-level event extrac- tion. While implementing stock prediction and event extraction, we encountered difficulties that could be resolved by utilizing out-of-distribution detection. Consequently, we presented a new approach for out-of-distribution detection, which is the third focus of this thesis.
First, we systematically build a platform to study the NLP-aided stock auto-trading al- gorithms. Our platform is characterized by three features: (1) We provide financial news for each specific stock. (2) We provide various stock factors for each stock. (3) We evalu- ate performance from more financial-relevant metrics. Such a design allows us to develop and evaluate NLP-aided stock auto-trading algorithms in a more realistic setting. We also propose a system to automatically learn a good feature representation from various input information. The key to our algorithm is a method called semantic role labelling Pooling (SRLP), which leverages Semantic Role Labeling (SRL) to create a compact representation of each news paragraph. Based on SRLP, we further incorporate other stock factors to make the stock movement prediction. In addition, we propose a self-supervised learning strategy based on SRLP to enhance the out-of-distribution generalization performance of our sys- tem. Through our experimental study, we show that the proposed method achieves better performance and outperforms all strong baselines’ annualized rate of return as well as the maximum drawdown in back-testing.
Second, we propose a generative solution for document-level event extraction that takes
into account recent developments in generative event extraction, which have been successful at the sentence level but have not yet been explored for document-level extraction. Our pro- posed solution includes an encoding scheme to capture entity-to-document level information and a decoding scheme that takes into account all relevant contexts. Extensive experimental results demonstrate that our generative-based solution can perform as well as state-of-the- art methods that use specialized structures for document event extraction. This allows our method to serve as an easy-to-use and strong baseline for future research in this area.
Finally, we propose a new unsupervised OOD detection model that separates, extracts, and learns the semantic role labelling guided fine-grained local feature representation from different sentence arguments and the full sentence using a margin-based contrastive loss.
Then we demonstrate the benefit of applying a self-supervised approach to enhance such global-local feature learning by predicting the SRL extracted role. We conduct our experi- ments and achieve state-of-the-art performance on out-of-distribution benchmarks.
Chapter 1 Introduction
Stock prediction has gained popularity in machine learning with the advancement in technol- ogy and social media. Stock prediction based on Natural Language Processing techniques is a promising solution since text information, e.g., tweets or financial announcements, strongly correlate with stock prices. Stock prediction is a complex and challenging task that involves using various data sources and techniques to make predictions about the future movements of a stock’s price. The fluctuation of stock prices is influenced by a complex array of factors, including company earnings reports, national policies, influential shareholders, and expert speculations on current events. Therefore, there is a need to utilize specific natural language language techniques for stock market prediction tasks, such as stock movement prediction and financial document-level event extraction. The task of stock movement prediction in- volves utilizing historical data and financial information to forecast the future movements of a stock’s price. On the other hand, financial document-level event extraction is the pro- cess of identifying important financial information from documents such as news articles or company announcements.
For stock movement prediction, existing approaches [12, 56, 93, 124, 150, 152, 162]
are based on market sentiment analysis and use news to predict the related securities’ price movement on the following trading day(s). Despite the limited success in those studies, the
current works are still far from realistic for three reasons: Firstly, previous methods ignore the financial factors, which play a key role in practical trading. Secondly, these models are evaluated only on intermediate performance metrics, e.g., stock movement prediction accuracy. It is unclear how well they can support a practical trading system to make sufficient profit. Thirdly, the model often performs well on in-distribution data but fails in out-of- distribution data, which requires high generalization ability.
In recent years, with the rising trend of digitization in the finance domain, Event Extrac- tion has become an increasingly important accelerator to business development. Continuous economic growth has witnessed exploding volumes of digital financial documents, such as financial announcements from listed companies. Such large amounts of announcements call event extraction to assist investors in extracting valuable structured information to sense emerging risks and find profitable opportunities timely in the stock market. Document-level event extraction is a challenging task in NLP because it requires a thorough comprehension of the document and an aggregated ability to assemble arguments across multiple sentences.
In addition, the real world is open and full of unknowns, especially in the stock market, presenting significant challenges for a news analyzing model that must reliably handle di- verse inputs. We observed that out-of-distribution(OOD) uncertainty arises when a model sees input that differs from its training data distribution. The prediction may lead to a failed investment decision, which the model should not predict. Moreover, the most benchmark dataset of document-level event extraction was created automatically by the distant super- vision approach, which might have a relatively higher annotation error rate. This scenario requires the model to reject inputs that are semantically different from the training distribu- tion, therefore, should not be predicted by the model.
1.1 Motivation
Stemming from the success achieved by the aforementioned modern methods, the overall objective of this thesis is to develop transformer-based methods to solve the stock movement prediction, out-of-distribution detection, and document-level extraction tasks. Though there are many successful applications of deep learning in stock market prediction-related tasks, it brings more difficulties and challenges as well, including:
1. Factor investing is an investment approach that targets quantifiable firm characteristics or factors that explain the differences in stock returns. Stock characteristics that may be included in a factor-based system contain low volatility, value, momentum, asset growth, and profitability. Factor-based strategies may help investors meet particular investment objectives—such as potentially improving returns or reducing risk over the long term. However, precious stock movement prediction datasets and methods ignore the stock factors which play a crucial role in practical trading. The first research question is:Would it be helpful to use stock factors for stock forecasting?
2. In addition to general stock factors, another important indicator is the financial an- nouncements related to the company’s performance. The performance of a company will be reflected in the stock price. If we can understand the performance of the com- pany well, it can help to predict the stock. The current method is that the investors look at the earnings report to judge the rise or fall of the stock based on subjective judgment. The third question is: Can we automatically extract the key information of the stock in the financial announcements?
3. The stock market is constantly changing and full of unknowns, presenting significant challenges for stock movement prediction models that must reliably handle diverse inputs such as news which is a common input indicator in stock movement prediction.
Out-of-distribution(OOD) uncertainty arises when a model sees input news that differs
from its training data distribution. The prediction for an out-distribution sample may lead to a failed investment decision, which requires accurate ood detection to solve this problem. However, previous ood detection works in NLP identify the ood instance by leveraging a single global feature embedding to represent the sentence, which cannot characterize subtle ood patterns well. The second question is: Can we find a better method to characterize subtle ood patterns?
1.2 Main Contributions and Thesis Outline
1.2.1 Main Contributions
This thesis aims to meet the needs of building realistic stock prediction tasks using NLP and machine learning. In an effort to address some of the challenges, we are devoted to developing algorithms for stock movement prediction, document-level event extraction, and out-of-distribution detection in the following perspectives:
• For the stock movement prediction task, our Astock platform is characterized by three features: (1) We provide financial news for each specific stock. (2) We provide various stock factors for each stock. (3) We evaluate performance from more financial-relevant metrics. Such a design allows us to develop and evaluate NLP-aided stock auto-trading algorithms in a more realistic setting. In addition to designing an evaluation platform and dataset collection, we also made a technical contribution by proposing a self- supervised system to automatically learn a good feature representation from various input information.
• For document-level event extraction task, we explore the current methods for extract- ing events at the document level, which often involve custom-designed networks and processes. We question whether such extensive efforts are truly necessary for this task. Our research is motivated by recent developments in generative event extraction,
which have shown success in sentence-level extraction but have yet to be explored for document-level extraction. To fill this gap, we propose a generative solution for finan- cial document-level event extraction, which is more challenging due to the presence of scattered arguments and multiple events. We introduce an encoding scheme to capture entity-to-document level information and a decoding scheme that makes the genera- tive process aware of all relevant contexts. Our results indicate that using our method, a generative-based solution can perform as well as state-of-the-art methods that use a specialized structure for document event extraction, providing an easy-to-use, strong baseline for future research.
• For the out-of-distribution detection task, we present a novel unsupervised approach for detecting out-of-distribution samples, called Semantic Role Labeling Guided Out- of-distribution Detection (SRLOOD), which leverages semantic role labeling (SRL) to extract and learn fine-grained local feature representations from various sentence arguments, as well as global feature representations of the entire sentence. Our ap- proach employs a margin-based contrastive loss to separate and extract these features.
A novel self-supervised approach is also introduced to enhance such global-local fea- ture learning by predicting the SRL extracted role. The resulting model achieves SOTA performance on four OOD benchmarks, indicating the effectiveness of our approach.
1.2.2 Thesis outline
The structure of this thesis is organized as follows.
In Chapter2, we first review previous state-of-the-art methods for stock movement pre- diction, OOD detection and event extraction. Also, we provide a detailed literature review on the basics of machine learning methods.
In Chapter 3, we study the problem of NLP-based stock prediction and make two major contributions to this field: (1) We develop a new dataset called AStock, featured by its large number of stocks, stock-relevant news, and availability of various financial factors. (2) We propose a new stock movement prediction system based on two novel techniques.
In Chapter4, we propose a generative solution for document-level event extraction that takes into account recent developments in generative event extraction. Our proposed solution includes an encoding scheme to capture entity-to-document level information and a decod- ing scheme that takes into account all relevant contexts.
In Chapter5, we propose a simple yet effective approach to learn from both global and local fine-grained feature representationto detect OOD instances in NLP.
In Chapter6, the conclusion and the potential future works are discussed.
1.3 Problem Formulation
In this thesis, we focus on NLP techniques to solve the tasks of (1) stock movement predic- tion (2) document-level event extraction for the financial announcement (3) out-of-distribution detection on the text data. The purpose is to build a system to predict the stock movement accurately, detect the ood instances that can cause severe semantic shift problems, and auto- matically extract the financial event records from a whole document.
1.3.1 Stock Movement Prediction
The problem of stock movement prediction can be formulated as a supervised learning prob- lem, where the goal is to predict the stock movement direction of a stock based on its histor- ical data. This can be done using various machine-learning techniques, such as regression or
classification algorithms. The input information could be the historical data of the stock, such as its past prices, trading volumes, and other relevant financial indicators such as company announcements or stock factors. We formalize movement based on the difference between the adjusted closing prices of the stocks ∈Son trading daysdandd−1. We can formulate stock movement prediction as a classification problem. Give stocks∈S, and historical data for stocks over a lookback window ofT days over the day range [t−T, t−1], we define the price movement of stocksfrom dayt−1totas :
Yt=
0, pdc < pd−1c 1, pdc >=pd−1c
(1.1)
wherepdc represents the widely used adjusted closing price1of a given stock on dayt. In this formula1.1, 1 represents a rising trend in the price, and 0 represents a price downfall trend.
In addition, some works might include an extra neutral class representing the little change in price.
1.3.2 Document-level Event Extraction
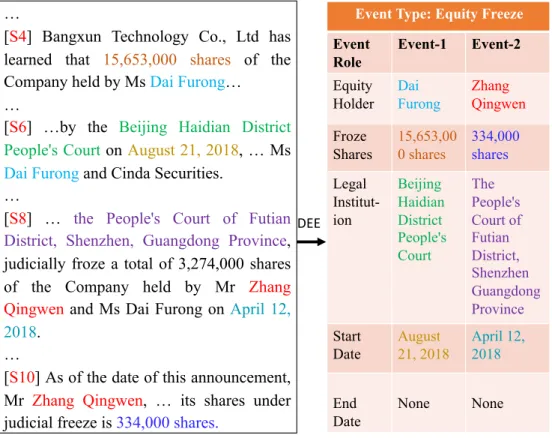
Event extraction aims to identify the specific type of events and extract the corresponding event arguments from given texts, and event extraction tasks can be divided into sentence- level event extraction and document-level event extraction. Despite successful efforts to extract events within a sentence, many real-world applications such as finance, legislation, or health require DEE, where the event information scatters across multiple sentences in a whole article. Figure1.1 illustrates an example that one Equity Overweight(EO) Equity Underweight (EU) event records are extracted from a financial announcement document.
Extracting information about the EU event is easier because all the related arguments are in the same sentence. However, the arguments for the EO record appear in different sentences,
1https://www.investopedia.com/terms/a/adjusted closing price.asp
making it more difficult to identify the event. It is important to consider the relationships between sentences and entities when trying to identify events in a document. In addition, a document may contain multiple related events at the same time, and being able to understand the connections between these events is crucial for successful extraction. It is a major chal- lenge to model the interdependence between correlated events in this task, as demonstrated in the example where the two events are related because they involve the same transaction and have the same start date.
Figure 1.1: An example of a document from a Chinese dataset proposed by Zheng et al.
[236] that was created to study the document-level event extraction for stock companies’
announcements. The document has been translated into English for this illustration. Entity mentions are highlighted. The original document can be found in AppendixA. Due to space constraints, only four sentences and three additional roles for each event type are shown.
In document-level Event Extraction, we will be dealing with three main concepts: entity mentions, event arguments, and event records. An entity mention is a part of the text that refers to a specific entity. An event argument is an entity that plays a specific role in an
event. Event roles are predetermined for each event type. An event record is an entry for a particular event type that includes the arguments for the different roles in the event. For sim- plicity, we will just refer to event records as ”records” in the following sections. Following Zheng et al. [236], given a document composed of sentences D = {Si}Di=1 and a sentence containing a sequence of words si = {wi}|Sj=1i|, the task aims to solve three sub-tasks: (1) entity extraction: extracting entities ε = {ei}|ε|i=1 from a document to serve as argument candidates. An entity may be mentioned multiple times in a document. (2)event types de- tection: The goal is to identify specific types of events that are expressed in the document.
(3)event records extraction: finding appropriate arguments for the expressed records from entities. It is worth noting that this task does not require identifying event triggers, which reduces the manual effort required for annotation and makes the potential applications of this task more widespread.
1.3.3 Out-of-distribution Detection
Out-of-distribution detection is a process that identifies data samples that come from a dif- ferent distribution than the one the machine learning model was trained on. The distribu- tion being referred to here is typically the ”label distribution”, which means that the out-of- distribution samples should not have the same labels as the training data. In other words, ood detection should not negatively impact the model’s ability to classify data from the original distribution (called the ”in-distribution” or ID), i.e.,P(Y) ̸= P′(Y). It’s important to note that the training set typically contains multiple classes, and ood detection should not interfere with the model’s ability to classify these classes correctly.
We formally define the OOD detection task as follows: Given a primary task of natural language classification (such as sentence classification or natural language inference), we aim to develop an auxiliary function, f(x) : χ → R, that assigns an OOD score to an instancex to be classified. The function should return a low score for ID instances where y∈γtraintrain and a high score for OOD instances where y∈/ γtrainy is the underlying label
for x and is unknown at inference. During inference, a threshold for the OOD score can be set to filter out most OOD instances.
Chapter 2
Literature Review
In this chapter, I will go through the related works in a detailed literature. As the topics of the thesis are stock prediction on machine learning and NLP. I will first review the conventional methods and deep learning-based methods of the applications including stock movement prediction, out-of-distribution detection and event extraction. Then, I will introduce the basics of most common machine learning methods.
2.1 Conventional Methods Applications
2.1.1 Stock Movement Prediction
Conventional methods in stock movement prediction can be roughly categorised into four groups: (1) Support Vector Machines(SVM), (2) Ensemble Models, (3) Genetic Algorithms and (4) Decision Trees.
• SVM-based. Xie et al. [208] developed a method for predicting changes in stock prices using financial news. They use semantic frames to understand the context of specific sentences and identify the impact of certain companies on the stock price. To do this, they have introduced a new way of organizing information called a tree representation
by using support vector machines and tree kernels. Wen et al. [204] proposed a new intelligent trading system that combines stock box theory and support vector machine algorithms to predict oscillation boxes. According to box theory, successful stock buy- ing and selling often occurs when the price breaks out of its original oscillation box into a new one. The system uses two SVM estimators to forecast the upper and lower bounds of the price oscillation box, and then creates a trading strategy based on these forecasts to make trading decisions. Ren et al. [171] integrated sentiment analysis into a machine learning method based on support vector machine and also considered the day-of-week effect in constructing more reliable sentiment indexes. The empirical re- sults showed that the accuracy of forecasting the movement direction of the SSE 50 Index can reach as high as 89.93% with an 18.6% increase after introducing sentiment variables. This model can help investors make more informed decisions and suggests that sentiment may contain valuable information about the fundamental values of as- sets and can act as a leading indicator of the stock market.
• Ensemble-based. Huang et al. [87] proposed an approach for detecting trading patterns using a biclustering algorithm. They used these patterns to predict market movements using a Naive Bayesian algorithm. They also applied the Adaboost algorithm to im- prove the accuracy of forecasting. Yang et al. [216] developed a new ensemble predic- tion model called SRAVoting for predicting stock price movement trends. To create this model, they first identified the most relevant training features using the maximal information coefficient (MIC) and then combined three well-performing classifiers:
support vector machine (SVM), random forest (RF), and AdaBoost (AB). They also proposed stock buy and sell strategies for different investing periods (day-span, week, and month). Finally, they tested our model and strategies using Chinese stock price indexes and technical indicators.
• Genetic Algorithms. Hu et al. [81] used genetic algorithms to predict the price move-
ments of 10 stocks listed on the Taiwan Stock Exchange. They compared the perfor- mance of their predictions to those made using linear and logistic regression models.
They found that the genetic algorithm-based system increased the accuracy of the base models when tested using temporal validation windows. Leitao et al. [108] proposed a method for discovering patterns in financial time series data using a combination of Perceptually Important Points (PIPs), Symbolic Aggregate approximation (SAX) rep- resentation, and a Genetic Algorithm (GA). The PIPs and SAX are used to represent the time series data, and the GA is used to generate investment rules and find optimal solutions.
• Decision Trees. Previous works [17, 205, 238] used decision tree (DL) to forecast stock market, which use a subset of randomly selected input variables.
2.1.2 Event Extraction
Event Extraction is a crucial yet challenging task in information extraction research. Event extraction aims to identify the specific type of events and extract the corresponding event arguments from given texts, and event extraction tasks can be divided into sentence-level event extraction and document-level event extraction. This section reviews those conven- tional methods for Event Extraction, like support vector machine (SVM), maximum entropy (ME).
• Sentence-level Event Extraction task, Event Extraction task mainly follows the re- quirements of ACE event extraction task that requires to identify the event type, ar- gument, and judge the argument role. Ahn [3] proposed a typical pipeline processing model including a nearest neighbor learning algorithm to detect the triggers and a maximum entropy learner to identify the arguments. Chieu and Ng [29] proposed a maximum entropy classifier to information extraction from semi-structured and free text.
• Document-level Event Extraction task, Event Extraction aims to identify event types and relevant event argument roles. Compared with sentence-level event extraction, the main difference is that it is no longer requires to identify the triggers words. Li et al.
[112] proposed a joint model including trigger identification and event type classifica- tion by integer logic programming(ILP) to solve the special characteristics of Chinese event extraction. Specifically, they proposed two trigger detection models: one is based on the conditional random field (CRF) and another one is based on maximum entropy(ME). Li, Ji and Huang [113] proposed to incorporate global features which ex- plicitly capture the dependencies of multiple triggers and arguments to predict triggers and arguments simultaneously for the sentence level event extraction. Venugopal etal.
[194] proposed a model to reliably learn and process high-dimensional features though SVMs and encoding their output as low-dimensional features in Markov Logic Net- works (MLNs). Some previous works [7, 94,114, 213] used an information network to represent relations, entities, and events as an information network representation based on structured prediction.
2.1.3 Out-of-distribution Detection
The research on the problem of identifying out-of-distribution data in low-dimensional spaces has been well-studied in various contexts [165]. There are several common techniques that are frequently used for detecting out-of-distribution examples in low-dimensional spaces, in- cluding density estimation, nearest neighbor analysis, and clustering [32, 42,62, 195]. The density estimation approach estimates the probability density of the in-distribution data and considers a test example to be out-of-distribution if it falls in an area of low density. The clustering method uses statistical distance to identify groups of similar examples, and an example is considered out-of-distribution if it is far from its nearest neighbors.
2.1.4 Limitations of Conventional Methods
Although conventional methods have been successful progress in stock movement predic- tion, OOD detection, and event extraction, the limitations are obvious and inevitable.
• Conventional methods are designed to work in low-dimensional spaces and may not be effective when applied to high-dimensional data such as images.
• Conventional methods may not be robust to adversarial attacks, where an attacker intentionally crafts inputs that are designed to fool the model.
• Many conventional methods rely on assumptions about the data distribution that may not hold in practice, which can limit their effectiveness.
• Difficulty handling noise and ambiguities: Conventional methods may struggle to ef- fectively handle noise and ambiguities in the data, which can be common in real-world scenarios.
• Limited ability to capture complex patterns: Conventional methods may not be able to effectively capture complex linguistic patterns and relationships in text.
• Limited ability to adapt to new domains: Conventional methods may not be able to effectively adapt to new domains or handle shifts in the data distribution.
• Conventional methods often require the creation of hand-crafted features, hich can be time-consuming to develop and may not generalize well to new domains.
2.2 Deep Learning Based Methods Applications
2.2.1 Stock Movement Prediction
As the deep learning models have become advanced, the models in predicting the stock market have gradually changed from the conventional methods to deep learning methods,
like Recurrent Neural Network (RNN), Long Short-Term Memory (LSTM), Gated Recur- rent Unit (GRU), Graph Neural Network (GNN). Furthermore, the latest works applied Transformer-based models.
Recurrent Neural Network Based ModelsRNN [174] have been used in stock movement prediction tasks as a way to analyze sequential data and make predictions based on past trends. RNNs are well-suited for this type of task because they have a ”memory” that allows them to incorporate information from previous time steps or input elements. This can be particularly useful in stock prediction tasks because past trends and patterns may have an impact on future stock movements. There are a number of ways that RNNs can be trained and used for stock movement prediction, such as by using historical stock data as input and training the RNN to predict future stock price movements. RNNs have shown promise in stock movement prediction tasks and may be a useful tool for investors and traders. An RNN can be regarded as a recurrent combination of several identical network cells, and the output of each cell is provided as input to the next cell [107]. Each cell contains a set of input, hidden, and output units. Regarding this problem, several variants of RNN have been developed, including LSTM [76], GRU [30], Bidirectional LSTM (Bi-LSTM) [64]. These models have improved the RNN and made gOOD progress in stock market prediction.
Long Short-Term Memory (LSTM).LSTM models have the advantage of long short-term memory in processing text and time series prices, which perform well in stock market pre- diction. LSTM solves the problem of storing information at longer time intervals based on the gradient method compared with RNN models. Akita et al. [4] proposed a Paragraph Vector method to represent the textual information and used LSTM for the prediction model.
In this experiment, ten companies are indicated as ten articles, where the vector of articles is represented asPt. These companies’ prices are represented as{c1, c2. . . , c10}at a single timesteptconcatenate as stock prices vectorNt. The input of LSTM is the combination ofPt
andNt. LSTM significantly outperforms the baselines, Multi-Layer Perceptron (MLP), Sup- port Vector Regression (SVR), and Simple-RNN, for the opening prices prediction. Ma et al.
[144] proposed the News2vec model, in which dense vectors represent news features. They used LSTM with the self-attention mechanism as the predictive model. This text embed- ding model News2vec contributes to mining the potential relationship between news and its event elements. Nelson, Pereira and Oliveira [156] used the LSTM method to realize stock movement prediction. However, the model inputs are numerical information, including stock prices and volume.
In stock prediction work, processing stock prices as a time series analysis is typical, but few people consider the potential time dependency of the data. Zhao et al. [235] proposed a time-weighted LSTM model with trend retracement, which assigned weights to data based on the temporal nearness towards the data to be predicted. The hybrid models, a combination of LSTM with other models, are proposed to get better prediction performance. Polamuri et al. [166] proposed the Generative Adversarial Network-based Hybrid Prediction Algorithm (GAN-HPA) to implement the Stock-GAN developed from a GAN-based framework. The framework takes different inputs, such as stock datasets and hyperparameters. The algorithm uses linear and non-linear models to extract features from the dataset. The hyperparame- ters and the pre-processing results are used as inputs to the LSTM, with the output of the generator and raw data being provided to the discriminator. Finally, they applied Bayesian approximation to adjust the parameters and update the prediction results. The main contri- bution of Wang et al. [203] was dynamically extracting potential representations of financial market trends from transaction data. They proposed a hybrid Convolutional LSTM-based Variational Sequence-to-Sequence model with Attention (CLVSA). The model consists of convolutional LSTM units and the sequence-to-sequence framework with self-attention and inter-attention mechanisms.
Nguyen and Yoon [161] proposed a deep transfer with related stock information (DTRSI) framework involving stock relationships in predicting stock price movement. The LSTM
cells are used when pre-training on large-scale data to obtain optimized parameters, and then the base model is fine-tuned using a small amount of target data to obtain the final model. They solved the overfitting problem due to insufficient sample size and considered the relationship between stocks.
The perturbations added in the adversarial training can reasonably simulate the stock price with the stochasticity characteristics, which can improve the effectiveness of the stock movement prediction. In 2019, Feng et al. [60] proposed the attentive LSTM and adversarial training to predict the movement of the stock market. To predict multiple stock market prices simultaneously, Ding and Qin [44] proposed an associated network model consisting of three branches predicting the opening price, the lowest price, and the highest price, respectively.
Chen et al. [19] employed the Bi-LSTM to encode the stock data and financial news representations in their models, the Structured Stock Prediction Model (SSPM) and multi- task Structured Stock Prediction Model (MSSPM). They also involved the trading events representations consisting of the event roles embeddings, which are the subject and object extracted viaStandf ord CoreN LP2 [169]. The MSSPM is innovatively jointly trained on the tasks of stock prediction and event extraction, since the authors believed these two tasks had intrinsic relations, and a precise extraction result benefits the stock prediction result. To make time-aware predictions, Sawhney et al. [179] proposed a hierarchical learning method named FAST for ranking stocks based on expected profit. This model used a time-aware LSTM to model the temporal irregularities in news and tweets. The FAST shows the posi- tive effects of factoring the in-text fine-grained temporal irregularities in the simulations on the S&P 500 and China A-shares indexes. Li and Pan [123] believed that the movement of stock prices is influenced by many factors, and they proposed an ensemble deep learning model consisting of LSTM and GRU. For the textual information, they predetermined win- dow size by referring to psychology and economic theories according to the persistence or transience of the news impact.
Gated Recurrent Unit (GRU).GRU is developed from LSTM, and it works well in stock market prediction. This model not only helps alleviate the problem of vanishing gradients but also improves training speed by reducing the number of cells [30]. Inspired by Qin et al. [168], who proposed a dual-stage attention-based RNN for time series prediction, Yang et al. [218] proposed a dual-level attention mechanism, which is based on a gated recurrent units network (GRU) model. The principle of the attention mechanism uses input attention to allocate different weights to different financial news titles according to their contribution to the stock price. They paid attention to explaining the reasons for stock price prediction and avoided errors generated by natural language processing tools that can affect the final result. Similarly, Li, Shen, and Zhu [110] also considered the weights of inputs to avoid the input of useless factors affecting the final result, and they proposed a novel multi- input LSTM (MI-LSTM) model to differentiate between mainstream and auxiliary factors through the attention mechanism and assign different weights to these inputs. To solve the challenge of chaotic news, Hu et al. [82] designed a Hybrid Attention Network (HAN) with a self-paced learning mechanism by considering the credibility and comprehensiveness of financial news. This hybrid attention network consists of two attention layers, news-level attention and temporal attention level bi-directional GRU layer are adopted to encode the temporal sequence of corpus vectors. After back-testing, the annualized rate of return in the simulated transactions has been considerably improved. Some of the work takes the experts’
opinions into account. Wang et al. [199] proposed a framework for stock prediction based on high-quality investment opinions from experts. The multi-view fusion network stance detection model called MFN determines texts’ upside and downside investment opinions by integrating text features from multiple views and relevant knowledge from the financial domain. A stance aggregation module identifies and aggregates high-quality opinions based on a dynamic expert mining procedure. Finally, a stock prediction module is used to predict the future trend of individual stocks using the input expert opinion indicators from the first two sections. The prediction component first employs a GRU to encode a time-ordered
sequence of features. Then a time-aware attention mechanism is used to incorporate hidden states in the stocks dynamically. The real-world dataset validates the model’s validity in making investment recommendations and individual stock predictions.
Wang et al. [200] aimed to address the challenges of stock trend forecasting due to non-smooth dynamics and complex market dependencies. They proposed a new Hierarchi- cal Adaptive Temporal-Relational Network (HATR) to describe and predict the evolution of stocks in 2021. The HATR progressively captures short- and long-term transition charac- teristics from multi-scale local combinations of stock trading series by superimposing ex- panding causal convolutions and gating paths. This model is similar to their previous work, where they presented a dual attention mechanism with a Hawkes process and target-specific queries, which helps to detect significant time points and scales conditional on individual stock characteristics. In order to uncover latent interdependencies among stocks, they also created a multi-graph interaction module that combines previous domain knowledge with data-driven adaptive learning.
Convolutional Neural Network(CNN)Deep CNNs are broadly examined for effectiveness on both Computer Vision (CV) and NLP tasks [92]. Ding et al. [47] further improved the event embedding method [46] and introduced a CNN for training over the input history event embedding where the pooling layer performs well on extracting the representative event history features. One Universal CNN-based predictor (U-CNN pred) [78] is trained through a layer-wise approach where the subCNNs layers are pre-trained sequentially until the proposed model structure is completed. This model obtained reasonable results and was proved effective due to the shallow model structure having less weight to be learned, thus less likely to reach overfitting.
For exploiting the information underlying industrial relations, some models integrate knowledge graphs with CNN to improve model performance. Deng et al. [39] proposed a Knowledge-Driven Temporal Convolutional Network (KDTCN) for making interpretable
stock predictions where the Open IE [58] is used to extract events linked to the knowledge graph. Classic one-dimension convolutional layer has the problem of data leakage where the data on timetmay be convoluted from timet−1andt+ 1. TCN overcomes this problem by using causal convolution where the data on timetis convoluted with elements on timetand earlier from the previous layer. The KDTCN model performs well in explaining the abrupt price changes due to the convolutional layer extracting significant features in the price time series.
The combination of CNN and LSTM could further improve time series prediction. Lu et al. [140] proposed a CNN-LSTM model to predict daily stock closing prices where the CNN model extracts features from 10-day historical data time series, and the LSTM model makes the price prediction. In the following research, Lu et al. [141] developed and proposed a CNN-BiLSTM-AM model. This model leverages the attention mechanism to capture the historical influential stock fluctuation on price time series and improve the CNN-based model performance. Wang et al. [202] proposed a CNN-BiLSTM model to make the stock closing price prediction where they added a tanh function to the output gate of the Bi-LSTM and im- proved the model performance. Mehtab and Sen [149] proposed a univariable convolutional LSTM model for predicting the opening price of Indian stocks. The authors developed the model performance by partitioning a 10-day time series into two 5-day data sequences to enable the convolutional layer to extract more historical data features. Besides, GRU is also introduced recently and proved efficient in processing. In the modelling of multiple stock factors tasks, Zhou, Zhou, and Wang [239] proposed an ensembled stock market prediction model consisting of CNN and Bidirectional GRU, which is feature-selection-based. CNN is responsible for feature extraction, while GRU is responsible for processing the time series data. They used the closing price of the stock market as the model output and all other data as inputs and obtained results with less error than other basic models.
Graph Neural Network (GNN).Matsunaga Suzumura and Takahashi [148] used the knowl-
edge graph to integrate the information of companies and GNN models as the individual stock prediction model. Knowledge graphs can well represent the relationship between enti- ties that represent companies in the direction of stock market predictions. One of the paper’s novelties is the backtesting approach, which is achieved by using rolling window analysis.
Similarly, Ding et al. [49] developed their previous event-driven works [46, 47] and pro- posed a Knowledge Graph Neural Tensor Network (NTN) model. This model encodes the entity vectors representing the relationship between entities of extracted events and feeds into the event-embedding learning process. This method alleviates the problem of event em- bedding suffering the limitation of revealing the syntactic or semantic relationships between two events.
Xu et al. [209] focused on the problem of stock price limit, and they proposed the Hier- archical Graph Neural Network (HGNN) considering the different properties of the market state. They constructed a stock market relationship graph and extracted stock information from multiple market state views such as node view, relation view, and graph view in a hierar- chical manner. They achieved high performance in classifying the type of price-limit-hitting stock. Finally, the investment return ratio has been improved by using the proposed model.
Some works consider multiple information sources to predict the stock market. Li et al.
[122] proposed a GNN-based model for the fusion of multi-source heterogeneous subgraphs for predicting the stock market. The datasets include three kinds of subgraphs representing the relations of the stock market index, the stock market news, and the graphical indica- tors. The fusion of three subgraphs is finally converted into a fully connected classification layer to make predictions. Ang and Lim [6] used a graph encoding module to propagate multimodal information across companies’ relationships. Moreover, an attention module is also proposed for global and local information capturing among inter-company relations and different modalities. The model performs robustly on three forecasting tasks and two appli- cations on real-world datasets.
Graph Convolutional Network (GCN).GCNs are the generalization of CNN to the graph data. GCNs often combine with other deep learning models. Chen and Wei [26] proposed a pipeline prediction model to integrate the relationship among corporations. Furthermore, they proposed a joint prediction model based on the GCN model to form the whole network by integrating more unconnected companies. In the graph, each corporation is abstracted as a node, and each edge connecting two nodes represents the relationship between corpo- rations. The weights of edges stand for the shareholding ratio between two corporations.
With the LSTM-based encoder layer, which can encode the historical features of corpora- tions, GCN produces the most impressive performance. Similarly, Li et al. [119] proposed an LSTM Relational Graph Convolutional Network (LSTM-RGCN) model to handle the positive and negative correlation among stocks. The correlation matrix among companies is calculated based on historical market data and shows the connection between companies.
The LSTM mechanism added to RGCN layers relieves the over-smoothing problem in pre- dicting overnight stock price movement. A novel Gated temporal convolution is introduced to learn the temporal evolution of stock features.
Most existing models focus on designing sequence models to capture the time depen- dence between stock prices and information such as news. However, they do not make full use of information from other highly correlated stocks. Yin et al. [222] introduced a graph convolutional network model that combines GCN and GRU to fill this gap. GCN extracts features from each stock price with a high degree of similarity. These extracted feature sequences were fed into the GRU model to capture the time dependence. To con- sider the relationship between stocks, Feng et al. [61] proposed the Relational Stock Rank- ing (RSR) framework, which helps predict stock movement in a stock-ranking way. The framework consists of three layers: a sequential embedding layer realized by using LSTM, a relational embedding layer, and a prediction layer. Furthermore, they proposed a tempo- ral graph convolution model to solve the ranking problem. Sawhney et al. [177] proposed the Spatio-Temporal Hypergraph Convolution Network (STHGCN), which is the first hyper-
graph learning approach. The hypergraph structure simulates the relationship among stocks, and spatial hypergraph convolutions are used.
It is a challenging task to accurately predict the price movements of individual stocks due to the influence of contingent events such as company operating conditions and public opinions. Stock market indices reflect the overall stock price trend of a specific industry or company in the stock market. They are less influenced by variables such as the operating conditions of a single company and have better predictability. Wang et al. [197] used the GCN to fuse the correlation of indicators in stock trend prediction. They proposed the MG- Conv model based on a multi-Graph Convolutional neural network-based that constructs static graphs between indices based on constituent stock data. Moreover, they designed dy- namic graphs based on trend correlations between indices with different portfolio strategies and defined multi-graph convolution operations based on both graphs.
Graph Attention Networks (GAT).GAT combines the graph neural network and the atten- tion layers. Complex background noise can adversely affect GNN performance in a large- scale graph. With attention, the GNN model focuses on the graph’s most critical nodes to improve the signal-to-noise ratio. Furthermore, the Attention mechanism exploits the inter- connectedness of graph nodes, distinguishes the hierarchical connections, and enhances the practical information needed for the task. Kim et al. [95] proposed a hierarchical attention network (HATs) using relational data to predict individual stock prices and market index movements. LSTM and GRU are used as the feature extraction modules for the two tasks, respectively. By aggregating different relation types of data and adding the information to each representation, HATS achieves better results than other existing methods. Sawhney et al. [176] proposed a multipronged attention network for stock forecasting (MAN-SF) by fus- ing the information of financial data, social media and inter-stock relationships. It captures multimodal signals through hierarchical attention to train a Graph Attention Network (GAT).
A common strategy for predicting the firm trend in terms of its relevant firms is to adopt
graph convolution networks (GCNs) with predefined firm relations. However, through a range of firm linkages, the bridging importance of which fluctuates over time, momentum spillovers are transmitted. Cheng and Li [28] proposed an attribute-driven graph attention network (AD-GAT) to capture the attribute-mattered momentum spillovers. This network ap- plies the unmasked attention mechanism for inferring the dynamic firm relation underneath the market signal, which is fusing a tensor-based feature extracting module. The proposed model outperforms GCN, eLSTM [116], and TGC [61] in terms of accuracy and AUC in experiments on the three-year data of the S&P 500.
Transformer Based Models. RNN is better suited for tasks dealing with temporal, sequen- tial data such as financial news, tweets, and stock price time series. However, RNN struggles to process long sequences since the model tends to forget the contents of the distant location or mix the contents of nearby positions. The Transformer avoids recursion by processing sen- tences using a self-attention mechanism and positional embedding. Hence, the Transformer model has achieved promising results in many stock market prediction tasks presented in the following content. Based on Transformer’s excellent capacity to capture long-term depen- dencies, its based models will be utilized to tackle the problems of temporal dependence.
Li et al. [126] suggested a novel Transformer encoder attention (TEA) framework based completely on attention mechanisms to handle time dependency difficulties in financial data and expose hidden information in stock prices related to social media texts. The TEA model employs a feature extractor and a cascade processor architecture. A Transformer encoder, attention mechanism, and normalization technique comprise the feature extractor. To learn the crucial information, the feature extractor effectively gathers aspects from past text and stock prices for five calendar days. Similarly, Zhang et al. [231] introduced the Transformer- based attention network (TEANet) architecture to handle the time-dependent problem uti- lizing five calendar-day data. The TEANet framework consists of a deep textual feature extractor that uses the Transformer and a concatenation processor to properly incorporate
and balance the influence of numerous elements, such as tweets and market prices. Yoo et al. [223] enhanced predicting accuracy by leveraging the connection between numerous equities. For this purpose, they introduced the Data-axis Transformer with Multi-Level Con- texts (DTML). It builds asymmetric and dynamic correlations in an end-to-end approach for learning the correlations between stocks and providing the final prediction for all individual stocks.
Many Transformer-based model papers use textual information as the input to capture the sentiment of people in stock-related news media. Financial news sentiment analysis aims to predict market reaction towards the hidden information in texts [221]. Li et al. [115]
believed that social sentiment played a leading role in reflecting the public’s views on stock trends. A collection of social sentiments and professional opinions was collected from social platforms and financial news articles. The obtained data would then be sent into a tensor Transformer, which would be used for model training to eliminate noise and capture a more intrinsic relationship. Furthermore, the trained model is utilized to investigate the effect and function of social emotions using data from diverse sources. According to Liu et al. [132], existing social media-based stock prediction algorithms covered only individual stock se- mantics and correlations, but vast social media presented contradicting information. They proposed a Capsule network based on Transformer Encoder (CapTE) to solve this problem which contains a Transformer Encoder to capture deep semantic features and structured re- lationships among tweets. Yang et al. [219] proposed a Hierarchical, Transformer-based, multi-task (HTML) model for predicting short-term and long-term asset volatility. They also used audio data to make predictions in addition to the common news and reports about finance.
Chen et al. [21] developed the Gated Three-Tower Transformer (GT3) for multivariate stock time series extracting and integration. In order to tackle the problem of limited recep- tive fields, they created a Shifted Window Tower Encoder (CWTE) for capturing channel- wise features from data embedding. To extract and aggregate multi-scale temporal informa-
tion, a Shifted Window Tower Encoder (SWTE) combined with multi-temporal aggregation was developed. To acquire sophisticated text features, a vanilla Transformer encoder was used as a Text Tower Encoder (TTE). Meanwhile, the Cross-Tower Attention method was created to assist the model in learning the stock market tendencies and related meanings con- veyed by the social media content. The features from CWTE, SWTE, and TTE are finally fused through an adaptive gate layer efficiently and accurately.
Pre-trained Language Model. BERT is a Transformer-based language model predomi- nantly used in pre-trained language models [41]. BERT was pre-trained in two innovative training methods, masked-language modelling (MLM) and next sentence prediction (NSP) [41]. MLM enables BERT to understand relationships between words, while NSP enables BERT to understand long-term dependencies between sentences. The pre-trained model can be fine-tuned to make it more suitable for specific tasks.
Financial news is considered one of the primary sources of stock market information and impacts stock returns [121]. Dong et al. [51] proposed a BERT-LSTM model, where the BERT extracted the stock price direction based on social media news, and the autoregressive LSTM integrated information features as covariates. It can also utilize trends of historical prices to predict the future direction of stock prices. Sonkiya et al. [184] employed the BERT model to perform sentiment analysis on news and headlines about Apple Incorporation. The sentiment scores obtained after sentiment analysis were used as input vectors. The GRU and CNN were used as the generator and discriminator in the GAN to generate data continuously.
They can discriminate between true and generated samples on the stock price to achieve the final desired prediction effect. The model’s early convergence is optimized by using sentiment scores as input. Colasanto et al. [33] improved stock forecasting by utilizing AlBERTo [167], a Transformer-based model, for Italian social media sentiment analysis.
This model calculates the sentiment values of various event news in the market that would affect stocks.
Instead of directly using the sentiment in texts for stock market prediction, some re- searchers agreed that the news comments would influence the investors’ sentiment, thus af- fecting their estimation of market trends and investment willingness. Li et al. [111] evaluated and classified investor comments on news websites using the BERT pre-training model. To validate the links between investor emotions and stock returns, a cross-sectional regression analysis approach is applied. They employed a two-step cross-sectional regression validation [59] to eliminate the heteroskedasticity problem in the samples and the consistency issue in data. Zhao et al. [234] argued that stock commentary by experts is an essential reference for accurate stock prediction. Therefore, BERT was chosen to translate the comments com- ing from field experts more comprehensively and accurately, resulting in more reliable stock movement predictions. They also argued that the input to BERT is fixed-length text, which leads to poor performance in long text information exploration. For this reason, they used the sliding window to segment the original text, expand the sample size, reduce over-fitting, and comprehensively capture all the information of the lengthy text. Furthermore, the output features of each layer of the BERT model are extracted, and the ablation strategy will be invoked to extract useful information from these features.
The application of Bert in the stock market is not limited to price prediction or movement prediction. Zhou et al. [243] presented a bi-level BERT-based model for detecting predefined trading events, which is further adapted using a wide variety of financial texts. The low- level model is a multi-label token classifier that identifies the events for each token in each phrase. The high-level model combines the low-level model output with the entire article to determine the likelihOOD of each event occurring. The ultimate trading strategy is based on the recognized time and ticker, utilizing string matching the detected events. Hsu et al. [80]
adopted a selective perturbed masking (SPM) approach for aspect-based sentiment analysis.
SPM analyzes the value of each word in a sentence and replaces the insignificant word using two replacement strategies without compromising aspect-level polarity to tackle readability and semantic consistency issues. The authors experimented with SPM for stock price and
risk change prediction as a real-world scenario for sentiment analysis to further evaluate it in sub-tasks such as aspect term sentiment classification (ATSC) and aspect term extraction (ATE).
2.2.2 Event Extraction
Sentence-level Event Extraction. Traditional sentence-level event extraction methods are challenging to acquire thorough knowledge of features, making it difficult to advance in the task of event extraction that requires an understanding of complex semantic relations.
Many recent event extraction efforts have utilized deep learning architectures such as CNNs [24, 232], RNNs[158, 181], GNNs [36, 67, 137], Transformers[133, 220, 236], and other networks[86,229].
Nguyen et al. [160] proposed a joint framework to capture the inter-dependencies be- tween arguments roles and triggers by using bidirectional recurrent neural networks. Some previous works [157] and [24] both adopted convolutional neural network to reserve more crucial information to help improve performance. Previous works [135, 137] proposed to exploit argument information explicitly by attention mechanisms. Yang and Mitchell [213]
decomposed the learning problem into three subtasks: within-event structures, event-event relations, and entity extraction, and then they integrate these learned models into a new model that performs joint inference for triggers, semantic roles, and entities.
Chen et al. [25] proposed t