As a result, the Department of Environment and Conservation (DEC) conducted a survey of ASD prevalence in the Perth metropolitan area. Scanning and transmission electron microscope examinations of the fine fractions were consistent with SXRD examinations. Pyrite is commonly present as particles of various sizes and shapes in the diluted portion of the soil profiles.
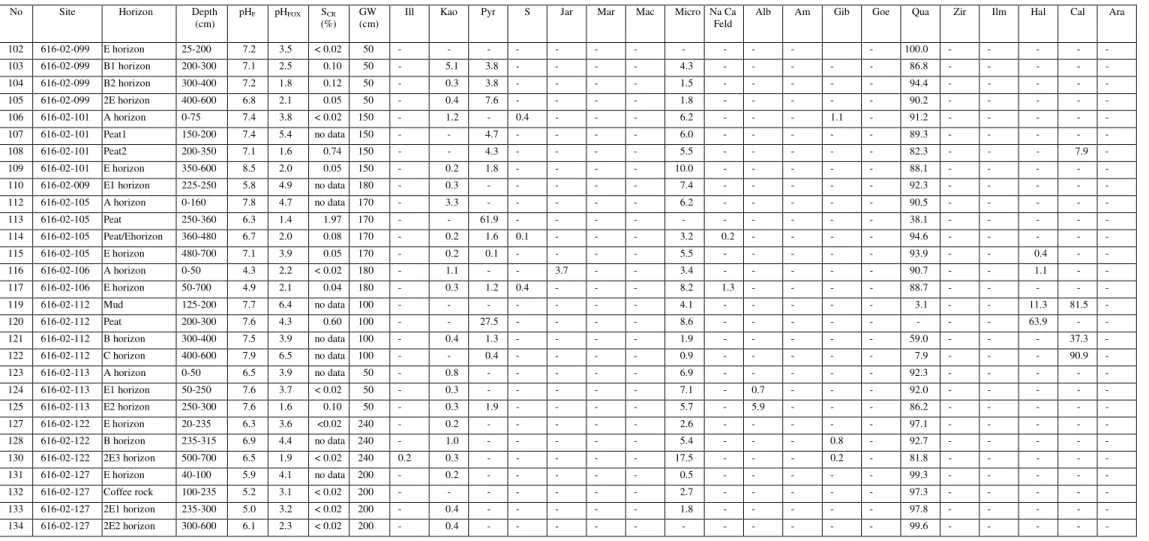
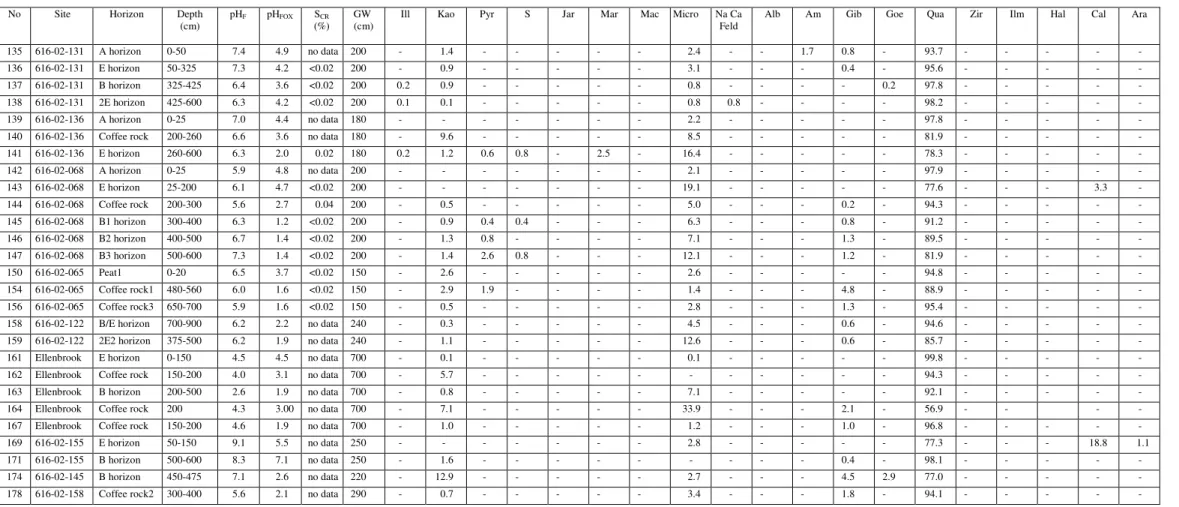
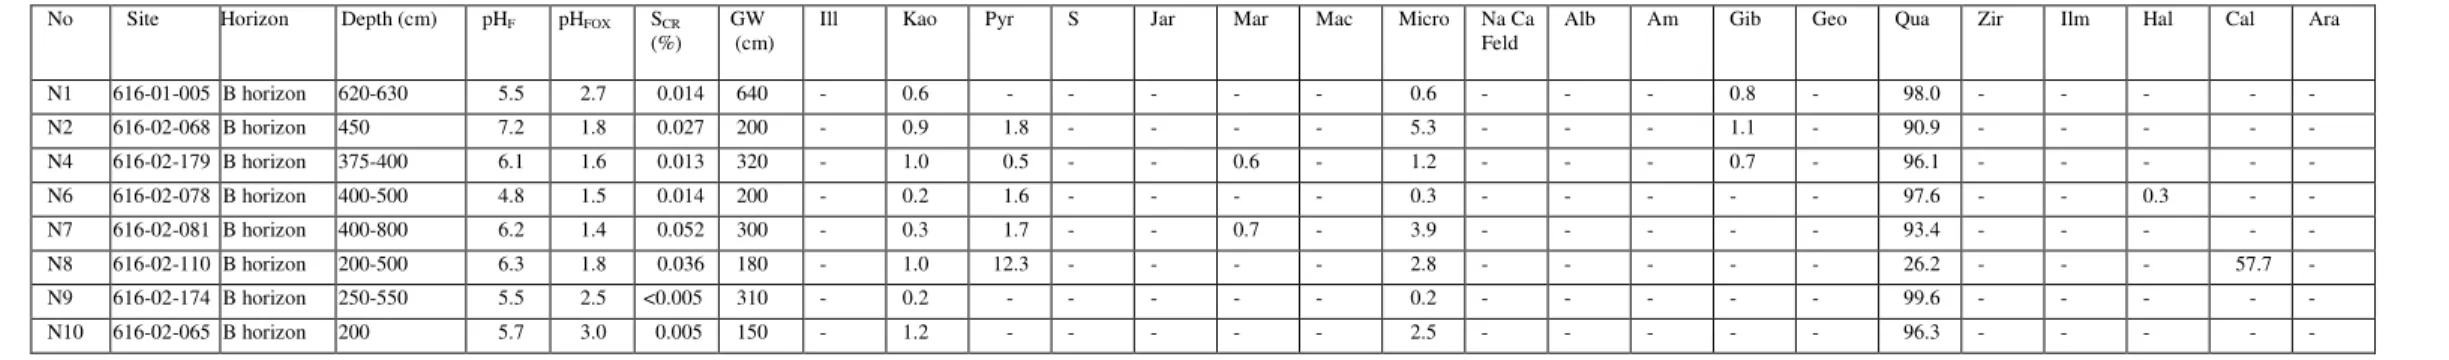
A subset of samples represented soil profiles with a low sulfur content (<0.03%S) while their pHFOX was in the range of 1.8 to 2.5. However, in the Perth metropolitan area, such sandy soils often have a sulfur content less than the current action criterion (0.03% SCR) which allows them to be disturbed without the requirement of a management plan. Low pHFOX is therefore attributed to a combination of highly reactive nature of microcrystalline pyrite and extremely poor buffering capacity of the Bassende sand.
Summary of SCR(%) analyzes of some pyrite-bearing materials and evaluation of these samples by direct mineralogical methods to determine whether the SCR(%) value is a reliable indicator of the presence of pyrite.
Objectives and Aims The main objectives are to
Characterize and quantify forms of sulfur in Bassendean Dune soils not detected by current standard laboratory methods and. Understand the forms of acidity in the topographic sequence of the Bassendean Dune system in the Perth region, including the Gnangara and Jandakot mounds. Determine the amounts and forms of acidity and pH buffering of Bassendean soils in non-land areas;.
Evaluate the adequacy of the current trigger value for acidity of 0.03% S for assessing stored acidity in the Bassendean Dune System using a combination of physical and chemical mineral analysis methods; And. Determine the latent acidity in marshy horizons of other soil types on the SCP and adjacent Darling Range.
Introduction
The Bassende Dunes have low relief with slight variations in topography, which translates to a variable depth of the water table. The management of acid sulphate soils is based on Queensland and New South Wales models; however, the acidity issue in the Bassendean Dunes is different from other areas with clay soils. Unfortunately, the nature and distribution of these minerals is poorly understood and is the focus of the current investigation.
The very low acid buffering capacity of the Bassendean Dune soils is unable to neutralize the acidity produced by oxidation, so the nature of the buffering capacity also requires investigation. The extent to which pyrite-bearing soil materials can occur in wet horizons beneath other landscape elements of the Bassendean Dunes, and particularly 'downstream'. of organic-rich wetlands is unknown. During the last years, it has become evident that the drying of humic podosols in i) acidification degrades metals, concrete and other infrastructure and the acidic impact of stripping and excavation can extend considerable distances from the site of operation. ii) acidic groundwater kills vegetation and irrigation with acidic water containing dissolved Al, As and possibly other toxic elements is undesirable. iii) The Bassendean Dune aquifers provide a significant proportion of Perth's drinking water and should not be contaminated by acid water from oxidized podosols. iv) the ecologically unique lakes within and adjacent to the Bassendean Dunes become acidic and inhospitable as they dry up and organic sediments and adjacent soils become aerated resulting in catastrophic damage to the ecology of the lakes. v) standard chemical methods for estimating pyrite amounts in soil are inadequate for detecting low concentrations of pyrite present in humus podosols.
It is important to critically assess the validity of the chemical methods and to develop more appropriate criteria for use by developers and regulators.
Materials and methods 1 Soil selection
- Soil reaction (pH), electrical conductivity (EC) and H 2 O 2 oxidation
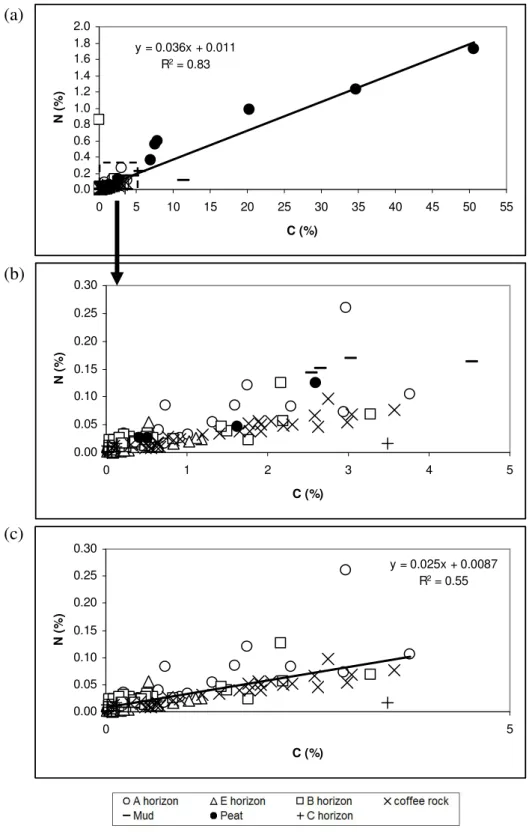
- Total C and N
- Cation exchange capacity (CEC)
- Extractable Fe, Al, Mn, Si
- Dithionite-Citrate-Bicarbonate (DCB) extractable Fe, Al, Mn, Si
- Oxalate extractable Fe, Al, Mn, Si
- Pyrophosphate extractable Fe, Al, Mn, Si
- Extractable sulfate (Turbidimetric method)
- Chromium-reducible sulfur method (S CR )
- Total element analysis (X-ray fluorescence)
- Mineralogical properties
- Synchrotron XRD
- Conventional XRD
- Differential X-ray powder diffraction (DXRD)
- Inductively coupled plasma optical emission spectrometry
- Transmission electron microscopy (TEM)
- Scanning electron microscopy (SEM) .1 Thin section preparation
- Fine fraction deposited on a stub
- Analysis of thin sections
- Incubation
- Batch titration
A sample of one gram of whole wet soil (<2mm) was weighed into a 25ml centrifuge tube, 10ml of 0.2M ammonium oxalate solution at pH 3.0 was added to the tube, the tube was shaken in the dark for 4 hours . A twenty gram sample of whole wet soil was weighed into a 50 ml centrifuge tube, 20 ml of DI water and a few drops of chloroform were added to the tube to suppress microbial activity. Powder samples from the fine fraction of the soil were placed in glass capillaries and analyzed over an angle range of 4 - 60° 2 Theta.
A highly diluted suspension of the fine fraction was prepared in distilled water and dispersed by ultrasonic treatment. A drop of the suspension was deposited on a carbon-coated Cu grid and examined using a JEOL 3000 electron microscope operated at 300 kV. A ten gram sample of whole wet soil was weighed into a 50 ml centrifuge tube, 20 ml of DI water and a few drops of chloroform were added to the tube to suppress microbial activity.
A drop of the suspension was deposited on a carbon strip attached to an aluminum stub and examined using a JEOL 6400 SEM.
Macromorphology and soil classification
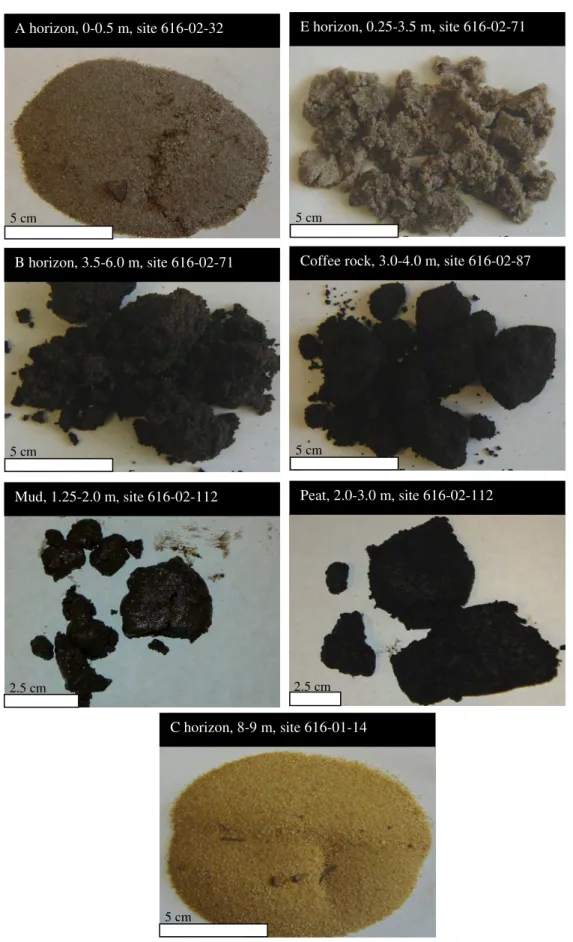
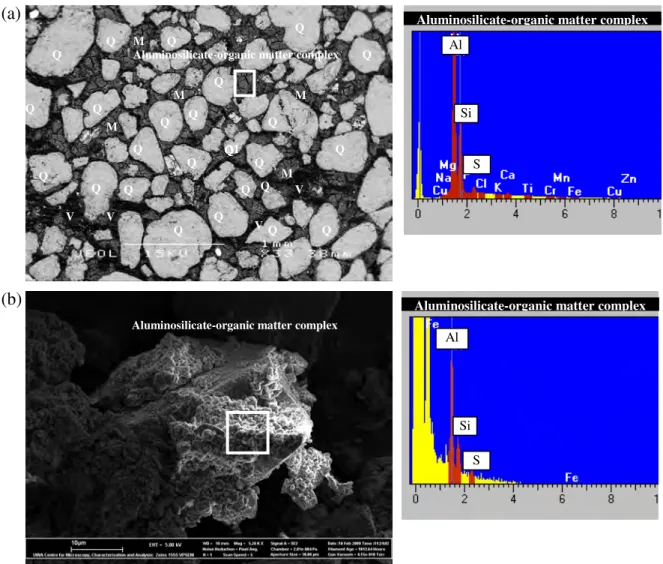
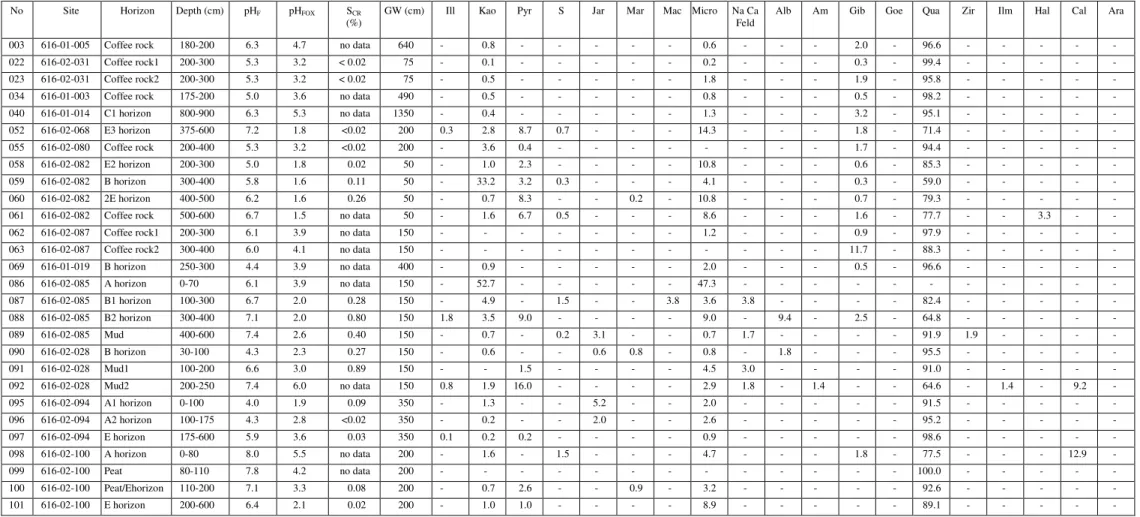
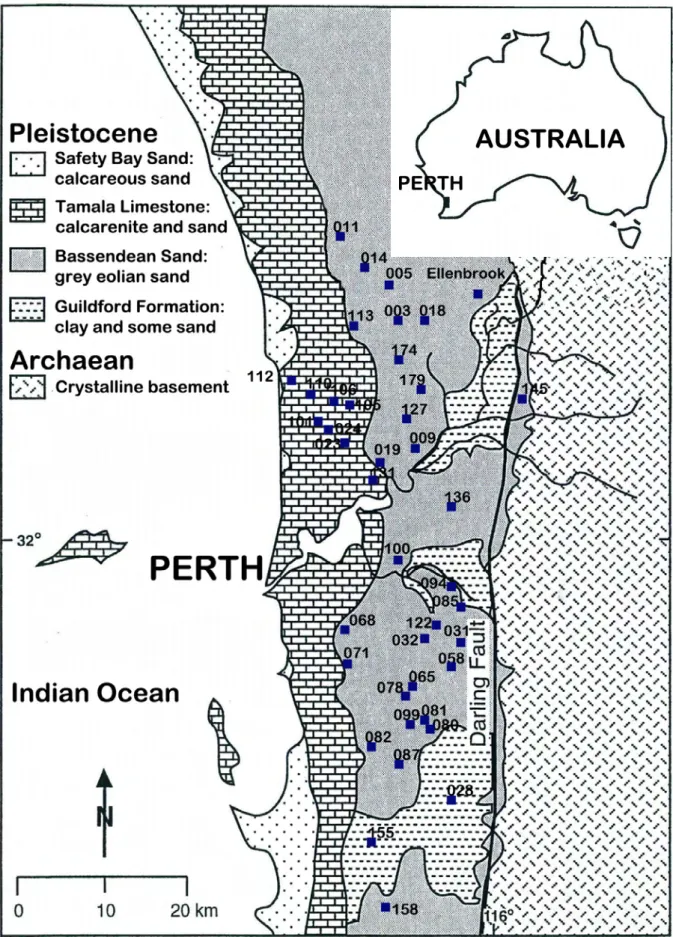
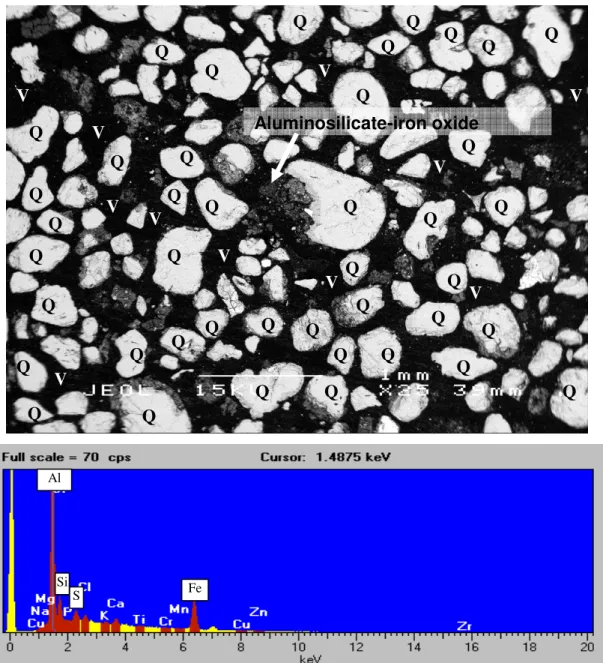
The B horizon and coffee rock have a loamy sand texture due to the high content of organic matter and allophane. The matrix material is a complex of amorphous alumino-silicate, iron oxides and organic matter that cements together rounded and well-sorted quartz grains. A summary of soil classification (soil types) for this study is shown in Figure 1 in the Appendix.
Hand samples of A-horizon, bleached E-horizon, brown B-horizon, strong dark cemented B-horizon (coffee stone), mud, peat and C-horizon are shown in Figure 3. B2, coffee rock: the coffee rock is sand that has a dark color (yellow-brown to black), high organic matter and is strongly cemented. There appears to be a reduced porosity within the coffee rock due to the precipitation of iron oxyhydroxide, organic matter and aluminosilicate-organic complexes.
Moreover, the soil morphology has a strong relationship with the position of the groundwater in the soil profile.
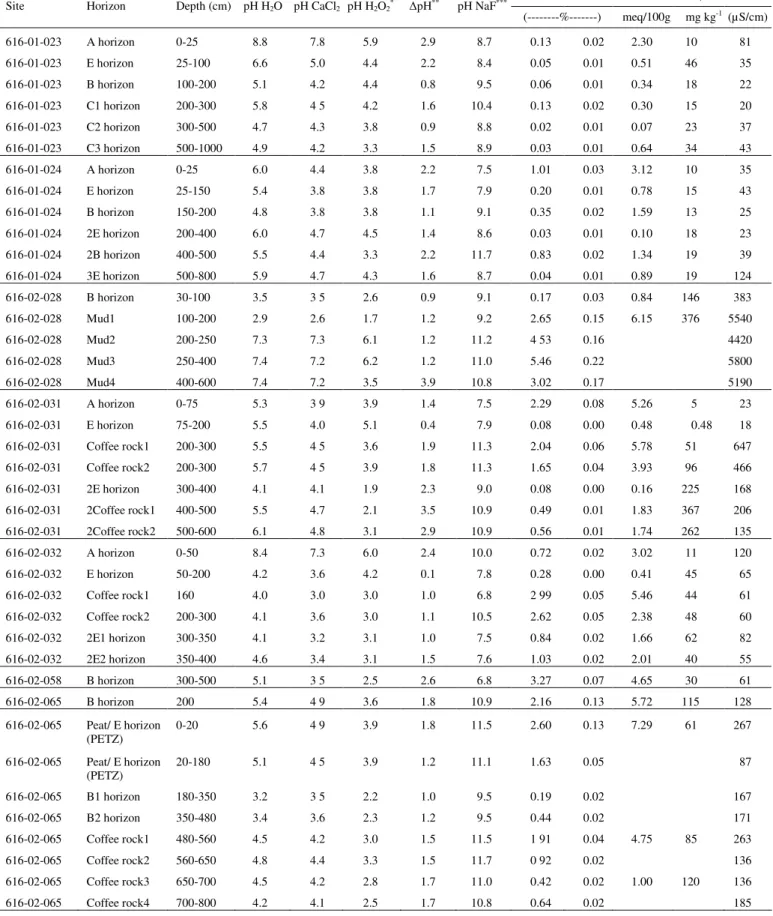
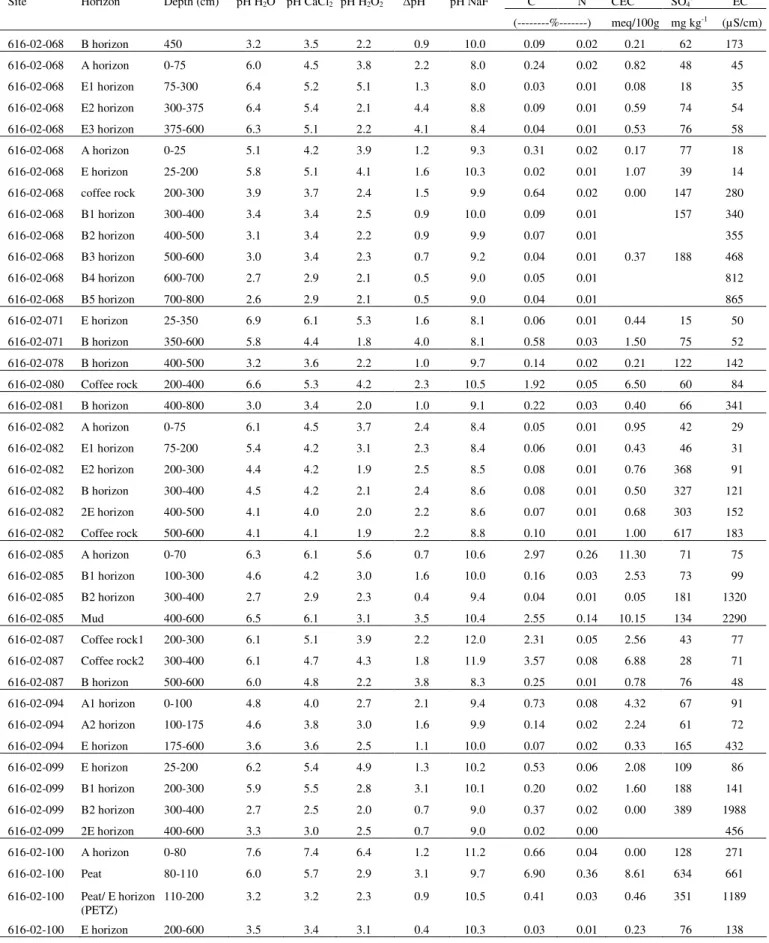
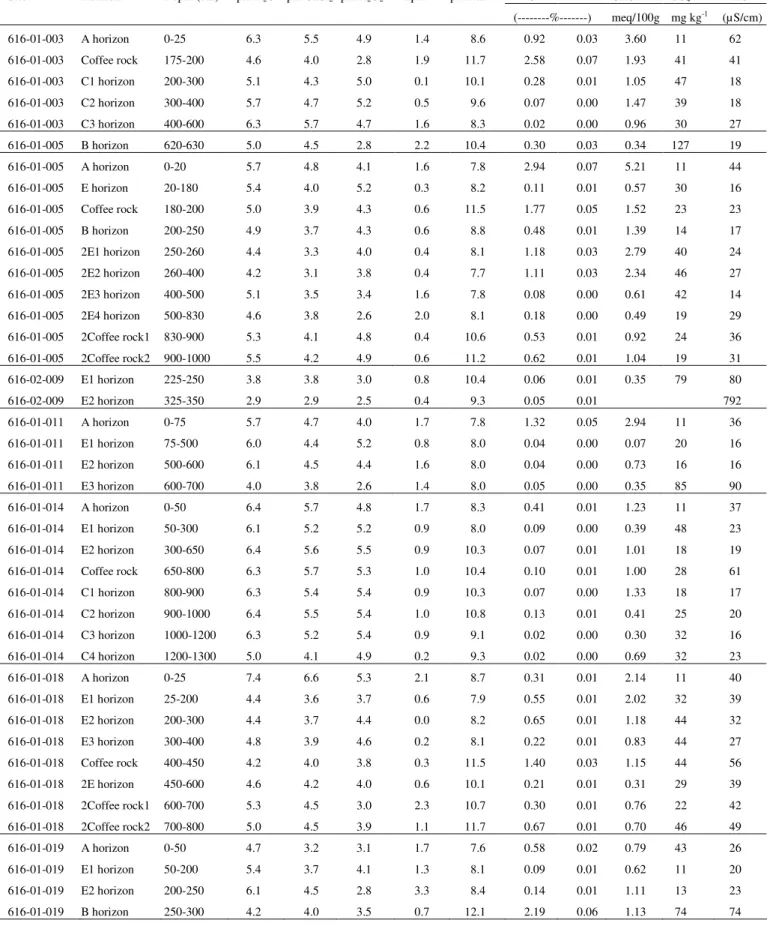
Results 1 Chemical properties
- Micromorphological and mineralogical properties
- X-ray diffraction
- Total chemical composition (ICP and XRF data)
- Extractable silicon, aluminium, iron, manganese
- Incubation
- Buffering capacity
It is clear that coffee rock and B-horizon materials have high amounts of surface OH- which will provide significant anion and cation exchange sites (buffering capacity). In some cases, coffee rock samples have a matrix consisting mainly of alumino-silicate mixed with organic material and ferruginous cemented material (Figure 2). Transmission electron microscope results for the fine fraction of these soils show the crystal morphology of pyrite crystals from E, B and coffee rock horizons and x-ray spectra confirm the atomic ratio of Fe: S ≈ 1: 2 indicative of pyrite (Figures 8-10).
Iron concentration in coffee rock is highly variable (Appendix, Table 2), which is consistent with SEM/EDS data indicating that iron is not always present in elevated concentrations in coffee rock and that some cemented materials are low in iron (Figures 2 and 6) . ). Iron is relatively abundant in some coffee stone samples; sulfur concentrations are highest in coffee rock and E horizon. The sulfur content of E, B, coffee rock and peat horizons is higher than for normal surface soils worldwide (Appendix Figure 38).
Aluminum (Ald, Alox and Alp) is high in coffee rock and B horizon due to the amorphous aluminum silicate cementing agent between sand grains. The ratio Alox/Siox of coffee rock and B-horizon can indicate the composition of the allophane present in these soils. The buffer capacity of coffee rock and B horizons has positive relationships with iron extracted by Na pyrophosphate and NH4 oxalate (Figure 40).
Overview and Recommendations
Appendix Figure 26 Histograms of the concentration of silicon (Si) in A, E, B, coffee stone, peat and C horizon materials (in mg kg-1 unit) (fusion acid digestion method; ICP-OES). Appendix Figure 27 Histograms for the concentration of aluminum (Al) in A, E, B, coffee stone, peat and C horizon materials (in mg kg-1 unit) (fusion acid decomposition method; ICP-OES). Appendix Figure 28 Histograms for the concentration of iron (Fe) in A, E, B, coffee stone, peat and C horizon materials (in mg kg-1 unit) (aqua regia method; ICP-OES).
Appendix Figure 29 Histograms for the concentration of manganese (Mn) in A, E, B, coffee rock, peat and C horizon material (in mg kg-1 unit) (aqua regia method; ICP-OES). Appendix Figure 40 Histograms for the concentration of copper (Cu) in A, E, B, coffee rock, peat and C horizon material (in mg kg-1 unit) (aqua regia method; ICP-OES). Appendix Figure 41 Histograms for the concentration of chromium (Cr) in A, E, B, coffee rock, peat and C horizon material (in mg kg-1 unit) (aqua regia method; ICP-OES).
Appendix Figure 42 Histograms for lead (Pb) concentration in materials A, E, B, coffee rock, peat and C horizon (in mg kg-1 unit) (aqua regia method; ICP-OES). Appendix Figure 44 Histograms for barium (Ba) concentration in materials A, E, B, coffee stones, peat and horizon C (in mg kg-1 unit) (aqua regia method; ICP-OES). Appendix Figure 46 Histograms for cerium (Ce) concentration in materials A, E, B, coffee rock, peat and C horizon (in mg kg-1 unit) (aqua regia method; ICP-OES).
Appendix Figure 49 Histograms for the concentration of gadolinium (Gd) in A, E, B, coffee stone, peat and C horizon materials (in mg kg-1 unit) (aqua regia method; ICP-OES). Appendix Figure 50 Histograms for the concentration of germanium (Ge) in A, E, B, coffee stone, peat and C horizon materials (in mg kg-1 unit) (aqua regia method; ICP-OES). Appendix Figure 51 Histograms for the concentration of hafnium (Hf) in A, E, B, coffee stone, peat and C horizon materials (in mg kg-1 unit) (aqua regia method; ICP-OES).
Appendix Figure 52 Histograms for the concentration of lanthanum (La) in A, E, B, coffee rock, peat and C horizon material (in mg kg-1 unit) (aqua regia method; ICP-OES). Appendix Figure 53 Histograms for the concentration of molybdenum (Mo) in A, E, B, coffee rock, peat and C horizon material (in mg kg-1 unit) (aqua regia method; ICP-OES). Appendix Figure 54 Histograms for the concentration of neodymium (Nd) in A, E, B, coffee rock, peat and C horizon material (in mg kg-1 unit) (aqua regia method; ICP-OES).
Appendix Figure 55 Histograms for the concentration of scandium (Sc) in materials A, E, B, coffee rocks, peat and horizon C materials (in mg kg-1 unit) (aqua regia method; ICP-OES). Appendix Figure 56 Histograms for strontium (Sr) concentration in materials A, E, B, coffee rocks, peat and horizon C (in mg kg-1 unit) (aqua regia method; ICP-OES). Appendix Figure 57 Histograms for thorium (Th) concentration in materials A, E, B, coffee rocks, peat and horizon C materials (in mg kg-1 unit) (aqua regia method; ICP-OES).
Mineralogy and chemistry of sandy acid sulfate soils in the Perth metropolitan area of