The large increasing proportions of more aggressive market groups in the corporate and government fleets is therefore alarming because of the injury and cost of injury burden it places on society. Due to the more aggressive makeup of corporate and government fleets, they do not pose a higher risk of any driver injury compared to the private fleet.
INTRODUCTION
SCOPE
The Australian Bureau of Statistics' Motor Vehicle Census (2008) reported that the average annual growth in the registered fleet in Western Australia in the period 2003–2008 was 4%, compared to an average of 3% for Australia. This is also true of how all vehicles are driven, including private vehicles: differences in traffic density and the road environment mean that there are differences in the distribution of crashes involving vehicles driven in Western Australia when compared to vehicles driven in other countries.
SAFETY TECHNOLOGIES AND PURCHASING POLICY SCENARIOS
A full description of the technologies is provided in the full technical report on this study. Describe the profile of vehicles in the WA fleet and how it has changed over time.
DATA SOURCES AND MANAGEMENT
REGISTRATION DATA
Identification of fleet vehicles and vehicles entering and departing from the
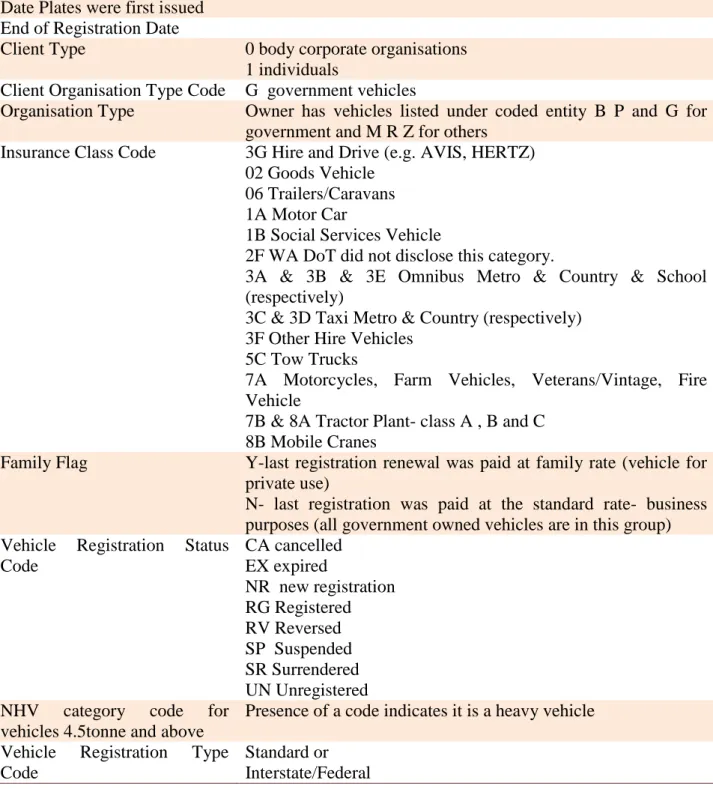
Vehicles registered to governments, businesses and private owners were identified through various variables in the WA Vehicle Registry. Commercial, non-government corporate fleets were identified with a value of 0 in the Client Type variable and no value in the Client Organization Type Code variable. Public fleet vehicles were assumed to be fleet vehicles registered by a government agency, identified by a 'G' in the Client Organization Type Code variable and a Client Type value of 0.
There were some limitations to this approach, as described in the full technical report on the project.
Identification of Vehicle Details
The vehicle's first entry into the registered fleet for newly manufactured vehicles was identified when the year of manufacture matched the year of plate issue. A vehicle was considered to have left the registered fleet when it no longer appeared in any of the following snapshots. The market group for these vehicles was determined based on the make, model, body type and year of manufacture of the vehicle.
Postcode of the registered owner was used to classify registered owners as residing in Metropolitan Perth or in other parts of WA.
Vehicle safety measures
Other similar methods were used for passenger vehicles whose production was completely outside the 1982-2009 production period and for non-passenger vehicles. These variables were used to collect information on body size, number of cylinders, SUV status and vehicle weight, which were used where possible to classify the vehicle into a market group. The age of the vehicle at the time of the recording was determined by the year of manufacture, subtracted from the year of the recording.
For vehicle models manufactured from 1982 onward without a specific rating, ratings by market group and year of manufacture are assigned for vehicles manufactured from 1964 to 1981 and for vehicles with unknown market groups and year of manufacture from 1982 to 2010, estimates by production year were assigned.
CRASH DATA
Vehicles appearing in the crash and registration data were assigned to each of these ratings by vehicle model, where possible. This is most likely due to missing data or the fact that the recording data is not from a photograph available for the study. For the vehicle-related injury outcome analysis, the pooled passenger vehicle crash dataset was reduced to a consistent set of towing crashes.
66% of merged unique passenger vessels were not involved in accidents where at least one vehicle required towing.
PROFILE OF WA REGISTERED VEHICLES
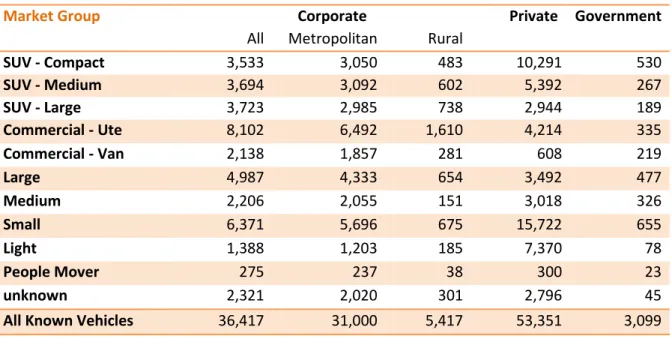
SIZE OF FLEET
'Hire and drive' and taxi registrations were found to be similarly increasing, but represented less than 1% of total registrations. It can be seen that Taxis represent a significant percentage of privately owned business registered Hire and Drive vehicles and within this group they are increasing in proportion over the period.
TRENDS IN MARKET GROUP DISTRIBUTION
The proportional prevalence of large SUVs has declined over time, particularly in the public fleet. There have been increases in the proportion of compact and mid-size SUVs in all fleets. Overall, SUVs have increased as a percentage of the private sector and decreased in the public fleet.
The percentage of people moving in the private, corporate and government fleets is small and has fallen over the period.
VEHICLE AGE
The proportion of vans and utilities in the private and commercial fleet has been stable over time, while there has been an overall decline in the proportion of vans and utilities in the government fleet over the same period. Considering regular passenger cars (light, small, medium and large), there is a general tendency for light and small vehicles to increase in proportion and for large and medium vehicles to decrease in all fleets.
VEHICLE CRASHWORTHINESS, AGGRESSIVITY AND TOTAL SAFETY
Trends by census period for each rating are shown in Figures 4, 5 and 6. Average accident performance by private, public and corporate fleet. Average aggressiveness of private, public and corporate fleets for vehicles with >1982 year of manufacture. Average total safety rating of private, public and corporate fleets for vehicles with >1982 year of manufacture.
Privately owned vehicles have the worst average CWR across all three market categories, reflecting their higher average age;
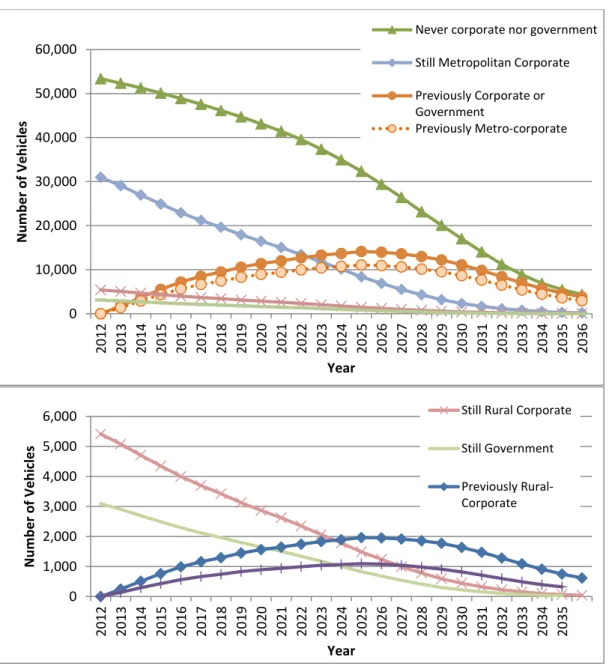
VEHICLE SCRAPPAGE AND TRANSFER
PROFILE OF NEW VEHICLES REGISTERED IN 2012
Estimated transfer rates from commercial and government vehicles to the private fleet, for 2007 and 2008 vehicle registrations.
WA CRASH DATA PROFILE
Metropolitan business vehicles were found to have a higher risk of traffic accidents but a lower risk of driver injury than private vehicles, possibly reflecting the greater exposure of company vehicles (higher crash risk) and newer, larger vehicles in the business fleet (smaller risk of injury to the driver) compared to them. to personal vehicles. Significant differences compared to the private fleet were observed for company vehicles with the following crash types: rear-end collision, single-vehicle rollover, rear-to-object and animal collision, heavy vehicle and frontal collision. This report examines scenarios in which emerging technology specific to reducing these types of accidents is adopted.
Alcohol was not considered a major contributing factor in corporate and government vehicle accidents, so technology that addresses alcohol use was not considered in the scenarios.
METHODOLOGY FOR ESTIMATING BENEFITS OF SAFER VEHICLE
For each year in the period, the number of injuries and serious injuries resulting from accidents involving 2012-registered vehicles was calculated. The number of injured occupants of the 2012 registered vehicle was estimated together with the number of other road users injured (such as occupants of other vehicles or unprotected road users) injured in collisions with the 2012 vehicle. The sum of these two values gave the number of injured and seriously injured road users involved in accidents involving 2012 registered vehicles.
The projected total number of road user injuries and the total number of property damage-only accidents over the 22-year period were determined using the unit cost of accidents and injuries to establish a baseline against which the accident costs of alternative fleet purchasing strategies can be compared against.
SCENARIOS CONSIDERED
All vehicles in the new 2012 lineup that are not currently equipped are equipped with forward collision warning systems with autonomous braking for all travel speeds. All vehicles in the new 2012 lineup not currently equipped are equipped with a lane departure warning system. All vehicles in the new 2012 lineup not currently equipped are equipped with a lane departure warning system.
All vehicles in the new 2012 lineup that are not currently equipped are equipped with side curtain airbags.
NEW 2012-REGISTERED - VEHICLE PROJECTION RESULTS
NUMBER OF REGISTERED VEHICLES
NUMBER OF CRASHED VEHICLES
NUMBER OF SERIOUS INJURIES
BASELINE COST ESTIMATES OF FLEET AND PROJECTED INJURY AND
CRASH COSTS OF THE BASELINE SCENARIO
Proportion of total costs ($645M) resulting from crashes occurring during the period 2012-2034 involving 2012-registered vehicles by fleet status and or the injured occupant.
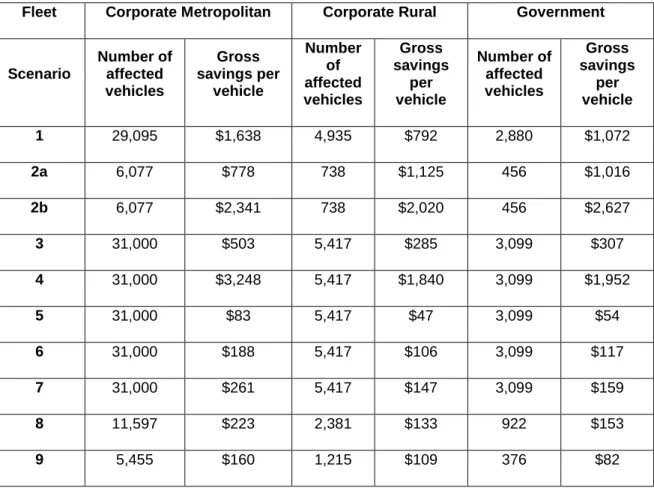
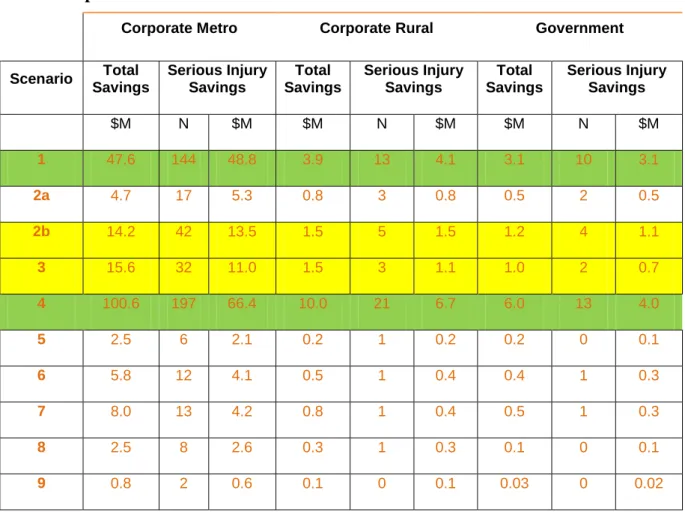
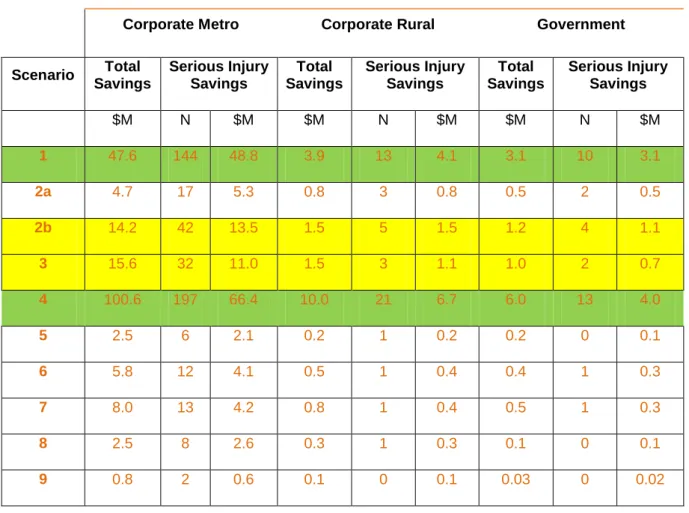
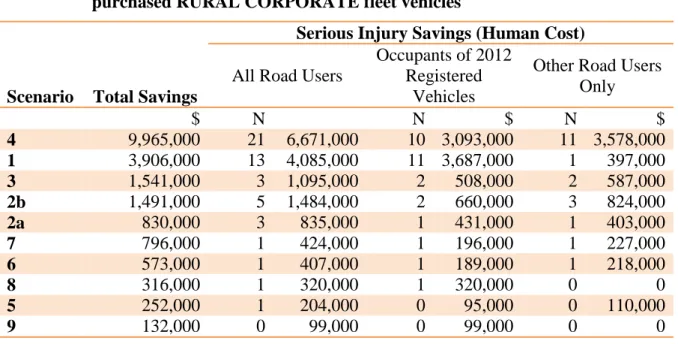
CRASH SAVING DIFFERENTIALS FROM BASELINE FOR SCENARIOS
Of the remaining scenarios for new technology adaptation, Scenario 7 ranked second best; number five for metropolitan and government fleets and sixth for rural fleets. For Scenarios 8 and 9, the smaller estimated savings were partly explained by the fact that the scenario did not involve changes in the entire fleet. The next section will discuss the savings in relation to the number of vehicles affected, so that the modest overall savings seen here for scenarios such as Scenario 9 were put into perspective.
It is true that this feature was effective in improving the safety of passengers in vehicles registered in 2012, but it did not affect the safety of other road users.
BREAK-EVEN COSTS
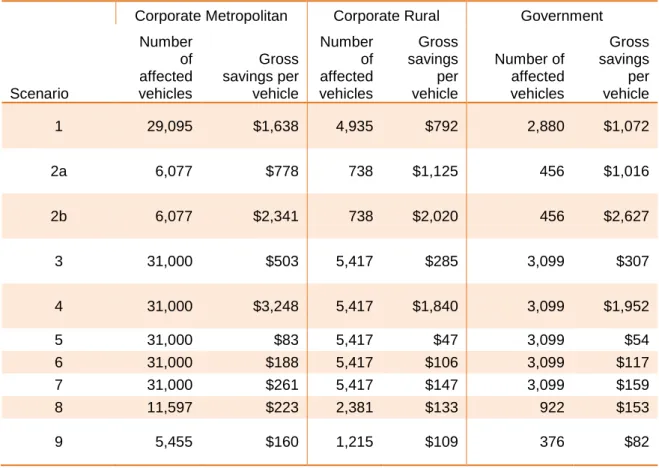
This means that it is likely possible to achieve these scenarios at relatively little additional cost through careful vehicle selection. This is similar to the objectives of Austroads' previous report, which assessed the national benefits of safer fleet purchases direct to the fleet owner. Since fleet owners own vehicles for a relatively short time, the proportions of the lifetime vehicle benefits summarized above that translate directly to the fleet owner are necessarily small.
It is difficult to estimate how much additional cost the fleet is likely to incur under each scenario, as the net cost is determined not only by the purchase price but also by the retained resale value.
SUMMARY AND IMPLICATIONS
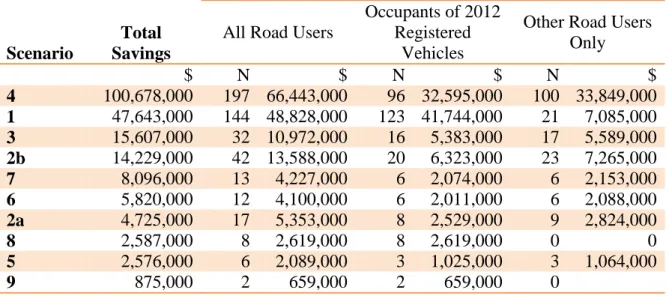
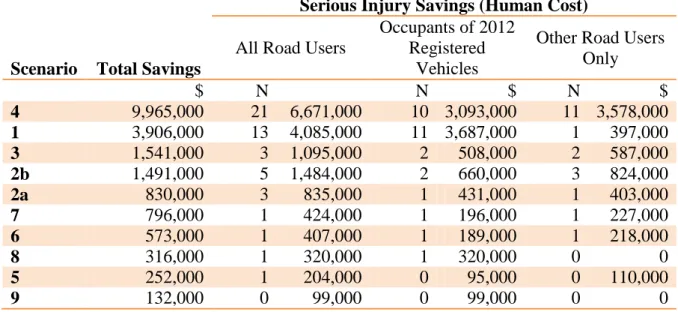
Of the total costs, $247M was for vehicles originally registered as metropolitan companies, $24M for vehicles originally registered as rural company vehicles, and $15M for vehicles originally registered as government. It provides both the present value of the total lifetime savings in societal social costs associated with the 2012 car fleet including savings in minor and non-injury accidents. The results in Table 9 identify the priorities for improving the safety of the WA vehicle fleet by quantifying the relative impacts of each scenario on serious and fatal injuries and costs to society.
Lower but still significant amounts could also be invested in improving the crashworthiness of the vehicles and reducing the aggressiveness of the corporate SUV fleet.
IMPLICATIONS OF THE RESEARCH
The overall recommendation from this study is that fleet buyers choose the most crashworthy model in their price range, and to choose large vehicles over large and mid-sized SUVs where possible. The most crash-resistant vehicle will also save directly to fleet buyers in the form of reduced passenger injury costs in a vehicle registered in 2012. If models were equipped with ESC, SCA or forward collision warning, fatigue management, lane change or warning lane departure systems are available at additional present value costs equal to or less than the fleet customer's break-even cost, then it is recommended that fleet customers purchase these technologies because additional savings to society would be possible at no additional cost to customers vehicle fleets.
Finally, when fleet buyers make less aggressive and safer vehicle purchase choices, they create a safer and less aggressive fleet which, when transferred to the private sector, gives private owners greater safer and less aggressive choices to continue reducing accident costs for society .
1994), Vehicle Crashworthiness Ratings: Victoria and New South Wales crashes during Technical Report No. 58, Monash University Accident Research Centre. 2012), Evaluating the effectiveness of side airbags in Victoria, Australia, Monash University Accident Research Centre, Monash Injury Research Institute. Single Vehicle Accidents with Serious Injuries, Monash University Accident Research Centre, Report Review of Best Practice Road Safety Initiatives in the Business and/or Business Environment, Monash University Accident Research Centre, Report 166.
2001) The Effectiveness of ADR 69: A Case Study of the Control of Crashed Vehicles Equipped with Airbags, Monash University Accident Research Centre, Contract Report Fleet Safety Assessment and Improvement in Australia, ATSB Report.