Technical Background Report
Nelson-Tasman FDS
June 2019
Contents
1. Purpose and structure of the report... 1
2. Background ... 2
2.1 What is a Future Development Strategy ... 2
2.2 What should the FDS include ... 2
2.3 Local context ... 3
2.4 Process ... 3
3. Environmental scan ... 4
3.1 Analysis of existing data ... 4
3.2 Stakeholder workshop ... 6
3.3 Iwi feedback ... 6
3.4 Public feedback ... 6
3.5 Population growth estimates ... 8
3.6 Development capacity assessments ... 8
4. Method and approach for identifying potential future development areas ... 11
4.1 Introduction ... 11
4.2 Establishing outcomes ... 12
4.3 Identification of potential future development option areas ... 12
4.4 Estimated yield ... 22
5. Method and approach for evaluating potential future development areas ... 29
5.1 Development of evaluation criteria ... 29
5.2 Preference analysis ... 30
5.3 Evaluating potential future development options ... 33
5.4 Analysis and development of scenarios for consultation ... 33
5.5 Public consultation... 43
5.6 Future development options identified through or amended in response to public consultation ... 43
5.7 Timing and sequencing... 48
5.8 Infrastructure requirements ... 50
5.9 Analysis of the preferred option ... 51
6. References ... 54
List of Tables
Table 1: Round one consultation overall feedback on growth options 7 Table 2: Estimated residential capacity required to meet growth for the most likely (medium),
high growth and low growth scenario. 9
Table 3: Estimated business demand and capacity over the period 2018 to 2048. 10 Table 4: Overview of the key stages of a Multi-Criteria Options Analysis. 12 Table 5: Types of intensification appropriate to the Nelson Urban Area context. 18
Table 6: Types of expansion found in the New Zealand context. 20
Table 7: Overview of development typologies and key assumptions. 22
Table 8: Intensification types. 24
Table 9: Building permit data for Nelson and Tasman. 27
Table 10: Intensification take up scenarios. 28
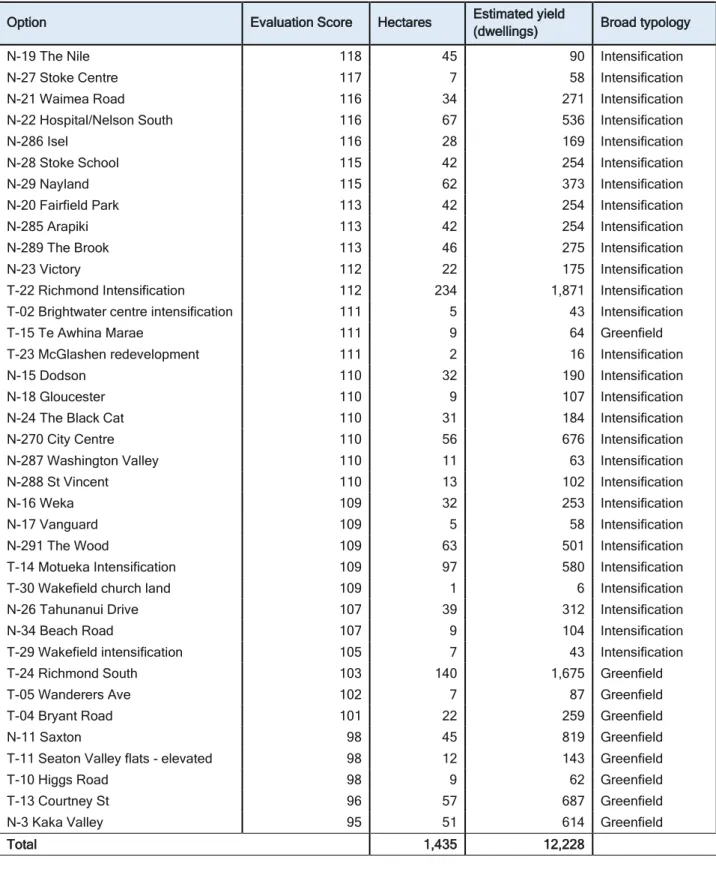
Table 11: Initial summary of feedback on preferences from iwi. 31 Table 12: Future development areas, based on unweighted evaluation scores, required to
provide sufficient capacity for 12,000 residential dwellings.
Table 13: Future development areas, based on evaluation scores weighted for feasibility. 36 Table 14: Future development areas, based on evaluation scores weighted for feasibility and
excluding areas prone to sea level rise, required to provide capacity for 12,000 residential dwellings.
37
Table15: Future development areas, based on evaluation scores weighted for feasibility and excluding areas of high productive land, required to provide capacity for 12,000 residential dwellings.
39
Table 16: Future development areas, based on evaluation scores weighted for feasibility and excluding areas prone to sea level rise and land of high productive value, while retaining strategic areas.
41
Table 17: Potential future development areas identified through public consultation. 44 Table 18: Future development areas amended in response to public consultation. 45 Table 19: Broad timing and sequencing of the preferred future development areas. 46 Table 20: Areas included that contain land of high productive value, along with reason for their
inclusion. 47
Table 21: Areas included that are prone to sea level rise. 48
Table 22: Timing and sequencing principles. 49
Table 23: Analysis of the range of housing likely to be provided based on development typology. 52 Table 24: Analysis of broad location of development capacity by Council. 52 Table 25: Analysis of provision of forward land supply, by Nelson Urban area, Council and FDS
decade. 53
List of Figures
Figure 1. Overview of the FDS process 3
Figure 2: Median house prices in Nelson and Tasman compared to other parts of New Zealand. 4 Figure 3: Tasman household growth compared to building consents issued for new dwellings. 5 Figure 4: Nelson household growth compared to building consents issued for new dwellings. 5 Figure 5: Four high level scenarios identified via the first stakeholder workshop. 14 Figure 6: Level of intensification and expansion across different growth options. 25 Figure 7: % of residential building permits – apartments, retirement units, town houses and flats. 33 Figure 8: Relative importance of factors identified as important to urban development in
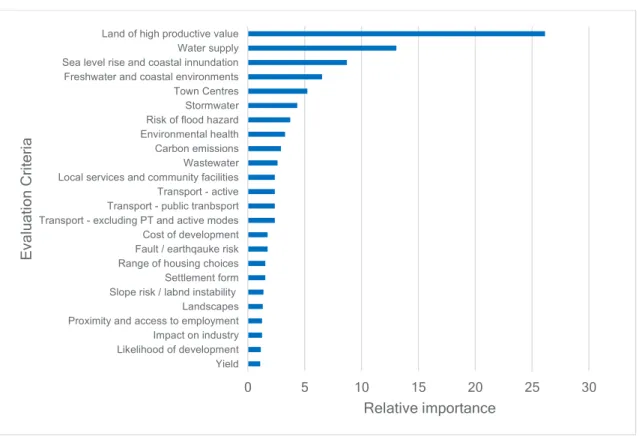
community consultation undertaken in January 2019. 31
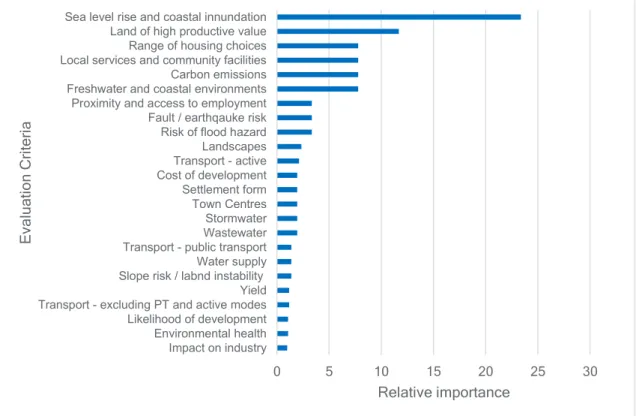
Figure 9: Relative importance of the draft evaluation criteria across all Councillors in attendance
at the workshop on March 5. 32
Figure 10: Relative importance of the draft evaluation criteria across all stakeholders in
attendance at the workshop on March 4. 32
List of Appendices
Appendix 1: Schedule of Consultation and Media Activities Appendix 2: Summary of Iwi Engagement
Appendix 3: First Round Consultation Summary
Appendix 4: Business/ Developer Consultation Summary Appendix 5: Population estimates/ FDS growth projections
Appendix 6: Alternative assessment techniques and selecting a decision tool Appendix 7: Development principles
Appendix 8: Long-list of potential future development options Appendix 9: Evaluation criteria
Appendix 10: Unweighted evaluation matrix
Appendix 11: Second Round Consultation Summary Appendix 12: Revised weighted evaluation rank score Appendix 13: Revised unweighted evaluation matrix Appendix 14: List of areas not selected
Appendix 15: Phasing and timing of significant infrastructure projects in the 2018 Infrastructure Strategies
Appendix 16: Summary of key Council three waters and transport infrastructure requirements to enable growth
This report has been prepared by Hill Young Cooper Limited and Resource Management Group Limited.
Nelson Tasman Future Development Strategy
Technical Background Report
1. Purpose and structure of the report
The purpose of this report is to provide an overview of the methods and analyses used to identify and evaluate potential future development options that informed the preparation of a Future Development Strategy (FDS) for Nelson and Tasman.
The report is structured as follows:
Section two sets out background on the National Policy Statement on Urban Development Capacity (NPS UDC) including:
what an FDS is and what it should cover; and
capacity to be provided.
Section three sets out an overview of the key inputs and assumptions used in the preparation of the FDS including:
population estimates; and
an overview of the Nelson Tasman assessments of capacity for housing and business development.
Section four sets out the multi-criteria analysis (MCA) method and approach used to assist in identifying potential future development options including:
what an MCA approach is; and
how potential future development areas were identified.
Section five sets out an overview of the method and approach used to assist in evaluating potential future development options including:
the development of evaluation criteria, including how these were informed by engagement with iwi, community, stakeholders and Councillors;
the process for evaluating potential future development areas against the criteria;
the development of three future development scenarios for public consultation; and
the development of a recommended strategy.
2. Background
The FDS was developed over the period December 2018 to July 2019. It is the first urban development strategy that covers both the Tasman and Nelson Regions.
2.1 What is a Future Development Strategy
A Future Development Strategy (FDS) is a high-level, long-term strategy developed under the National Policy Statement on Urban Development Capacity (NPS-UDC 2016). The NPS-UDC directs Councils to provide sufficient development capacity in their resource management plans, supported by infrastructure, to meet demand for housing and business space. Development capacity refers to the amount of development allowed by zoning and regulations in plans that is supported by infrastructure. This development can be ‘outwards’ (on greenfield sites) and/or
‘upwards’ (by intensifying existing urban environments).
The NPS-UDC encourages councils that have a medium-growth urban area within their district to prepare an FDS, however an FDS is not mandatory. Medium-growth urban area means any urban area (as defined by Statistics New Zealand in 2016) that:
a) has a resident population of over 30,000 people according to the most recent Statistics New Zealand urban area resident population estimates; and
b) in which the resident population of that urban area is projected to grow by between 5% and 10% between 2013 to 2023, according to the most recent Statistics New Zealand medium urban area population projections for 2013(base)-2023.
The NPS-UDC identifies the Nelson Urban Area as a medium-growth urban area. The Nelson Urban Area covers all of the Nelson territorial authority area (excluding the Whangamoa Area Unit) and part of Tasman District including Richmond and Hope.
Under the NPS-UDC, the FDS needs to only cover the Nelson Urban Area, however the two Councils decided that there are many benefits in the FDS covering all of the two regions.
2.2 What should the FDS include
What the FDS should include is set out in policies PC12 to PC14 of the NPS-UDC. To summarise, the NPS-UDC requires that the FDS identifies the following matters in regard to housing and business for both the medium and long term:
sufficient, feasible development capacity to be provided;
evidence of analysis of opportunities, scenario testing, constraints analysis, and consultation;
maps and tables showing the location, timing, and sequencing of development capacity (including any “no-go” areas where relevant);
identification of the development infrastructure to support future development capacity;
implementation actions: RMA, LGA and LTMA changes, how infrastructure will be funded;
and
how the FDS will be responsive to changes in demand or where land owners’ intentions change.
In developing the FDS Councils are required to engage and consult. Consultation for the Nelson Tasman FDS is being undertaken in accordance with the Local Government Act. A schedule of consultation and media undertaken during the development of the FDS is included in Appendix 1.
2.3 Local context
Analysis of existing development capacity in Nelson and Tasman indicates that in the short to medium-term (the next 10 years) there is sufficient feasible residential capacity when housing demand and capacity is pooled across both Councils. There is a shortfall expected sometime in the longer-term (years 11-30) period for the Nelson Urban Area (which covers Nelson City and Richmond in Tasman). Tasman District alone has sufficient capacity to accommodate projected growth in the other settlements in its District, provided that population growth does not occur at a high rate, over the longer term.
The focus of the FDS is therefore on identifying residential development options to ensure sufficient development capacity in both regions, in the longer-term (2028 to 2048).
The FDS will set out how Nelson City and Tasman District will accommodate expected housing and business growth over a 30-year period (2018-2048) and will show where future growth is likely to be located and how development is likely to be phased and timed over this 30-year period.
The FDS does not set out the detail of how future housing and business areas will be developed.
This detail will be developed through review of both District Plans and possibly resource
management plan changes, and Council long term plans and infrastructure strategies. Such plans offer the community the usual opportunities to be involved in their formulation, with submissions and appearance at hearings. Detailed costs and benefits of developing the respective areas will need to be understood sufficiently before rezoning of these areas occurs. Further investigation will also be needed to fully understand the extent of some of the growth areas’ constraints identified in the FDS.
2.4 Process
A five step process to develop the FDS was followed, generally as set out in Figure 1. The process evolved over the course of the project.
Figure 1: Overview of the FDS process.
3. Environmental scan
Understanding critical constraints and opportunities involved assessment of existing data, stakeholder workshops, engagement with iwi and public feedback via an online survey.
3.1 Analysis of existing data
A review of geospatial data held by the two Councils was undertaken. This identified variable levels of data relating to aspects such as natural hazards and environmental values.
Key constraints maps were developed showing mapped areas relating to the following:
state Highways;
high voltage transmission lines;
flood overlay;
inundation overlay;
5m inundation area;
coastal hazard areas;
liquefaction risk areas; and
slope instability areas.
In addition to this map, Tasman District Council provided area-specific maps relating to modelled flood hazards.
Turning to data on housing, information available on the Ministry of Business, Innovation and Employment website shows that median house prices in Nelson and Tasman have grown at a similar rate to many other cities and districts in New Zealand. However relative to median income, the price to income ratio in Nelson and Tasman is very high, one of the worst in the country.
Figure 2: Median house prices in Nelson and Tasman compared to other parts of New Zealand.
Source: Ministry Business, Innovation and Employment.
Data comparing building permits issued with population growth suggest that for Tasman, there is no shortfall in the supply of dwellings, relative to demand. The dashed line in the graph below
(Figure 3) represents household growth, while the solid line is building consents issued for new dwellings.
Figure 3: Tasman household growth compared to building consents issued for new dwellings.
Source: Ministry Business, Innovation and Employment.
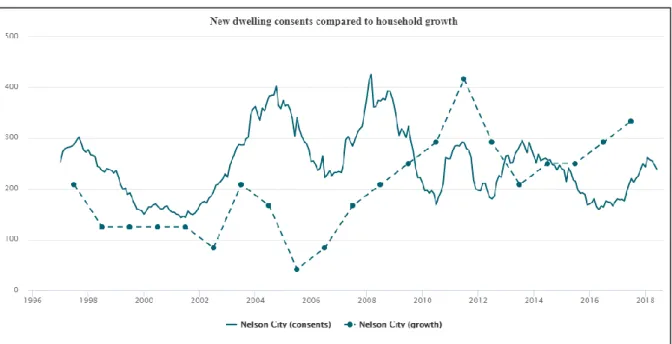
For Nelson City, the picture is similar, except for the last few years where building consents issued appear to lag household growth.
Figure 4: Nelson household growth compared to building consents issued for new dwellings.
Source: Ministry Business, Innovation and Employment.
3.2 Stakeholder workshop
The first workshop was attended by 40 participants, comprising members of the FDS consultant team, Council planning, development and engineering staff, and representatives of other
organisations such as NZTA, Ministry of Education, Ministry for the Environment, Nelson- Marlborough District Health Board, Housing New Zealand, Nelson-Tasman Housing Trust, Transpower, Network Tasman, Nelson Regional Development Agency.
The workshop included presentations from Council representatives and members of the FDS consultant team.
The purpose of the first stakeholder workshop was to:
help set the scene for the strategy;
identify constraints, opportunities and no-go areas; and
identify some high-level growth options to be considered.
Two group work sessions focused on identifying and ranking key constraints and opportunities, and on identifying options for addressing the household shortfall identified in the Council’s capacity assessments for the Nelson Urban Area over the period 2028-2048. Some groups also considered growth options for other settlements in Tasman District, should current population projections prove overly conservative relative to available capacity over the medium-long term.
Participants were asked to identify any ‘no go’ areas, that is areas where urban growth should be excluded. Common criteria for excluding areas from consideration for growth covered:
highly productive soils;
areas prone to flooding, coastal hazards and erosion;
low-lying areas which are likely to be impacted by sea level rise / which are less than 5 metres above sea level; and
avoid creating further community severance.
Productive soils were identified as a combination of Rural 1 land as identified in the Tasman Plan, as well as land categorised by the Council as A or B, based on their productivity classification.
Flood hazards were indicatively identified based on Council modelling of flood risks, using a number of sources.
Coastal areas subject to potential hazards (like long term sea level rise) were identified as being land within 5m of mean sea level.
3.3 Iwi feedback
Specific consultation processes were undertaken with iwi during the course of the project. This covered a range of hui which addressed a large number of topics. Appendix 2 contains a summary of the matters addressed. In terms of spatial constraints and opportunities, some common themes from consultation with iwi included:
1. Need to take a long term view
2. Protection, enhancement and restoration of the natural environment 3. Supporting social and economic development.
3.4 Public feedback
The first round of consultation on the FDS sought to gather feedback on initial high-level growth options for the combined Nelson and Tasman Regions. The Councils sought feedback via a public
survey, which was open to receive feedback between 23 January and 13 February 2019
(inclusive). Detailed comments were also received from a variety of organisations and groups.
The public survey sought responses on three generic growth options presented- Spread Out, Intensify, and/or Start from Scratch, and offered opportunity for feedback on other options and challenges to be considered. The majority of responses utilised the online survey platform provided on the Councils’ websites, though many respondents did not respond to all questions.
Other respondents utilised hard copies of the feedback form or provided feedback via email.
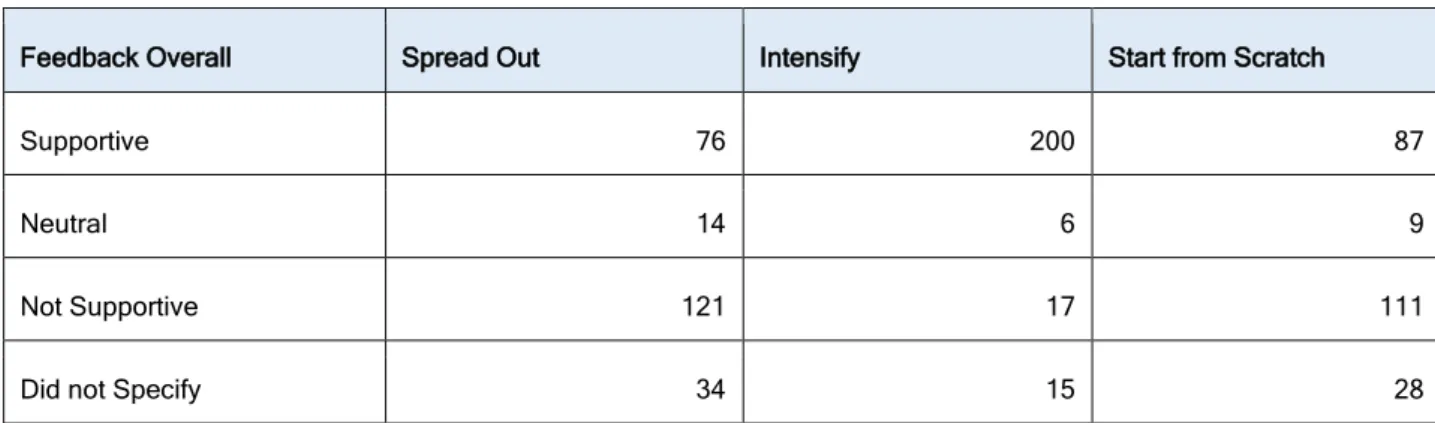
Table one shows the number of respondents who stated support, were neutral or did not support the three options.
Table 1: Round one consultation overall feedback on growth options.
Feedback Overall Spread Out Intensify Start from Scratch
Supportive 76 200 87
Neutral 14 6 9
Not Supportive 121 17 111
Did not Specify 34 15 28
Note: This is the total number of feedback received from all respondents who answered this survey question.
The most preferred growth option across both Nelson and Tasman is to intensify by focusing growth in and around existing centres. The least preferred option by Nelson respondents is to spread out by focusing growth on the outskirts of existing centres, while the least preferred option in Tasman is to start new settlements from scratch.
The top five considerations for urban settlement and growth were identified as:
preservation of natural landscapes;
preservation of flat, productive land;
affordable housing (such as lowering land costs);
climate change responsiveness and CO2 reduction; and
diverse housing choices.
Feedback from groups and organisations was varied. Generally there was support for more compact forms of growth where new housing was placed close to transport and services while productive land was retained for horticulture.
The report on round one of consultation is attached as Appendix 3.
3.4.1 Business / developers feedback
A separate business and developers forum was held during the initial phases of the project. This workshopped a range of issues including the spatial growth options and pros and cons of each, and shortages of types of housing or business land in the regions. A summary of feedback from business/ developers is attached as Appendix 4.
3.5 Population growth estimates
As of 2018, the combined Nelson-Tasman Regions have an estimated resident population of 104,000, with a near even split between Nelson City and Tasman District. The combined urban areas’ population of the two regions (as defined by Statistics NZ)1 is approximately 80% of this total (84,000 people). The urban proportion of the total population of the two regions has increased slightly over the 10 years 2008 to 2018.
Fast growing areas over the period 2008 to 2018, as recorded by Statistics New Zealand, were the Richmond East and West areas in Tasman District and the Ngawhatu and Isel Park areas in Nelson City. Tasman District has also seen significant growth around Motueka and rural- residential development in coastal areas.
Both Councils report that most housing growth in urban settlements has been by way of outwards expansion (greenfields growth). There has been some infill and redevelopment. For example the area surrounding Nelson City Centre has increased in population by around 1,000 people over the period 2008 to 2018.
Latest Statistics New Zealand population projections for Nelson and Tasman are now two years old. Delays in the release of 2018 census data by Statistics New Zealand means that new
population projections are not likely until May 2020. As is normal with a strategy such as this FDS, a range of growth scenarios have been modelled; this is particularly important in the absence of up to date data. Low, medium and high growth scenarios have been examined. The medium
scenario is the one both Councils’ long term plans are based on and is considered to be most realistic overall. However, with current fast growth in Tasman, a high growth scenario has been modelled. This approach is intended to future proof the Nelson and Tasman FDS.
Population projections prepared by Tasman District Council for the FDS are attached as Appendix 5.
3.6 Development capacity assessments
Given that recent growth has been high in the Tasman District, the analysis undertaken to inform the identification of future development areas has considered the potential implications of high population growth over the next 30 years.
Nelson City and Tasman District Councils completed an assessment of housing and business development capacity, for the Nelson Urban Area as required by the NPS-UDC, in November 2018. That is, the capacity to absorb projected growth in terms of serviced and zoned land for residential and business activities.
1Nelson urban area, Motueka, Mapua, Brightwater, Wakefield, Takaka.
Capacity assessments completed by the Councils were as follows:
capacity Assessment for the Nelson Urban Area;
capacity Assessment for Nelson City Council Territorial Area; and
capacity Assessment for the Tasman District Council (part of District forming the Nelson Urban Area).
The capacity assessment for Tasman District Council was based on the medium growth scenario set out in Table two, which used Statistics New Zealand (SNZ) high projections for Richmond, Motueka, Wakefield, Brightwater and Mapua for 2018-2028, and SNZ medium projections for those settlements for 2028-2048 and for the rest of the district for 2018-20482. The capacity assessment for Nelson City Council was also based on SNZ high projections for 2018-2028 and medium projections for 2028-2048.
3.6.1 Residential development capacity required
Table 2: Estimated residential capacity required to meet growth for the most likely (medium), high growth and low growth scenario.
2018-2028 2028-2048 2018-2048
Additional dwellings needed 2018-2028
Additional capacity needed, including NPS-UDC margins for Nelson and Richmond 2018-2028
Additional dwellings needed 2028-2048
Additional capacity needed, including NPS- UDC margins for Nelson and Richmond 2028-2048
Additional dwellings needed
Additional capacity needed, including NPS-UDC margins for Nelson and Richmond
Medium Growth Scenario 6,200 7,000 5,800 6,300 12,000 13,300
Higher Growth Scenario 8,400 9,400 13,400 14,600 21,800 24,000
Lower Growth Scenario 3,700 4,100 2,400 2,600 6,100 6,700
Source: Nelson and Tasman Future Development Strategy Growth Projections.
The combined Nelson Tasman assessment of current housing and business development capacity of the Nelson Urban Area found that, under the medium population projection, there was adequate capacity over the ten years 2018 to 2028, when the demand and capacity is pooled for both
Councils in the Nelson Urban Area. There is a shortfall of around 2,000 residential dwellings expected sometime in the longer-term, year 11-30 period. The capacity assessment found that Tasman District has sufficient capacity to accommodate the growth of its other settlements in its District.
Under a high growth future, based on the assessments of existing housing development capacity, in the form of zoned land and gazetted special housing areas room for around 12,000 additional
2Tasman District Council. (2017). Growth Model 2017 Summary of Outputs, Assumptions, and Methods.
residential dwellings would be required in the 11-30 year time period, over the combined Nelson Tasman regional area.
3.6.2 Business development capacity
Table 3: Estimated business demand and capacity over the period 2018 to 2048.
Business Land
Demand (Ha) Capacity (Ha) Surplus (Ha)
Low Medium High Capacity report
TDC vacant
land Total Low Medium High
Industrial -26 -2 46 39 72 111 137 114 65
Commercial 13 24 37 34 91 124 111 100 87
Retail 28 42 52
Total 15 64 135 73 163 235 220 172 100
Source: Nelson and Tasman Future Development Strategy Growth Projections.
Note: While demand for retail has been estimated separately, retail and commercial capacity is included in the estimate of commercial capacity.
The combined Nelson Tasman assessment of business development capacity found that under the medium growth scenario there was sufficient capacity to meet demand for business land in the short, medium and long-term.
Table three shows estimated demand for business land for low, medium and high growth scenarios, and estimates of existing business land capacity based on an assessment of:
vacant and underutilised business land in the Nelson Urban Area (identified as ‘Capacity report’ in Table three); and
vacant zoned land in Tasman District that lies within and outside the Nelson Urban Area (identified as ‘TDC vacant land’ in Table three).
The analysis shown in Table three indicates that there is sufficient business land to meet expected demand under medium and high growth scenarios, assuming more effective use is made of
existing business land.
3.6.3 Changing housing needs
In considering how to accommodate future housing, the Councils’ capacity assessments (as well as stakeholder feedback) noted a wide range of factors that are likely to influence future housing demand. Some commonly identified influences include:
there will be more older adults, but under a high growth projection there could also be many more people of working age;
housing needs to be more affordable for people on low to moderate incomes;
climate change will see sea levels rise and more extreme weather patterns;
how and where people work may change;
types of infrastructure may change, for example rather than reliance on large networks, there may be more small scale, locally based systems;
roads will get busier and so alternatives like building up public transport and walking and cycling networks are needed; and
different models of housing and living arrangements may become more desirable.
4. Method and approach for identifying potential future development areas
4.1 Introduction
The next phase of the project began the process of identifying a long list of options to provide additional capacity.
The option generation process was not constrained by considerations of capacity and / or how much development was needed to be accommodated.
Sources of potential options were drawn from previous and current work undertaken by the
Councils, feedback from the public and stakeholders, as well as options that were identified as part of the Strategy development process.
In identifying possible areas to accommodate the shortfall in housing capacity, a wide range of areas are possible candidates, including intensification of existing urban areas, developing on the edge of settlements, or developing new settlements. There will be a spread of areas across Nelson City and Tasman District. In addition, there are a wide range of factors to take into account when considering whether each option is suitable.
A multi-criteria analysis (MCA) approach has been used to assist in the selection of the best
combination of areas to accommodate future growth. MCA is a type of decision tool used to assess the performance of an option or options in achieving a set of outcomes or objectives, relative to other options. The MCA approach is designed to assist with decision-making between options where there are variables where assigning a specific monetary cost is difficult.
MCA techniques evaluate relative performance between options based on an explicit set of
identified criteria. Individual performance on criteria can then be aggregated and ranked to provide an indicator of the overall performance of options, relative to others. Relative performance can be used to select a preferred option or to identify a short-list of options for detailed appraisal.
MCA provide a structured and transparent framework for comparing options; particularly when comparing options where:
it is not feasible or practical to quantify some or all of the costs and benefits; and
some or all of the main objectives and effects relate to social, cultural or environmental factors for which there are few robust techniques and/or information that would enable these considerations to be monetised.
By identifying the basis on which options have been compared, the MCA approach allows decision-makers, technical experts and stakeholders to see what factors have been taken into account to reach a preferred option.
Advantages of an MCA:
takes a structured approach to the factors that are being used to assess the relative value of one option in comparison to other options;
the choice of criteria is made explicit but are open to refinement or change as part of the process;
provides a framework for a wide range of technical experts, stakeholders and decision-makers to be involved in the development and testing of criteria and the evaluation of options;
scores and weights, if weights are used, are developed using established approaches; and
provides an alternative approach to assessing the relative value of an option to achieve outcomes where it is not practical to precisely define or assess the monetary values associated with the advantages and disadvantages of an option.
An overview of alternative assessment techniques and selection of decision tools is included in Appendix 6. An outline of the key stages of an MCA approach is set out in Table four.
Table 4: Overview of the key stages of a Multi-Criteria Options Analysis.
Stage Description
Identify outcomes or
objectives Outcomes are established to set the decision-making context for the MCA.
Option identification Identify a range of options to be assessed.
Identification of evaluation criteria
Identify relevant aspects or attributes, referred to as criteria, which need to be taken into account in the decision. These are informed by the identified outcomes or objectives.
Criteria are typically clustered into logical categories or grouped according to the outcomes.
Option evaluation Evaluate options by applying a score against each criterion for each option; resulting in a performance matrix which is used to calculate an aggregate score.
Analysis of options
A range of analysis is typically undertaken to examine the results.
Weights can be derived and applied to adjust the relative importance of some criteria in comparison to others, resulting in an adjusted aggregate score for each option. The total aggregate score for an option provides a rank order for that option, relative to other options.
Identifying the
preferred option The final stage of the process is selecting the preferred option, for recommendation to decision-makers
4.2 Establishing outcomes
The joint Nelson City Council and Tasman District Council community outcomes in the Long Term Plans have been used to set the MCA decision-making context. The community outcomes were developed through a consultative community engagement process, and set out what the Councils aim to achieve in order to promote the social, economic, environmental and cultural interests of the current and future communities of Nelson and Tasman. These outcomes are used to guide the delivery of services and the development of the regions in a way that is efficient, effective and appropriate to current and anticipated future circumstances.
4.3 Identification of potential future development option areas
This section provides a summary of the process for identifying potential future development areas or options. The option generation process involved an iterative process of:
identifying a range of possible development scenarios;
using general principles of settlement planning to help identify appropriate areas;
mapping these areas;
refining the areas involved;
assigning a development type to each area; and
calculating an estimated yield of housing.
The long list of potential options were drawn from a range of sources including:
workshops with developers and businesses;
iwi discussions;
stakeholder workshops;
public consultation;
sites discussed in the past within the councils; and
previous strategies and plans.
Further option areas were identified during the second round of consultation undertaken in April 2019, and have been evaluated using the approach outlined in section five.
4.3.1 Scenario development
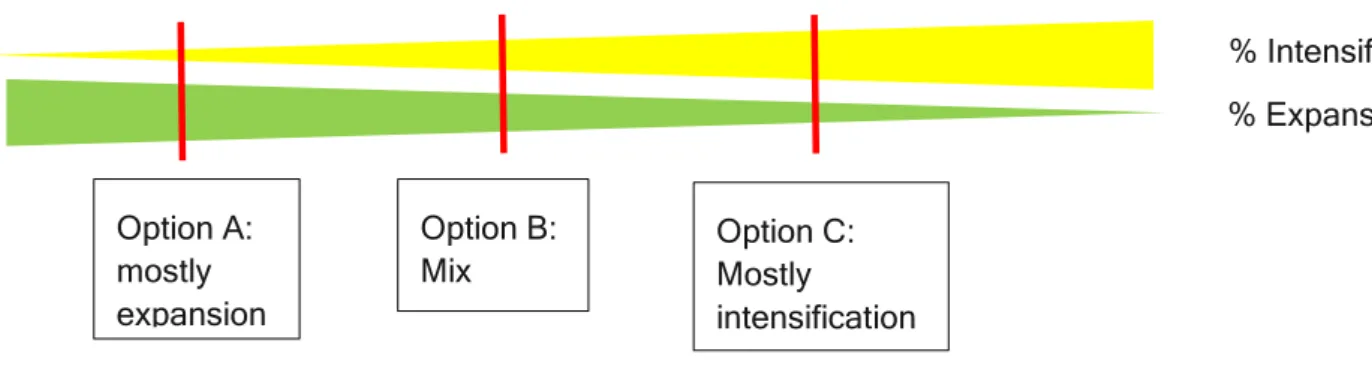
Scenario development commenced with the first stakeholder workshop.
The workshop identified and discussed constraints and opportunities, as well as high level scenarios. As an output of this workshop, the following high level scenarios were developed as illustrated in Figure 5 below.
Figure 5: Four high level scenarios identified via the first stakeholder workshop.
4.3.2 Development area principles
A set of ‘development area principles’ were prepared to help guide the detailed identification process, including which matters should be taken into account when identifying development areas, versus what matters would be addressed at the implementation stage. These development principles were drawn up by the Council and consultant team, and are attached as Appendix 7.
4.3.3 Detailed option development
In the Tasman District one source of options was the Tasman District Council growth model. This model identifies a wide range of development areas within and adjacent to the main settlements, as well as rural-residential areas. Some of these areas are already zoned for residential
development, but options for increased yield through higher density development typologies were also considered. Some other areas have been tentatively considered in the past but not yet zoned.
Some of these potential development areas were reviewed to establish whether they would make suitable locations for housing and business development. Other areas identified are on the fringes of the existing settlements where current growth patterns (such as incremental growth on the edges) suggest that development pressures will be experienced over the 30 year period. Options were not, however, confined to the growth model. Consideration of a high growth future required a range of possible development areas be identified and a number came through the public
consultation process.
These development areas were reviewed from the point of view as to which areas involved new residential capacity, over and above existing zonings (that is, their development would require a plan change to rezone land). For example, these areas might involve the rezoning of rural land to urban purposes, or rural-residential to urban residential, or involve adjustments to density controls in areas of existing development, such as the area around Richmond already identified for infill development and Upper Moutere and Mapua involving rural residential to residential. Possible new intensification areas were also identified in Motueka, Brightwater and Wakefield.
In Nelson City, potential development options were identified on the basis of previous work undertaken by the Council, as well as desk top assessment of possible additional development areas. For example, expansion options to the north, such as Hira, had been previously identified in documents such as the Nelson Urban Growth Strategy. For intensification options, a range of reports prepared by the Council had identified potential areas. These areas tend to be
concentrated around Nelson City Centre, Nelson South, Stoke and Tahunanui, being the main activity centres in the city, as well as being on main transport routes.
Relevant reports referenced include:
Nelson Richmond Urban Housing Intensification Study;
Nelson Urban Growth Strategy; and
Nelson Growth and Development Analysis.
Intensification could occur across the existing urbanised area. This would maximise opportunities for market-based responses. While this will support intensification, a common issue to be taken into account is the need to upgrade and expand the capacity of infrastructure (including social and community infrastructure) to cope with additional demands. These concerns generally lead to a more targeted approach.
A targeted approach to the redevelopment and intensification of the existing urban area, by way of identifying development areas, can:
assist decision-making by council, central government, iwi and key stakeholders in ascertaining the likelihood of capacity being taken up in different areas and understanding how capacity and feasibility may change for specific areas over time;
direct growth to deliver strategic outcomes – identifying where and when development and infrastructure services are likely to occur, leveraging off feasible capacity and major investments; and
enable coordination of efforts, allowing multiple agencies to focus efforts on agreed areas.
It is generally held that it is best practice to locate areas of intensification close to shops and services and to co-ordinate delivery with improved transport options. Walkable catchments of up to 10 to 15mins (800m to 1500m diameter) around a centre are typically defined and within that general area, intensification is enabled. There may be a graduation of intensity from the core to the edge of the walkable catchment. Areas of intensification may extend along key road corridors that have a strong multi-modal functionality, for example a passenger transport element to them.
The character of an area identified as likely to be subject to intensification pressures will change.
Having open space within areas identified for intensification is important to help address issues of greater population density and less on-site open space. Good urban design is also important in ensuring a degree of ‘fit’ with existing development.
In total, across Tasman and Nelson, a total of 81 potential future development areas were identified for evaluation (the long-list of options). The long-list of potential future development areas is included as Appendix 8.
4.3.4 Refinement of options
Options were mapped on a GIS platform and areas were refined to amend boundaries of the areas in accordance with the physical features of an area or to split or combine proposed options into more logical areas. The potential future development areas were “snapped” by the GIS system to existing features such as roads and property boundaries. This means that the spatial area identified for a potential option:
is the gross land area; incorporating environmental features like streams and areas that would be required for infrastructure, such as roads, schools and open space and would therefore not be developed for housing; and
may in many cases be greater than what would actually be developed, but serves as a rough proxy of housing capacity. The ultimate density of development in each area is not known and can vary from that envisioned in a strategic planning exercise such as this.
The potential long-list of options identified for residential development takes in just over 4,100 hectares of land and the potential areas identified for business land take in around 53 hectares of land.
Of the land area (hectares) identified for potential residential growth in the long list of options:
around 70% (2,995 hectares) is greenfield; and
around 30% (1,110 hectares) is intensification.
Of the land area (hectares) identified for potential residential growth in the long list of options:
1391 hectares are in Nelson City; and
2714 hectares are in the Tasman District.
All 53 hectares of land identified for potential business growth is greenfield land and located in the Tasman District.
4.3.5 Development typologies
Each residential development area was assigned a development typology (the type of housing which may be built in the area). This was used to estimate a potential yield, as well as to help explain the type of growth that may occur.
Intensification typology
Intensification involves the infilling or redevelopment of existing built up areas. Intensification can take a wide range of forms, from adding secondary or minor units to a site; placing a new
residential unit onto a section (infill) to redevelopment involving removal of an existing dwelling and building terrace housing or apartments.
In terms of standard planning controls, intensification may involve reducing or removing density controls and/or adjusting height limits. Intensification can involve both greenfields and brownfield sites. In the case of the FDS, the focus of intensification is the existing built up area of the main settlements in the Nelson Tasman areas.
The intensification typologies used for the FDS reflect the normal range of infill and redevelopment types experienced in residential environments across New Zealand and elsewhere. The typologies recognise that over time, as the population of the urban areas increase, land values rise and existing development ages, then a range of redevelopment types will occur. The typologies range from an extra unit being added to an existing site, through to redevelopment involving the removal of a building and its replacement with a number of new units, either in a two or three storey format.
A typology that recognises the potential for mid-rise apartments (4 to 6 storeys) has also been included, for example in locations in and around the Nelson City Centre. The assessment of additional dwellings that may be accommodated under each typology assumes that only some sections in the relevant development area will be redeveloped in-line with the typology, over the 30 year time period of the FDS.
Some intensification areas may be mixed use areas. In these areas, there will likely be a mix of houses and retail and commercial activities (such as flats above shops).
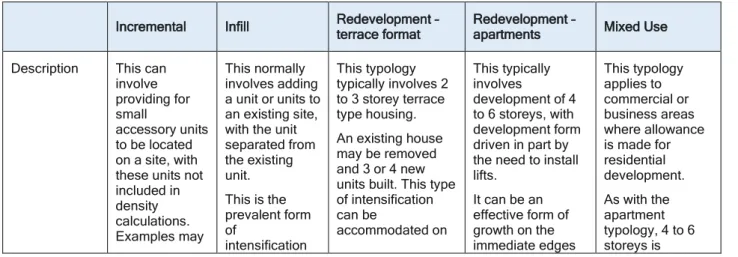
Intensification can be seen to be a series of different types of housing along a continuum, from less intense to more intense forms of housing. Types of intensification that are appropriate to the
Nelson Urban Area context are shown in Table five.
Table 5: Types of intensification appropriate to the Nelson Urban Area context.
Incremental Infill Redevelopment –
terrace format Redevelopment –
apartments Mixed Use Description This can
involve providing for small
accessory units to be located on a site, with these units not included in density calculations.
Examples may
This normally involves adding a unit or units to an existing site, with the unit separated from the existing unit.
This is the prevalent form of
intensification
This typology typically involves 2 to 3 storey terrace type housing.
An existing house may be removed and 3 or 4 new units built. This type of intensification can be
accommodated on
This typically involves
development of 4 to 6 storeys, with development form driven in part by the need to install lifts.
It can be an effective form of growth on the immediate edges
This typology applies to commercial or business areas where allowance is made for residential development.
As with the apartment typology, 4 to 6 storeys is
Incremental Infill Redevelopment –
terrace format Redevelopment –
apartments Mixed Use be ‘granny
flats’, portable homes, and potentially conversion of existing buildings into residential units
in Nelson and
Tasman. a suburban sized section.
Flexibility over density
requirements can see a variety of unit sizes provided, such as a number of 1 or 2 bedroom units in the same physical building envelope that might otherwise contain a single 3 or 4 bedroom unit.
of town centres, sometimes involving a mixed use approach.
There is the need for some form of transition or stepping ‘down’ to adjacent single storey residential areas.
common with the ground floor often devoted to a commercial activity (shop, office, showroom etc.).
The larger sites within business areas with more generous building coverage limits areas allowed for a greater yield to be achieved.
Development
Issues Typically there is a restriction on floor area (such as 60 sqm) and a requirement for the units to meet yard, height and set back controls.
In addition, the ability to subdivide a single house into two units may be provided, as of right, provided that the unit to be created can provide required on- site open space and possibly an on- site car parking area.
A minimum density control is used to help control the overall intensity of
development.
While yard, coverage and outdoor area requirements do apply, the density control is used as the primary tool.
Minimum density controls are removed, with building design controlled through a discretionary assessment process, including assessment of impacts on the privacy and on-site amenity of
neighbouring sites.
Controls relating to coverage, building height and height in relation to boundary controls apply and these are the main means of
controlling the bulk of buildings.
Outlook requirements (minimum open area in front of main living rooms) become important in ensuring that development internalises effects relating to potential overlooking
Larger sites are needed and height and height in relation to boundary controls need to recognise the larger building forms involved.
Landscaping and building
modulation becomes important, along with design review processes.
This form of intensification necessarily involves a high degree of change to an existing area
In many cases, the existing bulk and location requirements of the underlying zone can be maintained.
Height limits need to be in the order of 20m to allow for reasonable floor to ceiling heights Ensuring that outlook areas from the main living rooms of units will not get built out by adjacent redevelopment becomes an important consideration.
An outlook standard often applies, such as having a 10m deep outlook area clear of buildings from any living room. This is usually achieved by orientating living rooms to road frontages or setting buildings back from nearby boundaries.
Greenfield or urban expansion typology
Expansion options take the form of growth on the edge of existing settlements or the development on new urban settlements. This is commonly called greenfields growth.
Greenfields growth can take a variety of forms, from traditional suburban development to master planned communities that provide for a range of housing densities and housing forms, from stand- alone houses, through to terraced housing. In other cases, a clustered approach may be taken, with a dense core surrounded by areas for larger lots and restoration of natural features. This diversity makes estimates of development potential subject to a range of variables. Typical greenfields development types found in New Zealand are set out in Table six.
Table 6: Types of expansion found in the New Zealand context.
Expansion Types Description
Mixed density – medium to high
This type of expansion often involves a master planned approach to a large block of land. Within the land holding areas for higher density housing (for example terraces) are identified, perhaps around a central point or near an open space area. Surrounding these areas are lots for stand-alone houses.
Mixed density – medium to low
This type of development is often applied to areas of mixed topography, such as land holdings that comprise areas of flatter land and areas of steeper slopes.
Medium density development is clustered on the flatter land and larger lots are located on the steeper land.
Standard This is a conventional approach to subdivision that mainly involves lot sizes of a standard size and configuration.
Large lot This may involve a rural-residential type lot, perhaps in the 1,500 to 2,000m2 range, providing space for large houses as well as large areas for gardens and lawns.
Typically, new greenfields areas are subject to structure planning before rezoning and subsequent subdivision and development. The structure plan will take a large area and may well see part of the area identified for large lot development or similar, with other areas identified for more intensive housing. Typically, 30 to 40% of greenfields areas will be devoted to roads, open spaces and green networks.
In considering the shape and form of expansion areas, common principles cover matters such as:
clear boundaries – the boundary of an expansion area may follow a major road or landform feature such as a ridgeline. Having a clear boundary helps to address issues of potential long term ‘creep’ and provides some certainty over infrastructure planning;
locating the development area in a single water catchment, rather than crossing multiple different catchments assists with taking an integrated approach to water sensitive urban design;
linkages to existing urbanised areas – if the expansion area is in the form of an extension to an existing settlement, then ensuring that the expansion area aligns with key road links and infrastructure networks of the existing development is important; and
expansion areas should enable a comprehensive approach to be taken to their detailed planning and subsequent development. That is, the expansion areas may include a variety of landforms and environments which can be managed through a structure plan process.
This might include not developing part of the expansion area due to physical constraints, and
concentrating development in certain locations. The area not developed can then form part of a ‘back drop’ or green area for the development.
Rural-residential development was also identified as a form of ‘greenfields’ option. Rural-
residential development provides for housing capacity (albeit at much lower densities than urban type development). It also provides for housing choices. A range of typologies were developed for rural-residential development, based on the particular characteristics of opportunities in the Tasman area.
Business / Mixed Use
During the course of considering options, the need to develop some business-related typologies was identified. A standard industrial area typology was developed with lot sizes of 2,000 m2. The potential for some development areas to contain mixed uses was also noted in Nelson. A specific
‘inner city’ mixed use typology was developed for commercial land that may be used for apartment developments. For suburban areas a number of the residential typologies could involve an element of business or commercial activities, such as live/work units or units with a ground floor non-
residential use with flats above.
4.3.6 Assigning typologies to potential future development options
Each area was assigned a development typology, by Council subject matter experts, which described the anticipated form of residential development in that area and potential development yield, taking into account the 30 year time horizon of the strategy, and likely development
pressures and opportunities.
For the Nelson Tasman FDS, a description of each of the greenfield and intensification typologies including key assumptions, gross density and increased density for each typology is outlined in Table seven. Gross density means the total number of dwellings (per hectare) existing and expected to be constructed within an area. Increased density means the number of dwellings (per hectare) that are possible, over-and-above the number of dwellings currently in an area.
The increase in density is an average over the development area, taking into account the assumptions set out in Table seven.
Table 7: Overview of development typologies and key assumptions.
Description
Gross density (dwellings per ha)
Increased density (units per ha)
Key Assumptions
Intensification
Additional infill units, town
houses on some sites 12 2 20% of lots redevelop in 30-year period
Two storey terrace housing /
town houses 16 6 30% of lots redevelop in 30-year period
Some 3 storey terrace, some
low rise apartments 18 8 30% of lots redevelop in 30-year period
Mixed use area - some 4 to 6
storey apartments 18 12 33% of lots redevelop in 30-year period
Greenfields
Medium density - average lot
size 300m2 18 18 About 45% of gross area is used for roads, open spaces etc.
Standard density - average lot
size 550m2 12 12 About 35% of gross area is used for roads, open spaces etc.
Conversion of rural residential to standard density – average lot size 550m2
12 10
About 35% of gross area is used for roads, open spaces etc. Net increase recognises existing dwellings and inefficiencies of development of small lots
Medium-low density - average
lot size 700m2 10 10 About 30% of gross area is used for roads
and open spaces Conversion of rural residential to
medium-low density – average
lot size 700m2 10 8
About 35% of gross area is used for roads, open spaces etc. Net increase recognises existing dwellings and inefficiencies of development of small lots
Low density - average lot size
1000m2 7 7 About 30% of gross area is used for roads and open spaces Large lots (serviced) -average
lot size 1500m2 5 5 About 25% of gross area is used for roads
Rural residential (un-serviced) -
Average lot size 1ha 1 1 About 5% of gross area is used for roads and accessways Rural residential - Average lot
size 4ha 0.25 0.25 About 5% of gross area is used for roads and accessways
Business
Average lot size 2000m2 4 lots per ha
4.4 Estimated yield
The assumptions about development typologies outlined in Table seven were used to calculate an estimated yield for each of the options. Additional capacity for greenfield areas was calculated by multiplying the anticipated gross density for the option by the hectares within the gross area. The additional capacity for intensification areas was calculated by multiplying the anticipated additional number of residential dwellings (increased density) for the option by the hectares within the area.
Business capacity was determined based on the total hectares within the identified area.
Other development strategies (such as those for the Waikato and Greater Christchurch) use high level estimates of future capacities when developing the strategy. This reflects the strategic nature
of the exercise, as well as the point that subsequent actions, such as structure planning, will determine the detail.
It is also important to incorporate an element of future changes into the yield calculations; that is, it is a common experience for lot sizes in greenfields areas to reduce over time, as land prices increase and the costs of civil works increase.
Examples are as follows:
Waikato (Future Proof)
Over time, places aim to reach the following density targets:
50 households/ha: Hamilton city heart;
30 households/ha: Other intensified areas in Hamilton;
16 households/ha: Greenfield in Hamilton;
12-15 households/ha: Greenfield in Waikato and Waipa, and the large townships of Cambridge, Te Awamutu, Kihikihi, Huntly, Ngaruawahia, Raglan and Whaingaroa, Te Kauwhata; and
8-10 households/ha: Greenfield in Waikato and Waipa serviced rural villages.
Greater Christchurch3
The following density assumptions for households per hectare (hh/ha) refers to a net residential density, including roads and open space, but excluding stormwater management areas:
Christchurch central city intensification areas - 50 hh/ha;
Christchurch city intensification areas - 30 hh/ha;
Christchurch greenfields areas - 15 hh/ha; and
Selwyn and Waimakariri greenfields areas – 10 hh/ha.
3Urban Development Strategy Implementation Committee. (2007). Greater Christchurch Urban Development Strategy.
4.4.1 Nelson Tasman Future Development Strategy intensification yields
Table eight lists some of the factors involved in estimating the possible yield for the different intensification types set out in the previous sections.
Table 8: Intensification types.
Incremental Infill Redevelopment –
terrace housing Redevelopment –
apartments Redevelopment – mixed use Gross yields are
very difficult to estimate, but generally the number of units added are not large due to the complexity of conversions of existing houses and limited market for accessory type units.
As many areas of Nelson and Tasman are already subject to infill, additional development potential from adjusting density controls may not be large.
In areas of high demand (high land values), there is sufficient incentive for existing sites to be redeveloped.
Experience in places like Tauranga and Auckland suggest that 20 to 30% of sites in any given area may be redeveloped in a 20 to 30 year period.
Gross yields can be higher than redevelopment involving terrace formats, as the high building height helps to justify acquisition of existing, already developed sites.
However the areas identified for taller development are often restricted spatially to areas of high land value.
Redevelopment of these areas can often yield high numbers of new dwellings as business uses give way to residential.
Larger sites and fewer constraints enable significant development.
However not all sites will redevelop, as some business uses will remain
In making these assumptions, there is a deliberate move to not base yield on a plan-enabled capacity; that is a capacity based on all lots in an area redeveloped to the limits of what is enabled by the zoning. This is an unrealistic assumption. Rather more conservative assumptions have been made as to the take up intensification options (such as the percentage of lots that may redevelop in a 30 year time period). Generally, as the intensification options increase development potential above the current baseline, then there is a greater incentive to undertake redevelopment.
Ministry for the Environment guidance on the topic4 notes that it is common to apply a discount factor to account for the fact that only a proportion of plan-enabled opportunities will be taken up