This is due to the difference in trading hours between the markets of international ETFs and benchmark indices. Svetina (2010) compares the tracking performance of domestic ETFs with the international ETFs and confirms that the tracking error of international ETFs is more than double that of domestic ETFs. First, the study examines the differential behavior of return and volatility estimated in trading prices and NAVs of international ETFs.
Third, the study analyzes the risk-adjusted performance of international ETFs relative to their benchmarks using the Capital Asset Pricing Model (CAPM). The returns and volatilities of international ETFs are calculated based on their trading prices or their NAV. The findings of Rompotis (2010) and Rompotis (2015) provide some useful insights into the investment strategies (such as active or passive) and duplication strategies (such as full, optimized or synthetic) of international ETFs.
This is the ability of international ETFs to mimic the performance of their foreign tracking indices. However, Svetina (2010) finds higher tracking error for international ETFs compared to domestic ETFs, suggesting transaction costs as a possible reason. Therefore, the tracking error of international ETFs is relatively larger than that of domestic ETFs.
We calculate the returns and volatility of benchmark indices to compare the performance of international ETFs and their corresponding benchmark indices.
Pricing efficiency of the international ETFs
Measurement of premium/discount
Persistence of premium/discount
Sample of the study
Empirical Results
- Return and volatility analysis
- Performance Regression Analysis
- Single-factor CAPM
- Tracking Error Analysis 1. Tracking Error Estimation
- Tracking Error Persistence
- Premium Discount Analysis 1. Premium/Discount Estimation
- Premium Persistence
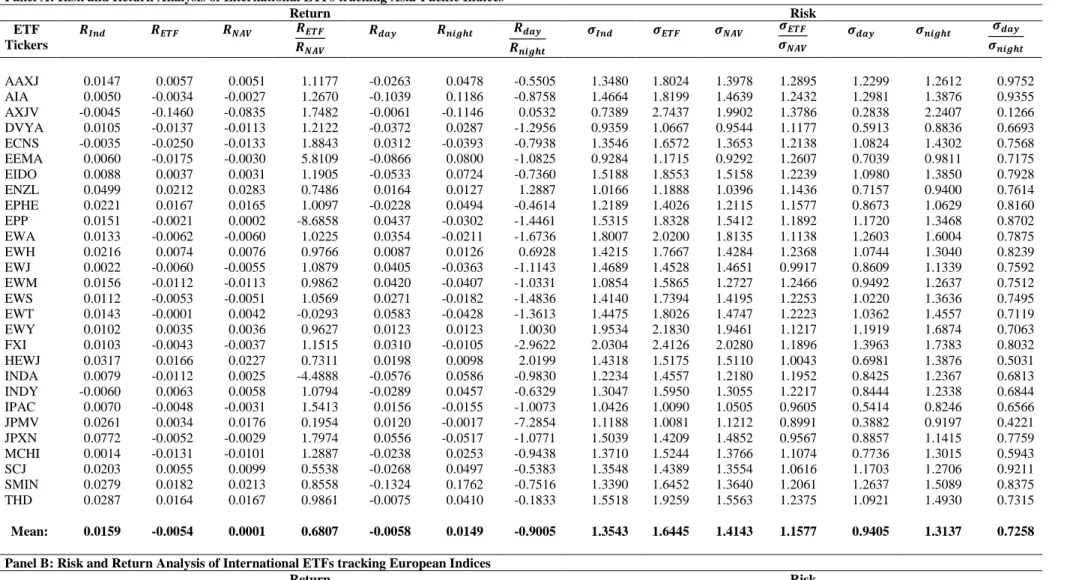
Note: Table 1 reports the profile of international ETFs offering exposure to Asia Pacific (in Panel A) and European (in Panel B) markets. In the case of returns, our findings suggest that trading price returns are relatively better replicators of the underlying indices compared to NAV returns for the Asia-Pacific group of ETFs. Because investors receive NAV returns on their investments, our results suggest that the NAV returns of the European group of ETFs are better compared to those of the Asia-Pacific group of ETFs.
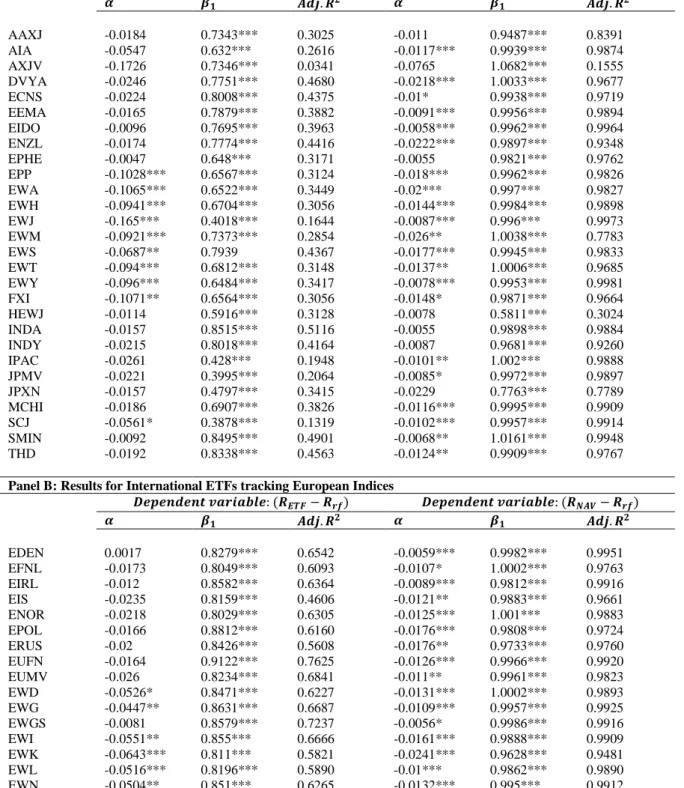
It also contains the intraday and overnight returns and the volatility of the trading prices of the international ETFs. The higher day-to-day return volatilities are also confirmed by the ratio (𝜎𝑑𝑎𝑦⁄𝜎𝑛𝑖𝑔ℎ𝑡) which is less than one for all ETFs in the sample that offer exposure to the Asia-Pacific and European markets. For the Asia-Pacific group of ETFs, our results show that 𝛽1 of the CAPM model based on the trading price return ranges from 0.3995 to 0.8495, and their average deviation from unity is 32.60 bps, which is not only statistical , but also economically significant.
Overall, the results for the Asia-Pacific and the European group of ETFs are consistent, such that in both cases the deviation of 𝛽1 from unity is higher when estimated by the CAPM model based on trading price returns compared with NAV returns. Therefore, we can conclude that the NAV return is a more appropriate indicator of the performance of international ETFs than the trading price return. The results of model (19) based on the tracking errors of trading prices show that the coefficients 𝛽1 are positive and significant for almost all international ETFs except for one ETF in the Asia-Pacific group.
The 𝛽2 coefficients are positive and significant for 17 out of 28 ETFs from the Asia-Pacific group and 12 out of 28 ETFs from the European group. The results of model (20) based on the NAV tracking errors show that the 𝛽1 coefficients are positive and significant for 13 out of 28 ETFs from the Asia-Pacific group and 15 out of 28 ETFs from the European group. The 𝛽2 coefficients are positive and significant for 7 out of 28 ETFs from the Asia-Pacific group and 9 out of 28 ETFs from the European group.
The results suggest that the NAV tracking errors persist in almost half of the ETFs in each group (ie Asia-Pacific and Europe) for one day, but after two days the NAV tracking errors persist in only a few ETFs. Further, the negative and significant 𝛽2 coefficients for one ETF in the Asia-Pacific group suggest its tendency to approach the mean values of the NAV tracking errors. Based on our results, we conclude that tracking errors persist for several international ETFs when estimated in terms of trade price.
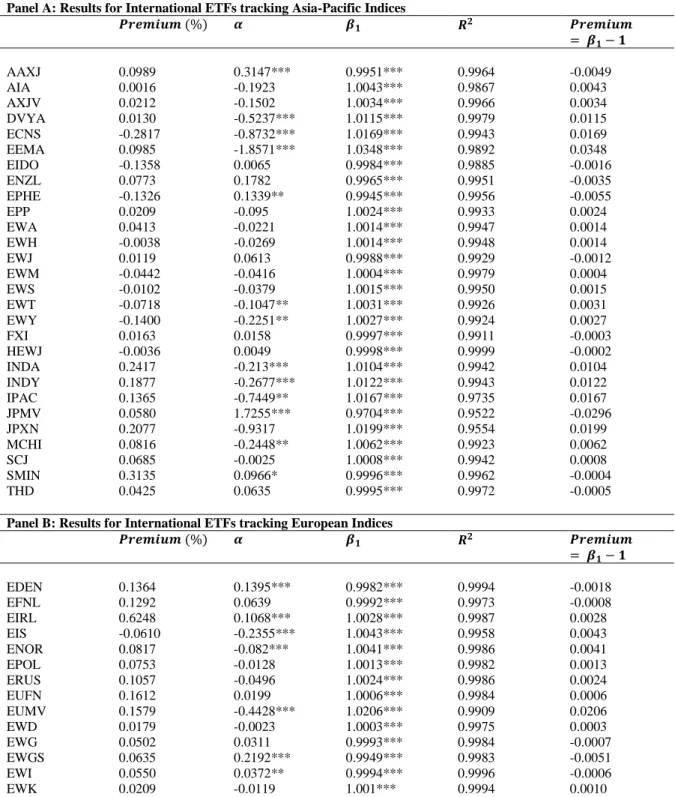
In this section, we present results on the price efficiency of international ETFs tracking Asia-Pacific and European markets in panels A and B, respectively. Furthermore, the coefficients 𝛽1 is the size of the contribution of NAV to the trading price of international ETFs. Our findings suggest that the 𝛽1 coefficients for all international ETFs are positively significant, regardless of the markets they follow.
Overall, the results of the percentage estimates and the OLS regression estimates of pricing efficiency for international ETFs are consistent.
Conclusion
Although we find that the coefficients of 𝑎𝑙𝑝ℎ𝑎(𝛼) for 15 ETFs from the Asia-Pacific group and 22 ETFs from the European group are statistically significant. However, from an economic perspective, most 𝑎𝑙𝑝ℎ𝑎(𝛼) coefficients are below 10 basis points and do not make a material contribution to the premium or discount of ETFs. These results suggest that internal pricing frictions cause the divergence between trading prices and NAVs of international ETFs.
In terms of price inefficiency, our results suggest that the premium or discount fades slightly as they move from one lag to two days, despite the fact that most international ETFs in the sample persist for two days. More specifically, the premium or discount continues on 26 ETFs in the Asia-Pacific and 20 ETFs in the European group for a day. However, the persistence effect diminishes slightly over two days, as the number of ETFs suffering from price inefficiency decreases to 18 ETFs in each of the two groups (ie Asia-Pacific and European).
Therefore, based on our findings, we conclude that significant arbitrage opportunities exist in international ETFs, which remain available for two days in most cases. In terms of pricing efficiency, the study found evidence to support price divergence for international ETFs. International ETFs in particular mainly trade at a premium, regardless of the underlying markets they track.
Finally, our findings reveal that pricing inefficiencies persist for two days for most international ETFs, although the premium or discount fades slightly over one to two days of lag. First, the findings provide an understanding of the distinctive behavior of estimated returns and volatilities in the trading prices and NAVs of international ETFs. Second, the results related to intraday and overnight comparison of returns and return volatilities of international ETFs enable investors and practitioners to choose the optimal investment strategy.
Our findings on the magnitude and persistence of tracking errors help investors ensure higher tracking ability before investing in the international ETFs. In this regard, our results provide insights into the dynamics of price inefficiency of international ETFs, allowing investors to implement the futile investment strategy of earning abnormal returns from potential arbitrage opportunities (as and when they arise). By analyzing the returns and return volatility, tracking ability and price efficiency of international ETFs, this study provides investors and practitioners with the substantial performance-related information useful to make more informed investment decisions.