The first (chapter two) estimates the bilateral trade costs between Bangladesh and its major trading partners, before examining the factors influencing Bangladesh's import costs. If we cut the export subsidy by 50 percent and transfer this amount of money from the government to the targeted seven groups of low-income households, real GDP could increase by about one percent. In the third application, I again use the MyGTAP model to estimate the potential market entry costs of Bangladesh's Least Developed Countries (LDCs) graduation.
The findings show that if developed countries impose standard Generalized System of Preferences (GSP) tariffs on imports from Bangladesh and at the same time Bangladesh eliminates its export subsidies, Bangladesh's gross domestic product (GDP) may decline by approx. The garment sector could be seriously affected and exports could decrease by about 14 percent. China now holds the position of Bangladesh's major trade and investment partner, while India is its.
Computational simulations of general equilibrium modeling show that if India and China reduce NTMs through increasing trade facilitation by 50 percent, Bangladesh's exports can increase by three percent in these two markets. I then estimate the opportunity cost of export subsidies and the potential impacts of LDC graduation in Bangladesh, including on different households.
Introduction
One of the most popular structural gravity models is the one developed by Anderson & van Wincoop (2003) in which a multilateral resistance term was introduced to estimate bilateral trade costs. For Bangladesh, product-level NTM data is not available in the WTO's Integrated Trade Intelligence Portal (I-TIP), therefore, we have compiled a database of NTMs at the of the 6-digit HS product from the Bangladesh Trade Portal (BTP) of the Ministry of. Trade (MoC).7 The trade portal is a national information source where all tariffs, NTMs and other regulatory information related to international trade are published.
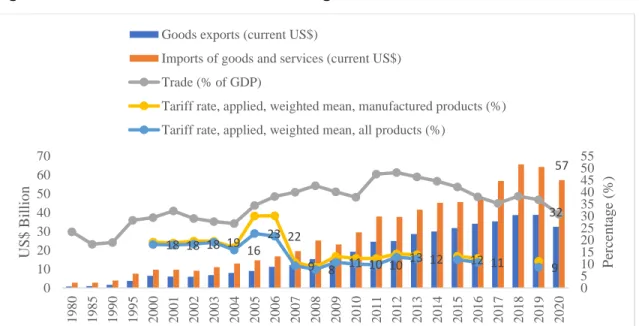
Gross Domestic Product (GDP) and total trade data were collected from the World Bank's World Development Indicators. Bilateral ad valorem tariff data were collected by the World Bank's World Integrated Trade Solutions. 7 The objective of the trade portal is to provide a convenient, logical and useful window into international trade information and related regulations, especially for information related to NTMs.
The ten newly aggregated sectors are assigned to the corresponding sectors in the Bangladesh SAM to determine the consumption share of each household of the 10 GTAP sectors. Bangladesh Vulnerability Profile prepared by UNCTAD in anticipation of CDP 2021 assessment of LDC List, retrieved from https://www.un.org/development/desa/dpad/wp-.
Trade Restricting Impacts of Non-Tariff Measures in Bangladesh
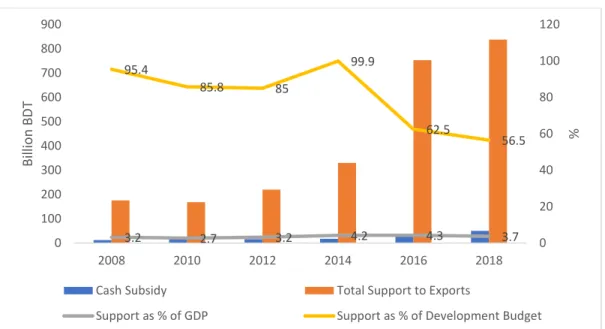
Evaluating the Impact of Eliminating Export Subsidies in Bangladesh
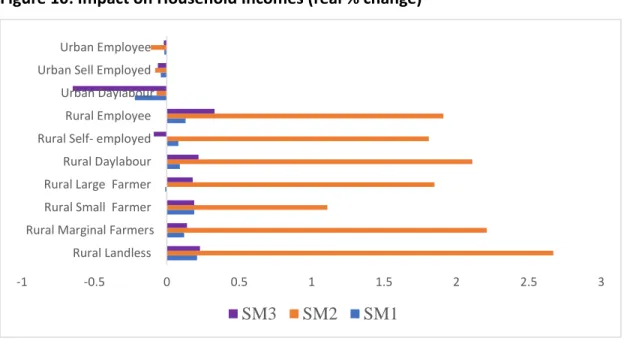
Our simulations suggest that the partial removal of export subsidies has a positive effect on GDP. Helmers & Trofimenko (2013) assess the impact of export subsidies in Colombia and find that the export subsidy positively affects export volumes of the subsidized sectors. This brief literature review indicates that the impact of export subsidies is ambiguous in the literature: the removal of export subsidies can adversely affect exports and employment.
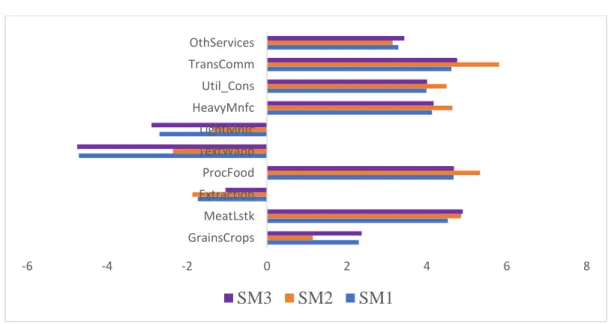
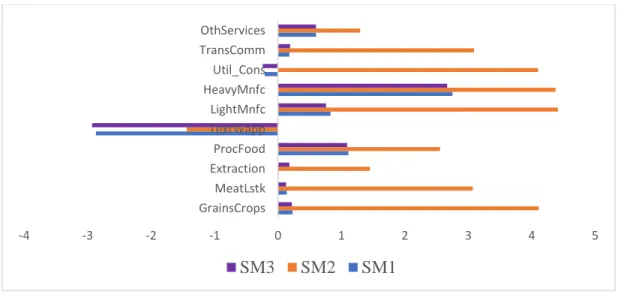
It appears that Bangladesh's export subsidy data sets do not appear to be accurate in the WTO. In scenario three, we introduce the elimination of export subsidies only in the clothing sector to analyze the impact. Exports from the ready-made garment sector could be reduced by 4.7 percent if we eliminate export subsidies only under scenario three.
We also examine the impact of the elimination of export subsidies only on the textile and clothing sector. The simulations show that the elimination of export subsidies has a positive impact on GDP due to the improvement of overall economic efficiency.
Costs of LDC Graduation on Market Access: Evidence from Emerging
Growing with Two Giants: A Mixed Blessing for Bangladesh
Conclusion and Synthesis
The following equation shows how remittances are determined in the MyGTAP model (Walmsley & Minor, 2013). In the equation below, it is shown how changes in remittance inflows occur in the framework of the MyGTAP model due to the policy shock. The left-hand terms in the above equation show the 'flow of remittances' by households [h] in the region [r].
The following equation shows how income outflow is determined in the MyGTAP model framework. The term [fyih (h,r)] denotes the inflow of income, and [favi] represents the percentage change in the average inflow of income to region 'r' per household 'h'. The following comparison shows how changes in foreign aid outflows occur as a result of an exogenous shock.
Similarly, aid inflow to the region [r] is determined by the percentage change in the shift factors of the aid inflow and percentage change in average aid inflow. The introduction of the foreign aid in the MyGTAP model allows an additional model closure., which is given by the following equation. First, 'the intra-household transfers that are transferred from households [k] to the household [h] in the region, i.e.
Where [𝑞𝑜(𝑖, 𝑟)] denotes the total supply of donation [i] in the region [r], while, [𝑞𝑜ℎ(𝑖, ℎ, 𝑟)] stands for the supply of donation, and [shrev( 𝑖, ℎ, 𝑟) ] is the share of a single household in the total value of the endowment. While [𝑞𝑜ℎ(𝑖, ℎ, 𝑟)] is the total supply of the household's donation and [𝑠𝑒𝑚𝑝𝑙ℎ(𝑖, ℎ, 𝑟)] expresses the service of the relevant region. Report of the DESA project, "Imagination of crisis response process in the LDC monitoring framework for graduated and graduated countries".
Reason: According to the 'Public Money and Budget Management Act 2009', the government should keep the budget deficit within 5 percent of GDP. According to the preliminary data, Bangladesh's domestic savings rose to 24.2 percent of GDP in fiscal 2021 from 23.8 percent in the previous fiscal year. Due to the surplus in the overall balance, the foreign exchange reserve reached USD 50 billion in September 2021.
Threshold: ≥ 4%, Bangladesh's spending in the education sector is about 1.3 percent of GDP, while India spends about 3.8 percent and Vietnam about 4.1 percent. Sea level rise also poses a major threat to the lives and livelihoods of people in coastal Bangladesh.
Structure of MyGTAP Model
MyGTAP Program: Updating Dataset
Then place this compiled zip file into datatool32's MyGTAP multi-home model (under the INPUT folder of the MyGTAP multi-sector model). Create a folder named MyGTAP under the C directory and place all these files in the MyGTAP folder. The weight or share of allocation is required for the following value streams 11.1 utilization factor allocation (WTF).
Restart Then restart MyGTAP by typing MyGTAPf (MyGTAP will reformat the weights and divide them to be compatible with an economically reasonable share split).
Monitoring Bangladesh’s LDC Graduation Progress
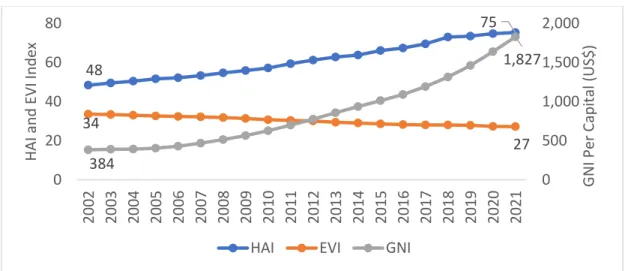
Bangladesh is one of the leading emerging economies in South Asia, with a steady average economic growth rate of around 6.5 percent over the decade. During the 2020 pandemic, it managed to maintain a growth rate of about 3.5%.14 In 2020, the country made great progress in the areas of Gross National Income (GNI) per capita, Human Asset Index (HAI) and Economic Vulnerability Index (EVI). . years. In this context, the main objective of this study is to identify the most important high-frequency socio-economic indicators that need to be monitored to track Bangladesh's development progress and to identify potential risks that could disrupt Bangladesh's growth.
20 "Least Developed Country Category: Profile Bangladesh", United Nations Department of Economic and Social Affairs Economic Analysis; https://www.un.org/development/desa/dpad/least-developed-country-category-bangladesh.html. Justification: Bangladesh's main export is ready-to-wear, which requires vast quantities of cotton. Bangladesh started rolling out the COVID-19 vaccine in January 2021 and only about 40 million double doses have been administered since then, which is about 20 percent of the country's total population.23 Bangladesh's goal is to have about 118 million completely vaccinate people of the total population (18+ people).
This study examines potential indicators that should be monitored to track the development progress of Bangladesh and identify the potential risks that could disrupt Bangladesh's growth. Justification: Public expenditure on education as a percentage of GDP has declined over the years in Bangladesh. Although the PCI for Bangladesh has steadily increased over the years, it is still much lower compared to its competitors such as Vietnam and India (UNCTAD, 2021).
Over the years, Bangladesh has not paid sufficient attention to the quality of education and health sector financing, which are key HDI indicators, and its expenditure as a percentage of GDP is lowest in South Asian countries (WDI , 2021). As of February 2021, only 21 percent of parliamentary seats in Bangladesh were held by women (UNWOMEN 2021).28 Although female labor force participation has increased, it is still much lower compared to neighboring countries. Yet, as of 2020, 63 percent of women will no longer be in the formal labor market in Bangladesh.
Renewable energy production as a percentage of total electricity has been poor and declining over the past two decades in Bangladesh (Figure A6). Bangladesh has made some incremental progress over two decades in accessing clean cooking fuel. However, still, 81 percent of the population, which is about 134 million people, does not have access to clean fuel and technology for cooking (Figure A7).
Copyright Permission
Co-authorship Declaration Forms