TABLE (2} -, showing- ' the rainfall recorded at all the stations in the basin of the Yarra and Dandenong streams, in the month of June, 1904. It is, of course, a very simple matter to derive the normal value of the annual rainfall at a station The horizontal line drawn about the middle along the diagram represents the normal rainfall of the year, and its height above the base line is equal to the arithmetic mean of all the heights included in the whole period.
Now it remains only to show how the total rainfall for the whole country is calculated. What is the normal amount of rainfall in Victoria - by months or seasons. The product of the average depth with the area of the corresponding area gives the volume of rainwater for that area and similarly for the others.
The sum of all these products divided by the total area of the state gives the required average rainfall in Victoria for the period indicated. The second question in (a) is dealt with using the water sheds and square degree divisions. Value derived from the square-degree normals (weighted average) By excluding older entries and using only those of the period.
Using only the records from 119 stations of the daily precipitation service (Table (9) Typical areas Map V.).
SS STRA /T
VICTORIA
MAP IV
SOUTH WA LES
BASS STRAIT
RAINFALL MAP OF
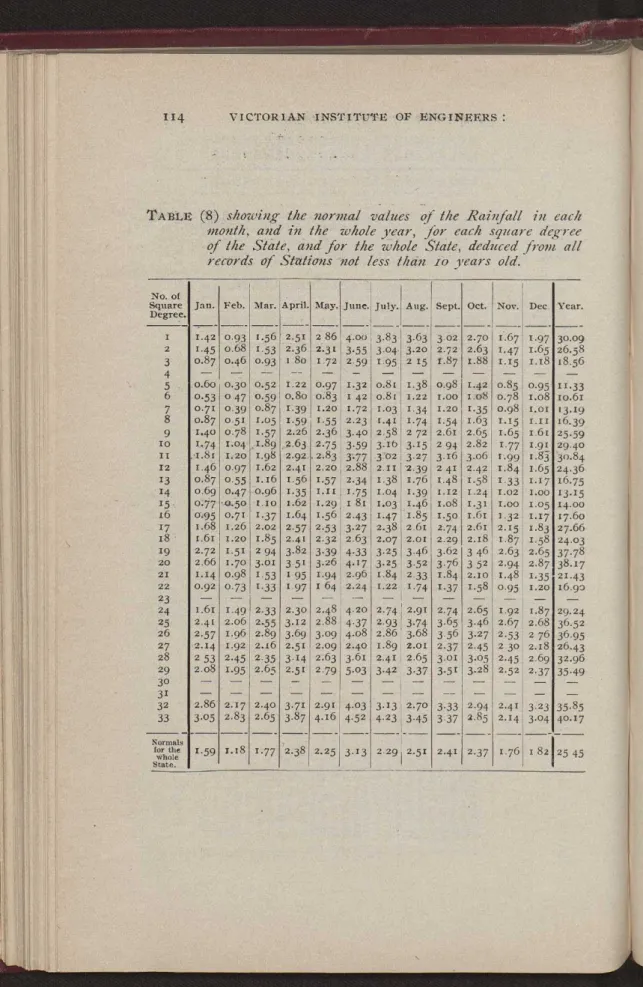
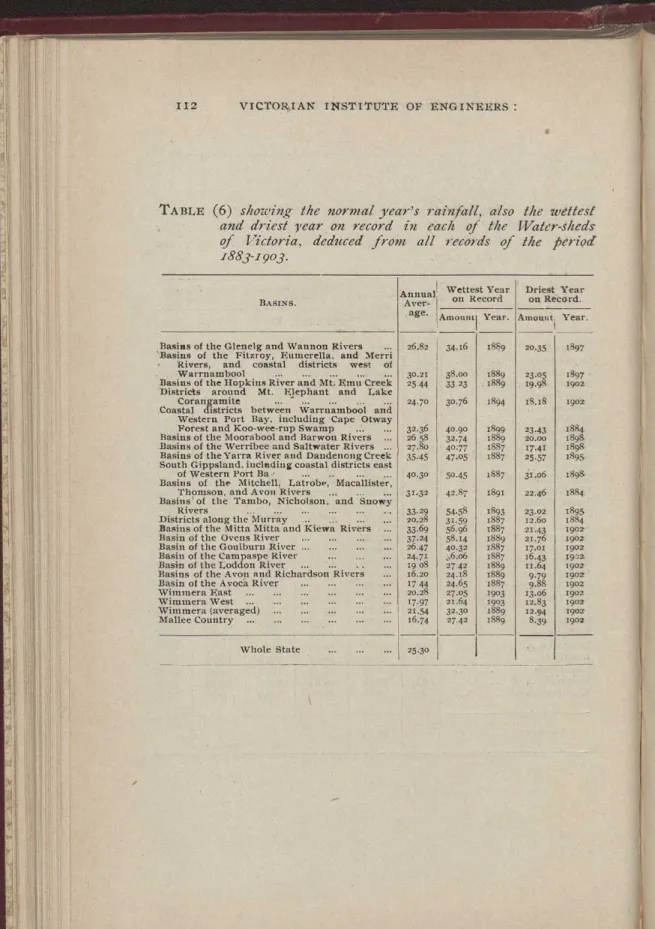
TABLE (6) showing the normal year's rainfall, including the wettest and driest years, on record in each of the Water Sheds of Victoria, derived from all records of the period 1883-1903. TABLE (8) showing the normal values of the Rainfall in each month, and in the whole year, for each square degree of the State, and for the whole State, derived from all records of Stations not less than ïò' years old. TABLE (9) 'showing the normal values of the Rainfall in each month, and in the whole year, for the subdivisions of the State shown in Map 1/. be shown, and for the whole State, derived from.
DISCUSSION
He had found that the water supply from Melbourne had met the demand without any difficulty during the year when they had the least rainfall. The other point of view from which the civil engineer had to look at the rainfall was floods and inundations. In connection with the subject of the maximum rainfall, the question of its distribution arose.
The civil engineer's duty in dealing with the rainfall was to know how far he should go in safeguarding against floods, and to what extent he should risk them. If he provided extra rainfall of this kind, he destroyed a place at the cost of the works he was doing, and if he did not make sufficient pro-. He had researched the subject of culverts for railways and roads, and found a great many inconsistencies.
In connection with the draining of the Koo-wee-rup and Moe swamps, the drains were constructed too small for maximum conditions, with the knowledge that natural erosion would enlarge them, and gradually became larger; but it happened that there were heavy rains;' and the canals overflowed to a .sow extent. It was useless to try to prevent such an experience as 17 inches of rain in an hour. Heavy records of 20 inches per day were reported from Sydney, which were somewhat severe.
Baracchi's maps of the Yarra valley he observed that the distribution of rainfall was very irregular. Baracchi to attend and give such information concerning the water supply, which was a matter of the greatest importance to civil engineers. Referring to heavy rains, he had had an experience of 17 inches of rain in twelve hours in Queensland.
As for Heathcote's record, he had passed through the area within a month of the occurrence and was certain that the rainfall had covered an area of at least four square miles. He had had occasion in his youth to hear the account of many old pioneers, who had personally seen the floods of that year, and had been pointed out to him the old signs of the flood; and if the same condition were to be repeated, many modern works and structures would be in considerable danger. He thanked the members for listening so carefully to the paper and hoped that the information would be valuable to them.
VISIT
Baracchi has done a public service in so conveniently summarizing the rainfall observations of the State that the main results can be seen almost at a glance. Thwaites, in his report, gives such a list, though many of the declines mentioned by him were almost so severe as to deserve separate notice. This will be better than the moving average with which rainfall in recent years has been estimated; and now that there are fifty years of reliable results to work with, such a normal value will be quite accurate.
Now, since the object of publishing the results of rainfall observations is for the information of those interested, I would like to express the opinion that these results lose a lot of their value by strictly following the calendar. The rainfall of the first two or three months of the calendar year is of little value to the country, as their data distort the later results: Take 0.1904, for example, there was unusually heavy rain in January and February, which caused the total to. 34; Perhaps it would be well if less note were taken of the year's total; for, look at that for the year 1891, which was only slightly above the average, and yet that was the year of the last great flood in the Yarra River.
The first would reflect the results because the sun is south of the equator; the latter would do the same if the sun was north of the sun. He states that the maximum rainfall in one day in the Bathurst district is almost one-eighth of the average annual rainfall. The maximum rainfall for one hour is almost one-fourth of the greatest daily rainfall.
34; The figures and formula are given to nearly correspond to what has been found to be safe practice: they are a little below the requirements of the flood of 1899 above the Malmsbury Dams." the most reliable rainfall statistics for Victoria that have been published. From this a cursory survey was made of all the strong falls that have occurred, and the slime of the results will be available in one of the.
At the time of that flood there were fourteen stations in the catchment of Parra and Dandenong Creek; whieh' occupied; it was "the space of six days, from five to ten and a quarter inches of rain. He had many times emphasized that the annual value of the rainfall was simply meaningless. It fell mostly in the months of March, April, September, and October , and hardly any fell during the other eight months of the year, so the farmers made money and at the same time complained about the severity of the drought.
But this was simply of the same order as the sunspot cycle and other cycles. They were the end of the monsoon rains, which could sometimes extend further south than their usual limit.