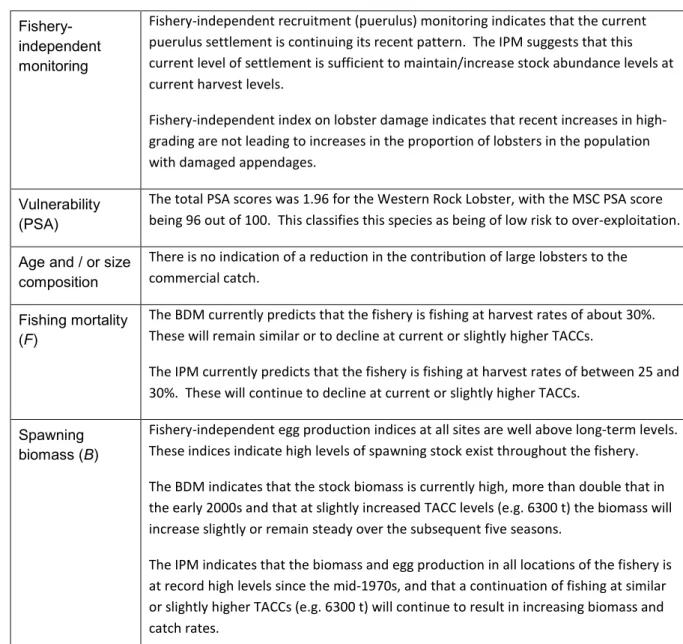
The Integrated Population Model (IPM) indicates that catch rates in all fishing locations will continue to increase as fishing continues at similar or slightly higher TACCs (eg 6300 t). The IPM currently predicts that the fishery is operating at catch rates between 25 and 30%.
List of Abbreviations
Scope 1
How the Department Operates 2
Aquatic Environment 3
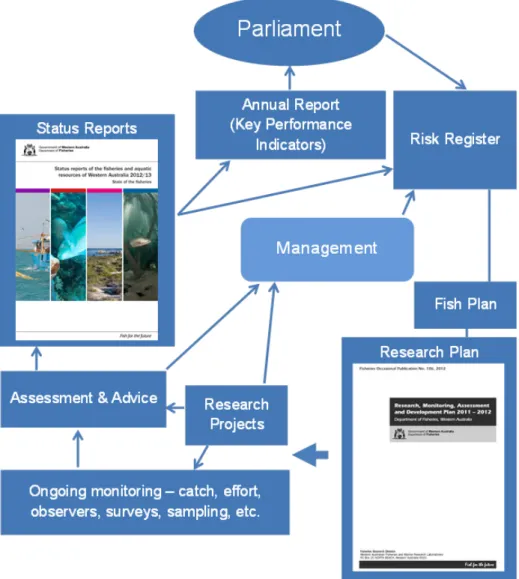
An overview of the risk-based planning cycle used to determine departmental priorities and activities.
Resource Description 4
Western Rock Lobster Resource
Selection of Indicator Species for Resource
Species Description 5
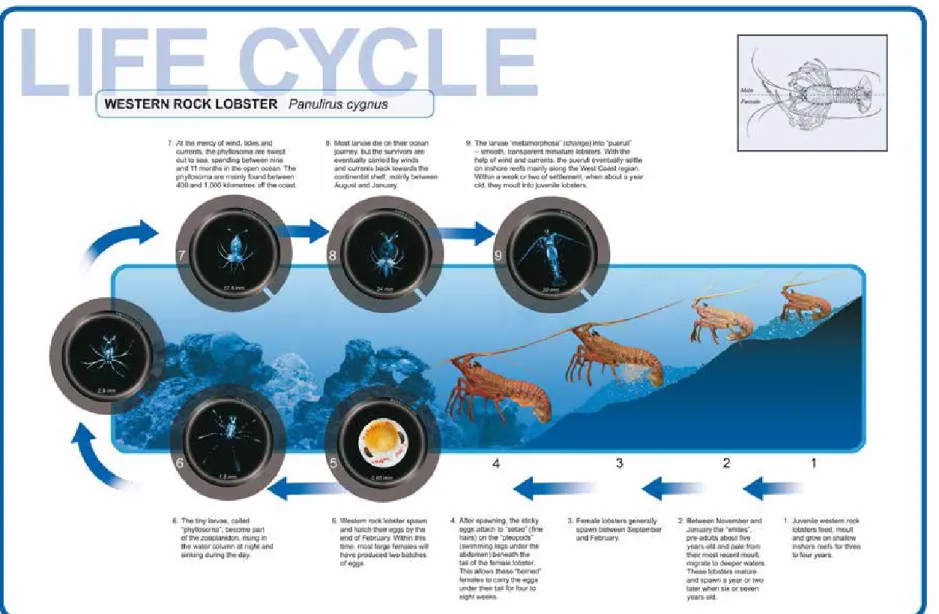
Western Rock Lobster (Panulirus cygnus)
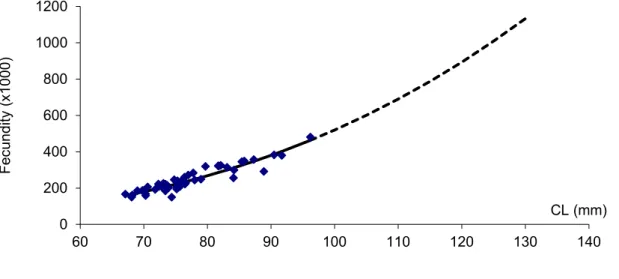
For detailed information on the aquatic environment of the western rock lobster source, please refer to Bellchambers et al. Work has shown that their inter-annual variation is related to water temperatures during the beginning of the spawning season (September and October) (de Lestang et al., 2014).
Fishery Information 6
- Fisheries / Sectors Capturing Resource
- West Coast Rock Lobster Managed Fishery
- Recreational / Charter Fishery History of Development
- Customary Fishing
- Illegal, Unreported or Unregulated Fishing
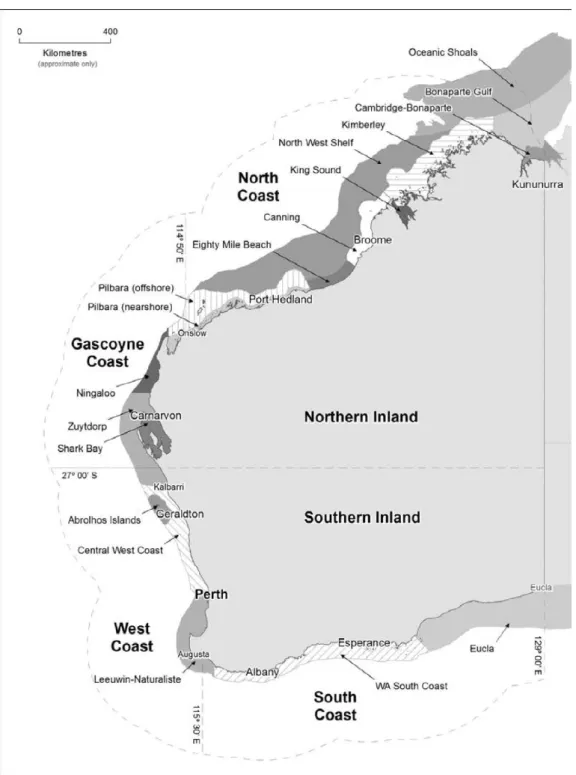
Most of the fishing effort is focused on western rock lobster and is concentrated on the coasts adjacent to Perth and Geraldton. These are largely aligned with the management zones, but differ slightly to better reflect the biology of the western rock lobster (Figure 6-4). Boundaries of the commercial West Coast Rock Lobster Managed Fishery (dashed lines) and the three management zones (A, B and C).
The northern 'Big Bank' part of the fishery is shown with the four breeding stock management areas. This activity takes place from coastal areas in shallow water out to the edge of the continental shelf (~200 m depth) with the only permitted method of capture using pots of either slat design made of wooden slats or plastic (Figure 6)-5a), or beehive pots made from sugar cane (Figure 6-5b). The TACC was set according to the maximum economic yield (MEY) with a TARC based on 5% of the upper limit of the MEY.
Such illegal activities in the early years of the fishery clearly compromised the integrity of the data reported by fishermen. This bias is believed to affect only the catch component of the monthly yield, not the fishing effort.
Fishery Management 7
Management System
In 2014 the Department introduced the Fishing Strategy and Control Rules (HSCR) for the fishery following extensive consultation with the Western Rock Lobster Council, wider industry stakeholders and Recfishwest. The HSCR is based on the sustainable management of the lobster stock according to the maximum economic yield (MEY). In 2013, an increase in interactions with migrating humpback whales led to the reduction of the fishery's export approval from a five-year exemption to a two-year wildlife trade operation.
These measures were developed in consultation with industry and relevant government agencies and included: limits on the amount of surface line, the number of surface floats and the length of line that fishermen could use when operating in deep-sea fishing areas. For full fishery management details, see the West Coast Rock Lobster Fishery Management Plan 2012. It is designed to ensure that all sectors that have access to the resource are considered in the management of the state's fisheries.
A core goal is to determine how to share the available fish resource among competing users while maintaining fish stocks at an ecologically sustainable level. The West Coast Rock Lobster Fishery was the first fishery in the state to go through the IFM process.
Harvest Strategy
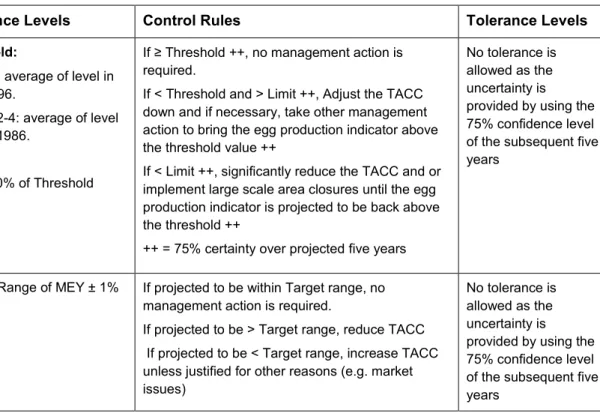
If the Sustainability Objective is not met in a BSMA, reduce the LPH in the relevant area or areas until the sustainability objective is met;. Summary of Performance Indicators, Reference Levels, Control Rules and Tolerance Levels for Western Rock Lobster in the West Coast Rock Lobster Fishery. If < Threshold and > Limit ++, Adjust TACC downward and if necessary, take other management actions to bring the egg production indicator above the threshold value.
If < Limit ++, significantly reduce the TACC and or implement large-scale area closures until the egg production indicator is expected to be back above the threshold. No tolerance is allowed as the uncertainty is provided by using the 75% confidence level for the trailing five years. Once the sustainability objective has been met, MEY should be used to determine an optimal selection of HRs.
If estimated > target range, reduce TACC. If forecast < target range, increase TACC unless justified by other reasons (eg market issues). No tolerance is allowed as uncertainty is provided using a 75% confidence level for the next five years.
External Influences
Information and Monitoring 8
Range of Information
Monitoring
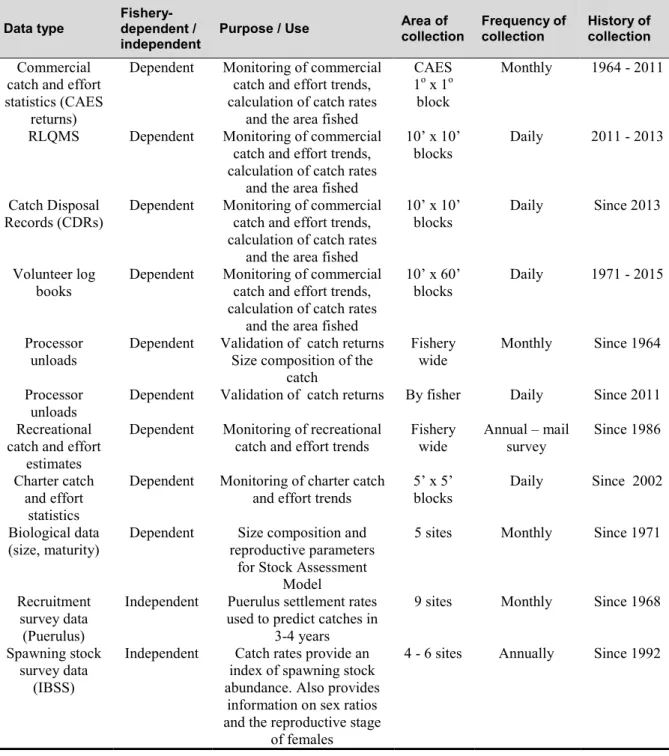
In 1949, a separate crayfish fisherman's return was introduced to provide more information about the fishery, including gear used and the weight of the catch. Since 1992, all aspects of reporting and the Catch and Effort Statistics (CAES) database have been the responsibility of the Ministry of Fisheries. The information collected provides the most accurate measure of the fishery's total catch.
Under the quota system, processors are also required to provide CDR declarations indicating the weight of the catch. All the data collected indicate that the majority of the settlement takes place in the shallow water (<20 fathoms). At each location, the surface water temperatures at the southern and northern ends of
Another index produced from the IBSS is the proportion of catches with damaged appendages (legs and antennae). Most of the data described below is collected from the Australian Government Bureau of Meteorology (BOM), CSIRO and NOAA.
Stock Assessment 9
Assessment Principles
Assessment Overview
Growth should be determined by estimating parameters in the model from tagging data [not completed]. Movement parameters, including northward movement, must be estimated from the tagging data included in the model [completed]. All of the changes suggested by the second assessment review team were incorporated into the model, with only the fourth point proving to be an unfeasible option; point four essential.
It was decided to perform all growth analysis outside the model and to include the parameter estimates and their uncertainty in the stock assessment model (see Section 9.3.14).
Analyses and Assessments Data Used in Assessment
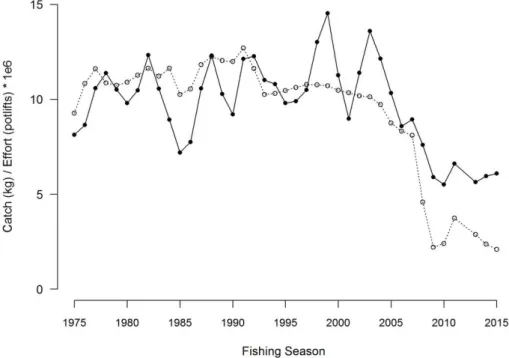
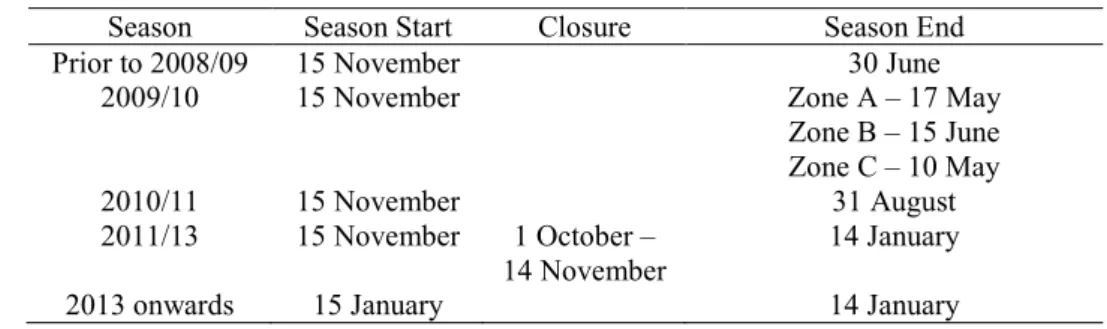
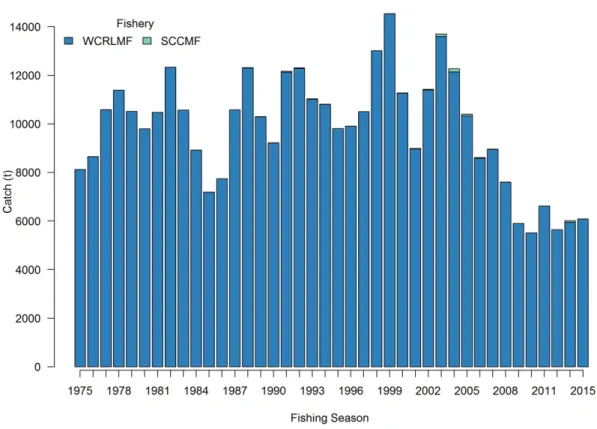
Since the 2013 fishing season, the fishery has operated for 12 months of the year, from January 15 to the following January 14. Standardized commercial catch rates show a similar overall pattern in all three fisheries, i.e. the proportion of lobsters damaged in the catch now appears to have leveled off at around 5% of the catch, well below peak levels in the of the 2000s (Figure 9-10).
The spawning population was not found to be significant in the assessment of the recent decline in puerulus. The recreational sector therefore has access to less than 30% of the distribution of this species (PSA score 2). All the attributes derived from changes in size composition by catch-curve analysis are incorporated into the size-structured integrated model (Section 9.3.14).
All attributes derived from this modeling framework are included in the size-structured integrated model (Section 9.3.14). The IBSS data span 24 years (1991 to 2015) and are representative of the six marine regions in the model. Most population dynamics model parameters are estimated by fitting the model to available data, although some are predetermined (Table 9-5).
As such, the indices are on a slightly different scale for much of the time series.
Stock Status Summary
Bioeconomic modeling suggests that the fishery would have to increase its quota if caught closer to the levels associated with the MEY. Monitoring of (puerulus) recruitment independent of fishing indicates that the current stocking of puerulus continues its recent pattern. There is no sign of a decline in the contribution of large lobsters to the commercial catch.
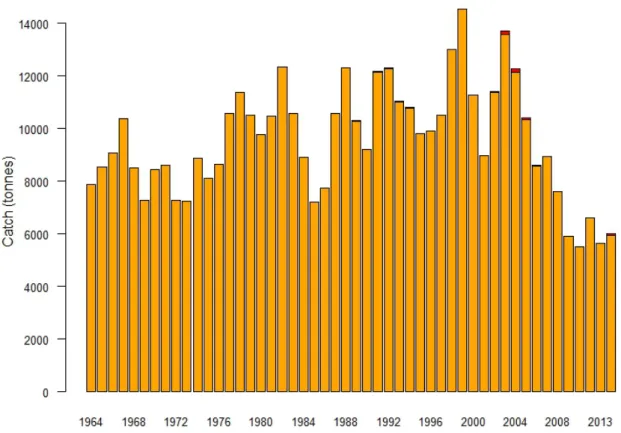
The BDM indicates that stock biomass is currently high, more than double that in the early 2000s, and that at slightly elevated TACC levels (e.g. 6300 t), biomass will increase slightly or remain stable over the next five seasons. The IPM indicates that biomass and egg production at all locations of the fishery has been at an all-time high since the mid-1970s and that continued fishing at similar or slightly higher TACCs (e.g. 6300 tonnes) will continue to result in increasing biomass and catch figures. C1 (Minimal Depletion – Above Target): L4 - Based on catch history, current catch rates, and model estimates and projections, the current level of stock depletion is highly likely.
C2 (Maximum Acceptable Depletion – Above Threshold): L2 - All lines of evidence indicate that the level of stock depletion is well below threshold levels. Work on stock productivity under high biomass levels and how this may relate to carrying capacity/density-dependent mortality is essential to implement the correct relationships in IPM.
Maximum economic yield from the western rock lobster fishery of Western Australia after moving from attempted to quota control. 2014 The orientation and migration dynamics of the western rock lobster, Panulirus cygnus, in Western Australia ICES Journal of Marine Science. Economic Research Associates (ERA) 2015 An analysis of the demand for Western Lobster A report prepared for the Western Australian Department of Fisheries.
2007 Growth and reproduction of painted lobster (Panulirus versicolor) on the Great Barrier Reef (Australia). Spatial and temporal changes in size at maturity of the lobster Panulirus cygnus George. Fishery-independent survey of the nesting stock and migration of spiny lobster (Panulirus cygnus).
Aspects of the population dynamics of the Western Lobster and their role in management. A semi-quantitative collector of the puerulus larvae of the western rock lobster Panulirus longipes cygnus (George) (Decapoda, Palinuridae).
Framework
Consequence, Probability and Risk Levels (based on AS 4360 / ISO 31000) considered in the Department's Risk Assessment. Not desirable; Continue with strong management actions OR new / further risk control measures to be introduced.
Productivity Susceptibility Analysis (PSA) Scoring Tables