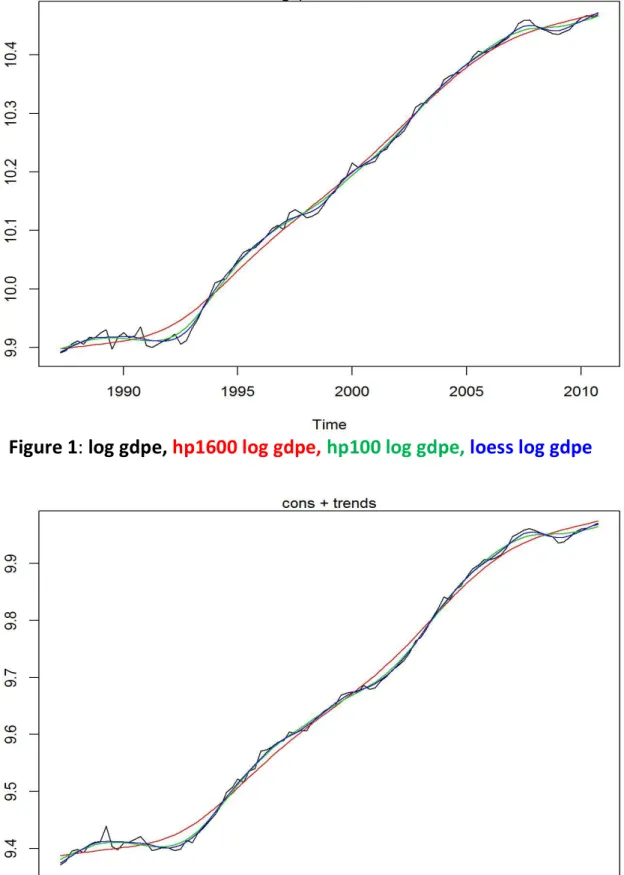
In this study, we have limited attention to the Hodrick-Prescott filter (Hodrick and Prescott, 1997), the loess filter (Cleveland et al., 1992), and simple moving average trend filters, all of which are linear filters of the general ones given above. form. Both are easy to understand and provide unambiguous trend estimates in the body of the sequence. In sections 3 and 4, we consider the relative advantages of the HP1600, HP100 and loess trend filter methods, in the context of their reliability versus smoothness.
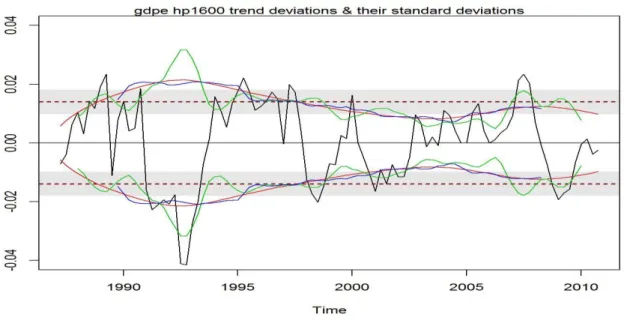
Any noticeable deviation of this quantity from the overall standard deviation dˆ is evidence of time-varying volatility. In the cases considered here, it was found to be sufficient to approximate the autocorrelation structure |dˆt | with a first-order autoregressive process. In addition to studying the time-varying volatility of trend deviations, it is interesting to produce estimates of the time-varying contemporaneous correlation between.
To construct an appropriate estimate of time-varying contemporaneous correlation, we first form the smoothed cross-products of the trend deviations given by . For the most part, this condition is met, especially in the body of the series and always for the centered ones. If the volatility of the trend deviations dˆ and t eˆ can be assumed to be constant, a t simple (and conventional) estimate of the overall contemporaneous correlation is given by
Specifically, the cyclical component of the candidate variable at time 𝑡 + 𝑘 (represented in Tables 1 and 3 by 𝑥𝑡+𝑘) is associated with the cyclical component of real GDP at time 𝑡 , for −5 ≤ 𝑘 ≤ 𝑘 .
Direct adjustment of “supply shock” observations
Therefore, before assessing the alternative trend paths associated with our HP1600, HP100, and Loess filters, we consider the extent to which the HP1600's key real business facts may have been sensitive to this supply shock associated with what is becoming the 1992 power crisis. named.
Alternative trend filters
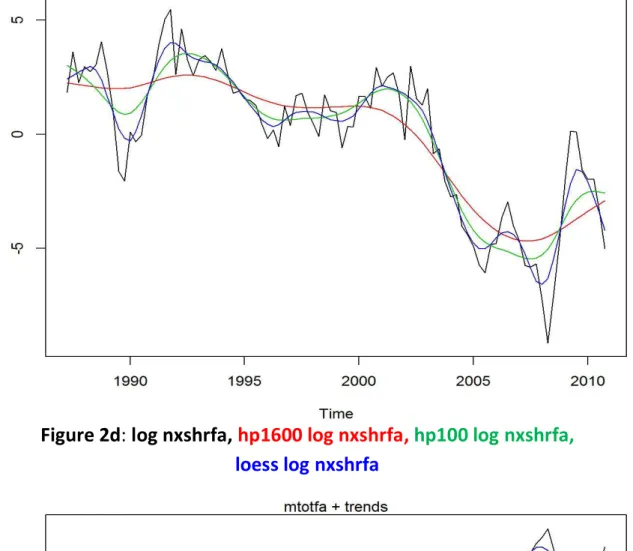
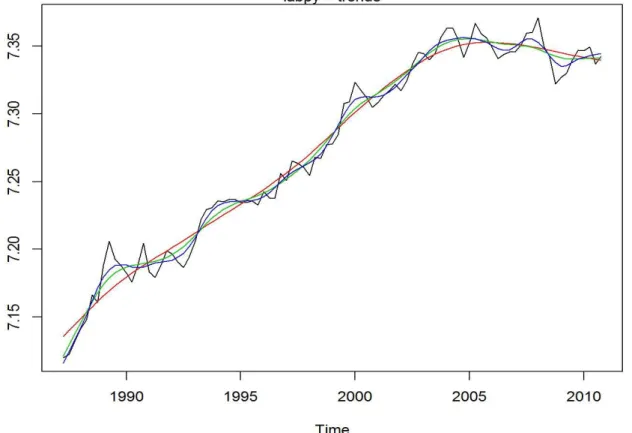
- Trends for variables other than real gdpe
- Differences for volatility
- Differences for persistence
- Differences for cross correlations
It is also clear from the trend movements for gdpe and these other variables that the HP100 and loess filtered variables follow each other much more closely than those of an HP1600 filter. Given the above evidence on fidelity versus smoothness, it is not surprising that the sample volatilities for all variables are largest for HP1600-filtered variables and smallest for those loess-filtered. Again, not surprisingly, persistence is consistently higher for all HP1600 filtered variables, relative to persistence for the corresponding HP100 and loess filtered variables (Table 2)9.
More surprising, however, is the extent to which there is significantly less persistence in loess-filtered variables than their HP100-filtered counterparts. This is related to the slightly more pronounced smoothness of the HP100 trends compared to that of loess-filtered variables. 9 Because our HP1600 volatilities and our persistence values are greater than those for our HP100 filtered variables, this is consistent with the results of Hodrick and Prescott (1997, Tables 1 and Appendix Table A1), which show that for the US economy
Then, for a third small group of variables, real TWI, CPI and its tradable and non-tradable components, and real M3, the signs, lag lengths, and statistical significance for HP100 and loess-filtered variables are such that the cross-correlations of these two variables filters are not robust enough. 10 Note, however, that the cross-correlations for non-residential investments are not statistically significant at the 5% level for HP100- and loess-filtered variables (Table 3).
On the variability over time of volatilities
On the variability over time of cross correlations
From the three panels for each variable, we first consider movements over time around trend-filtered time-varying maximum cross-correlations. For example, the sample period contemporaneous cross-correlation for private consumption is 0.75 for HP1600 filtered data, 0.58 for the HP100 series and 0.43 for the loess series (Table 3), and the movements over time for these and their underlying standardized trend-deviation cross-products are represented in Figure 4a for each of our three moving average methods. For all three of our simultaneously correlated variables, and as was the case for our moving volatility, the HP1600 and the 21 quarter moving average method provide the smoothest paths and the seven point triangular moving average method produces a path closest to that of the volatile cross - product observations.
For example, again for private consumption, the lowest cross-correlation from the HP1600 smoothing occurs around 1999 for the filtered HP1600 series, but around 1995 for the HP100 and the log-filtered series. Similarly, while the lowest cross-correlation from the seven-point moving average is around 1994 for the HP100 and wood data, the lowest for the HP1600 data is near 1998/9914. Second, more specifically in the endpoint context, while adopting seven-point triangular moving averages results in the loss of three observations at the end of each run relative to observations generated by HP1600 smoothing, it provides better guidance on movement in cross-correlations. in shorter time intervals.
14 As was the case for the variability of volatilities over time, it is important to note here the periods when the greatest and least cross-correlations go beyond the plus and minus two bounds of the standard deviation, when assuming that there are constant cross-correlations. However, the more general points made above for simultaneous variables remain valid for variables that have credible non-concurrent largest cross-correlations. These points are that: the HP1600 filter and the 21-quarter uniform moving average method produce similar smooth paths and therefore provide useful evidence for medium-term time intervals; seven-point triangular moving averaging reflects cross-product movements better than the other two averaging processes, and therefore contributes the most useful information for movements over a shorter time horizon; the moving average paths for HP100 and loess-filtered series are similar and may yield highs and lows for cross-correlations slightly different from those of HP1600-filtered series.
Second, in evaluating volatility and cross-correlation movements over time, our evidence comes from evaluating the relative advantages of 21-quarter uniform and seven-point triangular moving average methods, and from an HP1600 filter. The results for volatility, persistence and cross-correlations from the adjusted series were not sufficiently different from those for the unadjusted series to question the property of HP1600-based “real variable regularity”. The largest cross-correlations observed for the HP1600-filtered series will also generally be higher than those for the HP100 and loess-filtered series.
For variables whose largest cross-correlation with real gdpe is noncontemporaneous and which were determined to be statistically significant for HP1600 cross-correlations in McKH, not all relationships remained robust in sign, statistical significance, and/or largest cross-correlation lag when HP100 and loess-filtered cross-correlations was calculated. Within this category, sign robustness, statistical significance and largest cross-correlation lag length are maintained for real government consumption expenditure, net export share (through movements in its real import component); real 90-day interest rates and real labor costs. This evidence provides valuable insight into the growth and decline over time of volatilities and cross-correlations and also identifies periods when volatilities and cross-correlations have exceeded two standard deviation bounds.
On endpoint issues, evaluated in the context of movements over time in volatilities and largest cross-correlations, continued use of traditionally used 21-quarter uniform (or similar) moving averages provides less valuable information than either an HP1600 filter or a seven-point triangular moving average. This means, especially if one's primary interest is in short-term moving average volatilities and cross-correlations, that the use of seven-point triangular moving averages may provide the best value. Notes: Figures in parentheses for volatility, persistence and cross-correlations are robustly estimated standard errors Relative volatility is relative to GDP (expenditure) volatility; persistence is represented by first-order serial correlation Maximum bivariate cross-correlations are simultaneous, except for employment, which is at xt+2.
The series not adjusted in this way show slightly weaker (or relatively similar) cross-correlations with real GDP.