Archived at the Flinders Academic Commons:
http://dspace.flinders.edu.au/dspace/
‘This is the peer reviewed version of the following article:
Shiri, Y., Solouki, M., Ebrahimie, E., Emamjomeh, A., &
Zahiri, J. (2018). Unraveling the transcriptional complexity of compactness in sistan grape cluster. Plant Science, 270, 198–208. https://doi.org/10.1016/j.plantsci.2018.02.011 which has been published in final form at
http://dx.doi.org/10.1016/j.plantsci.2018.02.011
© 2018 Elsevier. This manuscript version is made available under the CC-BY-NC-ND 4.0 license:
http://creativecommons.org/licenses/by-nc-nd/4.0/
Accepted Manuscript
Title: Unraveling the Transcriptional Complexity of Compactness in Sistan Grape Cluster
Authors: Yasoub Shiri, Mahmood Solouki, Esmaeil Ebrahimie, Abbasali Emamjomeh, Javad Zahiri
PII: S0168-9452(17)30946-9
DOI: https://doi.org/10.1016/j.plantsci.2018.02.011
Reference: PSL 9754
To appear in: Plant Science Received date: 14-10-2017 Revised date: 6-2-2018 Accepted date: 10-2-2018
Please cite this article as: Yasoub Shiri, Mahmood Solouki, Esmaeil Ebrahimie, Abbasali Emamjomeh, Javad Zahiri, Unraveling the Transcriptional Complexity of Compactness in Sistan Grape Cluster, Plant Science https://doi.org/10.1016/j.plantsci.2018.02.011
This is a PDF file of an unedited manuscript that has been accepted for publication.
As a service to our customers we are providing this early version of the manuscript.
The manuscript will undergo copyediting, typesetting, and review of the resulting proof before it is published in its final form. Please note that during the production process errors may be discovered which could affect the content, and all legal disclaimers that apply to the journal pertain.
Unraveling the Transcriptional Complexity of Compactness in Sistan Grape Cluster
Yasoub Shiri1, Mahmood Solouki2*, Esmaeil Ebrahimie3,4,5,6, Abbasali Emamjomeh2, Javad Zahiri7
1) PhD student of biotechnology, Department of Plant Breeding and Biotechnology (PBB), Faculty of Agriculture, University of Zabol, Zabol, Iran
2) Laboratory of Computational Biotechnology and Bioinformatics (CBB), Department of Plant Breeding and Biotechnology (PBB), Faculty of Agriculture, University of Zabol, Zabol, Iran
3) School of Medicine, The University of Adelaide, SA, Australia
4) School of Information Technology and Mathematical Sciences, Division of Information Technology, Engineering and the Environment, University of South Australia, Adelaide, Australia
5) Institute of Biotechnology, Shiraz University, Shiraz, Iran
6) School of Biological Sciences, Faculty of Science and Engineering, Flinders University, Adelaide, Australia 7) Bioinformatics and Computational Omics Lab (BioCOOL), Department of Biophysics, Faculty of Biological Sciences,
Tarbiat Modares University, Tehran, Iran
*) Corresponding Author: [email protected] Cell: +98 912 109 78 26
Graphical abstract
ACCEPTED MANUSCRIPT
Highlights
The smHSPs family proteins are important in resistance to heat and dry weather in Yaghooti grape of Sistan.
The AGAMOUS is a key gene in compactness of the Yaghooti grape clusters because of its influence on GA (gibberellin hormone) gene expression.
When the harvesting time of clusters is near, nucleus, cytoplasmic, cytosol, membrane and chloroplast genes activity are decreased and endoplasmic reticulum, vacuole and extracellular region genes activity are increased in cluster peduncle and pedicels.
Abstract
Yaghooti grape of Sistan is the earliest ripening grape in Iran, harvested every May annually.
It is adapted to dry conditions in Sistan region and its water requirement is less than the other grape cultivars. The transcriptional complexity of this grape was studied in three stages of cluster development. Totally, 24121 genes were expressed in different cluster development steps (step 1: cluster formation, step 2: berry formation, step 3: final size of cluster) of which 3040 genes in the first stage, 2381 genes in the second stage and 2400 genes in the third stage showed a significant increase in expression. GO analysis showed that when the clusters are ripening, the activity of the nucleus, cytoplasmic, cytosol, membrane and chloroplast genes in the cluster architecture cells decreases. In contrast, the activity of the endoplasmic reticulum, vacuole and extracellular region genes enhances. When Yaghooti grape is growing and developing, some of metabolic pathways were activated in the response to biotic and abiotic stresses. Gene co-expression network reconstruction showed that AGAMOUS is a key gene in compactness of Sistan grape cluster, because it influences on expression of GA gene which leads to increase cluster length and berries size.
Key Words: Transcriptome, Co-expression Network, Gene Ontology, RNA-Sequencing,
Introduction
Yaghooti grape of Sistan is the earliest ripening grape in Iran, which is harvested every May annually. It is 45 days since the formation of the first clusters in early part of April until its harvesting time. The features of Sistan Yaghooti grape are an average number of 230 berries in a cluster and weight equal to 230 grams. Each berry contains 22% of soluble solids, its tail, volume and weight of each single berry are 6 millimeters, 0.9 cc and 1 gram, respectively [1].
Yaghooti grape is compatible to dry conditions in Sistan region and its water requirement is less than other grape cultivars. It is offered for fresh eating due to seedless and its desirable taste. The compact clusters of Yaghooti grape prevent the increase in the size of berries. The cluster compactness in addition to reducing its desirability marketing, leads to sensitive against bunch rot disease [2]. Therefore, cluster compactness is an undesirable trait in Sistan
ACCEPTED MANUSCRIPT
Yaghooti grape. The RNA sequencing (RNA-Seq) technique was applied for transcriptomic analysis to study the cluster development process in Sistan Yaghooti grape. It is necessary to study transcriptome for interpretation of genomic functional elements and detection of molecular components of cells and tissues. It also can be useful to understand developmental and diseases processes. A gene can have several different functions and, at the same time, to be active in several metabolic pathways. Moreover, a gene can reduce or increase expression of other genes either directly or indirectly. Total of these connections reconstruct plant's gene network, and its understanding can be very valuable. The study of one or more genes alone does not provide a comprehensive view of biological processes in living cells. RNA-Seq has provided possibility of high-throughput analysis of whole transcriptome and their related biological processes. So far, very limited number of different studies have been conducted to investigate grape transcriptome by RNA-Seq. It seems that these three studies represent all of previously relevant studies about transcriptomic analysis of grape using this technique. In a study, it was produced more than 59 million sequence reads, 36 to 44 bp in length, related to three developmental steps of grape berry: post setting, ve´raison, and ripening. Of these, 17,324 genes were expressed during berry development, 6,695 of which were expressed in a stage-specific manner, suggesting differences in expression for genes in numerous functional categories and a significant transcriptional complexity [3]. In another study, to detect main pathways involved in the stenospermocarpy of grape, comprehensive transcriptomic and metabolomics analysis was conducted specifically targeting the early phase of berry formation in 'Seedless Thompson 'cultivar of grape. The results indicated that there are 496 differentially expressed genes and 28 differently metabolic pathways in this process. Their data showed broad transcriptome reprogramming of molecule transporters, globally down- regulating gene expression, and suggest that regulation of sugar- and hormone-mediated pathways determines the downstream activation of berry development [4]. Also, the role of gibberellin treatment has been investigated on gene expression changes of grape berries. Pair- wise comparisons of (Gibberellin A3) GA3-treated and control samples detected 165, 444, 463 genes in 1, 3, and 7 days after GA3 treatment, respectively, with over two-fold change as expression. The number of differentially expressed genes was increased in different times after GA3 treatment, and the differential expression was dominated by down regulation. The temporal gene-expression patterns of cell-wall-modification enzymes, cytoskeleton and membrane components and transporters revealed a pivotal role for cell-wall-relaxation genes in GA3-induced berry enlargement [5].
Despite many studies on identifying genes that control growth and development of berries, there is a little information available about the process of cluster formation. The cluster formation process has a direct effect on the quality and quantity of berries. Therefore, the results of this research can be employed in producing grapes with low cluster compactness where low cluster compactness increases marketability and reduces the disease damage. On the other hand, identifying the genes involved in the cluster formation process by RNA-Seq technology provides new insights for unravelling the complexity of compactness in grape cluster.
Materials and Methods Plant material
ACCEPTED MANUSCRIPT
The used plant material to extract whole RNA, was Sistan red Yaghooti grape (Vitis vinifera L.) from the grape gardens of the Agricultural Research Institute in University of Zabol, Iran (UOZ). These gardens have been planted using seedlings obtained through tissue culture, so they are clones and identical in terms of all their traits. The clusters samplings were carried out in three stages:
- The first stage, cluster formation time (Sample-1): when the approximate size of clusters were about 5 cm and the flowers had not been opened.
- The second stage, berry formation time (Sample-2): two weeks after the first sampling, when about 70% of the berries had been formed and the approximate size of clusters were about 15 centimeters.
- The third stage, final size of cluster time (Sample-3): two weeks after the second sampling, when the berries had reached about 70% of their final size.
Berries were removed to extract the RNA from cluster architecture (peduncle and pedicels).
Extraction of RNA and RT-qPCR analysis
RNA was extracted from the clusters of grape by Japelaghi method [6]. To control quality and quantity for the extracted RNAs, it was used 2100 Bioanalyzer (or 2200 TapeStation) with an RNA Integrity Number (RIN) value greater than or equal to seven. Ultimately, the high quality and quantity RNA samples were sent for sequencing to the South Korean Macrogen Company.
Total RNA (1 μg) was used for cDNA synthesis using Vivantis 2-Step RT-qPCR kit according to the manufacturer’s instruction. Two primers (TCGAGATCAAGCGGATCGAA, GGGCTACCTCTGCATCACAT forward and reverse primers, respectively) were designed based on AGAMOUS sequence (Table. S1). Tubulin gene (CTCCTTGAGCTAGTCGTCGC, AACAAGGCAAAAACATTCCG forward and reverse primers, respectively) was used as the reference gene. The RT-qPCR reactions were accomplished on a Research RG-3000 (Corbett) using 2X Taq Master Mix PCR (CinaGene, Iran). These reactions were in 20 μl volume [containing 1 μl cDNA reaction mixture, 6 μl Master mix (Eva Green), and 1 μl of each primer]. The reaction conditions were determined according to recommended protocol by the manufacturer (5 min at 95°C, 40 cycles consisted of 95 °C for 30 s, 57°C for 30 s, 72°C for 30 s, and finally 10 min 72°C). All RT-qPCR reactions were performed in three technical and biological repeats. Finally, relative expression levels were calculated by Ct values using the formula 2–ΔΔCT [7].
Mapping and analyzing of raw data
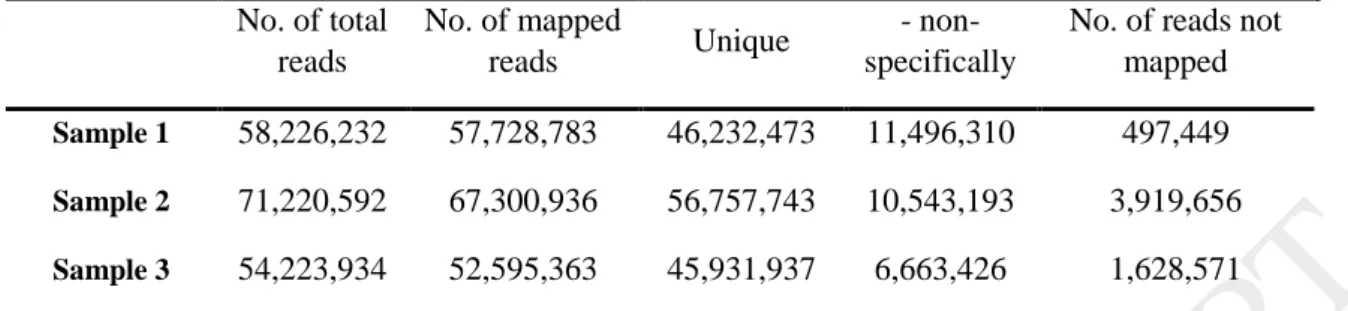
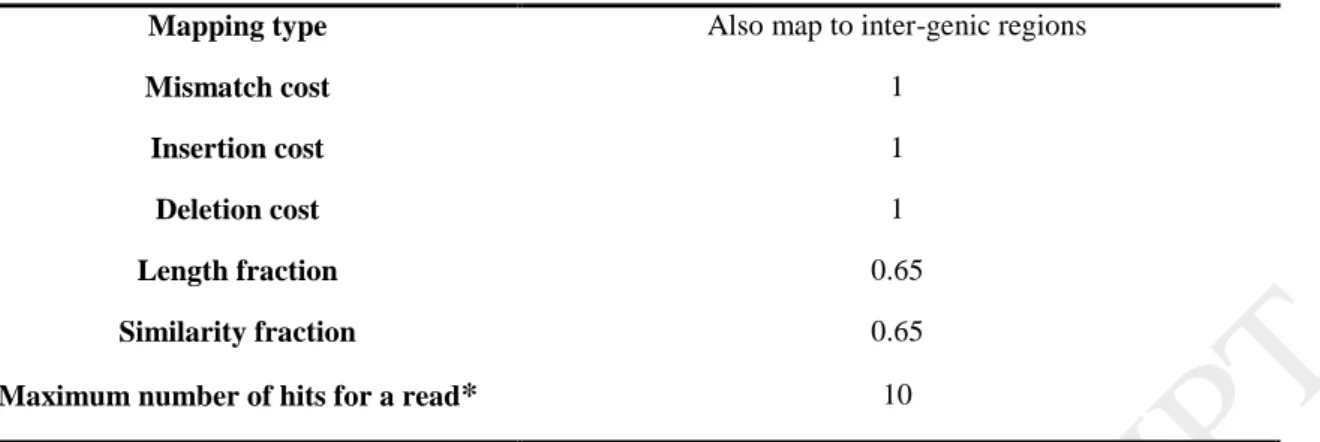
A total of 188663428 sequences reads with 101 bp in length were produced from three stages of development of the clusters (Table 1). Each stage with approximately 60 million reads was pre-processed (Trimming, normalizing [8], statistical analysis [9], and removing low quality reads) using CLC Genomics Workbench 9.5.3 software; then they were mapped onto the 12- fold draft sequence of the Pinot Noir 40024 reference genome [10-16], using CLC read Mapper with MEM (Measurement Error Model) approach [17]. The mapping parameters have been shown (Table 2). Mapping was made for genes, transcripts and intergenic regions.
P-value for each gene was calculated using Z-test. The Z test or the Kal test compares a single sample against another single sample, and thus requires that each group in your
ACCEPTED MANUSCRIPT
experiment has only one sample [9]. The fold-change threshold and the minimum expression value to select differentially expressed genes were equal to 10 and 2000 copies (p- value<0.01), respectively. The analysis steps, tools and methods have been categorized (Table 3).
Reconstruction of network and network topology
Functional protein interaction networks were reconstructed and visualized for up regulated and down regulated genes, separately, using STRING web service [18] and Cytoscape v.3.4.0 software [19] (NetworkAnalyzer 2.7 plugin [20]), respectively. Cytoscape BiNGO v.3.0.3 plugin [21], Hypergeometric test [22], Benjamini-Hochberg False Discovery Rate (FDR) correction [23], and p-value< 0.05 were used to analyze Gene Ontology (GO) terms.
Topological features, including betweenness and closeness centrality were computed for two reconstructed networks by Cytoscape software [24]. An entity centrality of a complex network is named by betweenness centrality. It is calculated based on all shortest edges pairs in a network. On the other hand, the closeness centrality is defined by the shortest distance mean from one node to all other nodes [25]. In the other words, the higher closeness and betweeness centrality for each node, indicate higher connections (edges) and possible importance of the node that connects different sub-networks. In addition, the regulatory network were reconstructed using Plant Pathway Studio 11.
Results and discussion
A total of 24121 genes were expressed simultaneously during the growth of the clusters, of which 3040 genes in the first stage, 2381 genes in the second stage, and 2400 genes in the third stage had a significant increment expression (Fig. 1). More than 2,000 genes exhibited 10-fold change increase in gene expression. In average, 96% of reads were aligned with the reference genome. Based on distribution of sequence reads on the reference genome, a total of 35.96% and 42.97% of the reads were aligned on the gene regions and inter-genic regions, respectively (Table 4). Finally, 93, 92 and 55 genes were selected from the up regulated genes at Sample-1, Sample-2 and Sample-3 respectively (Table 5) (Supplementary file. 1).
GO-Molecular function analysis
The selected genes were studied using the information, provided in UniProt (http://www.uniprot.org) [26] and Ensembl (http://plants.ensembl.org) [27, 28] databases.
Then, we selected the molecular functions that were enriched with differentially selected genes (Fig. 2a) (Fig. S4). Themetal ion binding had the highest number of genes ( 33 genes)s (p-value = 5.7190E-1 as 17, 4 and 12 metal ion binding genes were up regulated at the first, second and third stage of cluster development, respectively. Oxidoreductase and magnesium ion binding genes were down regulated when the clusters were growing. Because of the importance of magnesium ion in photosynthesis and involvement of electron transfer enzymes in this process, the gradual reduction of expression of these genes can be related to gradual reduction of photosynthesis in cluster architecture cells. When the berries are growing, the cluster architecture become woody and there is only a narrow canal to transfer nutrients to the berries. It should be mentioned that the photosynthesis in the cluster architecture, despite being negligible compared to the leaves, plays a significant role in the amount of accumulated nutrients in the berries because of the closer distance to the berries.
Also, we observed a higher number of ATP-binding proteins when the clusters grows and develops (Fig. 2a, (p-value = 8.5834E-1). Interestingly, ATP-binding genes were up
ACCEPTED MANUSCRIPT
regulated at the third stage. As the clusters enlarges in size (the first and the second stage), 22 genes were up regulated. These genes are selectively and non-covalently are linked to ATPs, which is an important regulator for coenzymes and enzymes. When the clusters are growing, the number of cells increases and different phonological processes progresses such as flowering, berry formation, and ripening. Increasing of ATP-binding genes expression may indicate the high ATP-cell requirement. This is due to the fact that cell needs energy and ATP supply to carry out this processes.
Decreasing number of genes with transferase activity (p-value = 1.4862E-1) was also observed during the cluster growth. The transferases are a large group of enzymes that catalyze the transfer of functional agents such as methyl or phosphate from one molecule to another molecule. One of 12 transferase genes, which is up regulated in the first stage (with more than 124 fold change) is UFGT (Anthocyanidin 3-O-glucosyltransferase), which is involved in accumulation of anthocyanin pigmentations along with other essential factors during glycosylation [29]. Although there are many reports about the features and expression level change of UFGT in different processes, but there is no clear image for the role of its product. Certainly, this enzyme plays a key role in Yaghooti berries color. It is interesting that its expression alteration occurs in the early stages of cluster development, when the berries have not yet been formed.
GO-Biological process analysis
Identification of biological processes provides a more comprehensive understanding about the role of differentially expressed genes in cluster development. Biological processes that are enriched with differentially expressed genes are of high importance (Fig. 2b) (Fig. S5).
The highest number of genes (32 genes with p-value = 4.0802E-1) was related to oxidation- reduction process where 17, 1 and 14 genes were up regulated at Sample-1 Sample-2 and Sample-3, respectively. The most anabolic reactions of the cluster architecture happen in the earliest stages of development, and the clusters achieve final size in a short period of time.
Therefore, final process of ripening occurs in the berries. Consequently, genes involved in anabolic pathways have the highest activity at the earlier stages of cluster development, and then their expression reduces after achieving the final size of clusters.
As the clusters were growing, the expression of stress response genes were significantly increased. The most of the plant's energy is directly spent for anabolic reactions because of high cell division in the early stages of cluster development. After increasing the size of the clusters, the anabolic reactions were gradually reduced and the other reactions were increased such as response to environmental stresses. In other words, the plant has spent all of its energy for cell divisions and organogenesis. However, after clusters and berries formation, the next step is to protect the plant against biotic and abiotic stresses. In the final stages of cluster growing, which coincides with ripening the berries, the plant consumes its entire energy to carry out reactions related to the ripening of the berry. On the other hand, due to the construction of cell wall and acquisition of physical resistance against biotic and abiotic stresses, the expression of plant defensive genes reduces. For this reason, genes involving in construction of cell wall were up regulated but lipids metabolism and fatty acid biosynthesis genes which play a key role in cell membrane were down regulated.
GO-Cellular component analysis
During clusters development, we observed that the genes related to nucleus, cytoplasmic, cytosol, membrane and chloroplast activity were decreased. In contrast, the genes linked to
ACCEPTED MANUSCRIPT
endoplasmic reticulum, vacuole and extracellular region genes activity were increased (Fig.
2c) (Fig. S6). In the final stages of cluster development, the location of metabolic activities alters form cytoplasm to extracellular region, due to reducing in cell divisions and increasing in export of different products from cell. Moreover, it should be noted that chloroplastic and mitochondrial activities were decreased and increased, respectively, during first and second stage of cluster development. This is due to the reduction of photosynthesis in cluster architecture cells and increment of metabolism in cytoplasm. Finally, activity of cell organelles were decreased at third stage of cluster development.
Protein Family analysis
The protein family and domain analysis for differentially expressed genes appeared a highlight in relation to cluster development process in Sistan's Yaghooti grape. Small heat shock family (HSP20) (short-term, smHSPs) proteins were up regulated significantly during the cluster development (Fig. 3). Whereas, this protein family showed a little expression in the earliest stages of cluster development. It can be related to the warm and dry conditions in Sistan region at the final stages of cluster development. In general, smHSPs are expressed in response to heat stress. It is interesting that the peak of expression for these genes was related to the second stages of sampling. There is a high rate of cell division at the first stage of cluster development and the amount of cell proteins is less than the other stages. On the other hand, the second stage is the most active stage in cluster development and cell have a lot of proteins that would be damaged by heat. It also clear that the weather temperature is gradually increasing in spring, so the need for smHSPs would be higher as well. The smHSPs are found in all living organisms, but they are more abundant and variable in plants. Their molecular weight is variable in 17-30 kDa and they have a conserved C-terminal domain in all eukaryotes [30]. The smHSPs are coded by six nuclear gene families in vascular plants.
Each gene family encodes proteins which are found in different cell organelles such as cytosol, chloroplast, endoplasmic reticulum, and mitochondrion. Although smHSPs have not any basic role in main cellular functions, but it seems that these proteins such as HSP70, HSP60 and HSP90, as heat shock proteins with high molecular weight, are important for survival and tolerance to heat stress in plants. The biochemical analysis indicated that smHSPs are in high molecular weight protein complexes (200-400 kDa) which has been likely consisted of several smHSPs subunits. The smHSPs work as molecular guards that link relative denatured proteins and prevent their inactivation helping the plant to tolerate heat [30].
Reconstruction of gene co-expression network
The gene co-expression network was reconstructed for all differential expressed genes (Fig.
4a), down regulated genes (Fig. 4b), and up regulated genes (Fig. 4c), separately, during the cluster development process. The highest number of directed edges between different genes were related to BRI1 (38 edges), PSBO1 (23 edges), AT3G09440 (22 edges), and MPK3, STZ, PSBO2, PETE1, HSP90.1 and DRT112 (21 edges for each gene) (Fig. 4a). The betweenness and closeness centrality for each node are presented by gradient size and color-coding system, respectively. The BRI1 (0.0175), MPK3 (0.0068), TT4 (0.00623), LHCB2.3 (0.0047), TT5 (0.0045), SHD (0.0041), AG (0.0030) and CCA1 (0.0030) genes had the highest betweenness centrality. The highest closeness centrality belonged to 42 genes such as CAB1, ABCG11, STZ, DRT100, UGT72E1, HSP70-18, and SEP3 genes (Supplementary file. 2).
ACCEPTED MANUSCRIPT
BRI1 gene as a hub node is necessary for plant growth and development [31]. The product of this gene is one of brassinosteroids (BRs), a group of small-molecule hormones. These molecules are bound to a small family of leucine-rich repeat receptor kinases at the cell surface; thereby initiating an intracellular signal transduction cascade which leads to expression modification in hundreds of genes [32, 33]. For example, BRI1 regulates the expression of light- and stress-response, promotion of cell elongation, normal leaf and chloroplast senescence, and flowering genes [34]. The LHCB2.3, RBCS1A, PETE1, PSBO2, CAB1, and PSAH2 as chloroplastic genes are involved in photosynthesis [35, 36]. Down regulation for these chloroplastic genes is an evidence for reduction of photosynthesis in the cluster peduncle and pedicels cells.
The Sep3 gene is another important gene which is involved in differentiation of flower parts during flowering. It also plays a key role in differentiation of meristem [37, 38]. The recent studies have shown that SHP1, SHP2 (SHATTERPROOF) and AGL15 genes are controlled by AGAMOUS gene. The two SHP1 and SHP2 genes contain MADS-box domain. They works for ovarian shell specific differentiation so that mutation leads to defection in seeds shell and reduction in seed number and mucilage [39].
The STZ (Salt Tolerance Zinc finger) gene has high connectivity, betweenness centrality and closeness centrality (21, 0.0018, and 1), respectively. STZ is one member of plant transcription factors family which modulates the defense response of plants to abiotic stress [40-43]. The STZ regulates AT3G09440 or HSP70s, and HSP70s genes in cooperation with other chaperones; it works as molecular guard that is connected to related denatured proteins and prevents their inactivation; this leads to heat tolerance by plant [30].
As illustrated in the gene co-expression network for down regulated genes (Fig. 4b), the highest number of directed edges is related to AT1G63700, XPL1, and PMEAMT (19 edges for each gene), AG (8 edges), and JAZ7, CYP86C4, CYP86C3, and CYP86C2 (7 edges for each gene). The JAZ7, MYB57, AG, SHP1, CYP96A2, AT1G63700, XPL1, and PMEAMT genes have the highest betweenness centrality. In these eight genes, the highest betweenness quantitative measures were 0.51, 0.509, and 0.508 for AG, CYP96A2 and SHP1, respectively;
and the lowest betweenness quantitative measure was 0.21 for AT1G63700, XPL1, and PMEAMT genes. The highest closeness centrality was related to CYP96A2 genes (0.31), SHP1 (0.31), AT1G73600 (0.30), PMEAMT (0.30), XPL1 (0.30), and AG (0.29) (Supplementary file. 3).
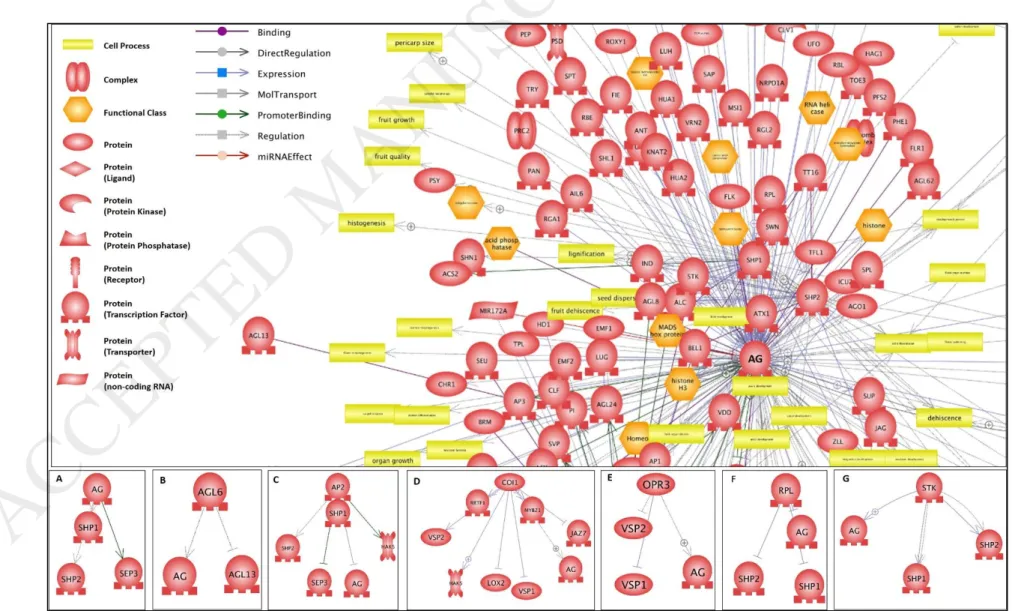
AG gene, as a transcription factor, is involved in differentiation of organs in the earliest stages of flowering. As illustrated in the regulatory network, (Fig. 5) AGAMOUS is necessary to grow normally the stamens and carpels in wild type flowers and plays an important role to preserve flower meristem [44]. It forms a heterodimer with SEPALATTA1 / AGL2, SEPALATTA2 / AGL4, SEPALLATA3 / AGL9 or AGL6 proteins that can regulate the genes using k-box domain during meristem development of flowers. GA1 is controlled by AG transcription factor. The product of this gene catalyzes the conversion of geranylgeranyl diphosphate to ent-copalyl diphosphate. The ent-copalyl diphosphate is gibberellin hormone precursor [44]. Certainly, down regulation of AG gene decreases the production of GA1 catalytic enzyme. Consequently, it is decreased the production of gibberellin hormone.
ACCEPTED MANUSCRIPT
Gibberellin hormone plays a direct role in size and compactness of the clusters. It has been validated positive effect of gibberellin in reducing and increasing cluster compactness and size of berries, respectively [5, 45]. One of the main factors in compactness of Sistan’s Yaghooti grape and small size of berries is down regulation of GA gene which has a direct effect on reducing activity of gibberellin hormone in the process of grape cluster development.
Several factors are effective on grape cluster compactness such as number and size of berries and length of peduncle and pedicels. The effective factors in grape cluster compactness have been investigated by microarray technology [46]. Transciptomic comparison for two clones related to Garnacha Tinta cultivar of grape, with different cluster compactness, indicated the high level of cell division in the earliest stages of flower development, plays an important role in the number and size of berries and, consequently, grape cluster compactness. Also, the auxin and gibberellin content fluctuations are important in number and size of berries [46].
AG, is the main factor in flower organogenesis in addition to control content of gibberellin. It can be mentioned that AG affects cluster compactness regarding the effect of flowering stage on cluster compactness and also AG key role in flowering. Some studies have showed that AG expression is continuing after flowering [47, 48]. AG involved in other biological process such as transcription regulation, plant defense response, and cellular differentiation, in addition to flowering (Fig. 5). We have found that AG is down regulated in Yaghooti grape after flowering, but this gene is expressed until berry ripening in other grape cultivars. This can be a reason for high compactness of Yaghooti grape clusters.
The deficiency of gibberellin and jasmonate hormones leads to male sterility in grape that it is partly due to shortening the stamens length in the flowers. It has been validated that three MYB21, MYB24, and MYB57 genes are necessary to develop the stamen in Arabidopsis.
These three genes are controlled by gibberellin and jasmonate levels [49]. The GA gene activates expression of DAD1 and Lox1 genes that are essential for jasmonate biosynthesis. It has also been proven that gibberellin has a positive role to increase the expression of jasmonate; and also, the high levels of jasmonate increases the expression of MYB21, MYB24, and MYB57 genes, which leads to grow the filaments in the flowers [49].
There are three genes which containing same function in sub-network (B).AT1G63700, XPL1 and PMEAMT contribute in metabolism of phospholipids. Phospholipids play vital roles in cell metabolism. Phosphatidylcholine (PtdCho) has allocated main part of cell membrane phospholipids in eukaryotes and some of prokaryotes. PtdCho includes more than 60% of plant cells membrane which has a key role in membrane formation and cellular signaling process [50, 51].The CDP-choline pathway is the main pathway in synthesis of phosphatidylcholine in plant cells. This pathway requires phosphocholin as a precursor to synthesize PtdCho. The plants produce Phosphocholin by three consecutive times of N- methylation of phosphoethanolamine (PEA) using phosphoethanolamine N-methyl transferase (PEAMT) enzyme. Phosphatidylcholine, in addition to being a part of membrane structure, also can be converted to phosphatidic acid (PA) and free choline by the Phospholipase-D (PLD) enzyme. This process is very important, because phosphatidic acid can work as a secondary messenger and play various roles in plant development [50, 51].
ACCEPTED MANUSCRIPT
AT1G63700, XPL1 and PMEAMT genes activate a set of cytochrome P450 (CYP) superfamily genes. Cytochrome P450 is the largest family of enzymes in plants; they are widely found in other organisms such as mammals, fungi, bacteria and insects [52]. There are a total of 315 genes related to CYP family in grape of which 26 belong to CYP86 family [53, 54]. The members of this superfamily are involved in some complex metabolic pathways.
The CYP86 family is associated to hydroxylation of fatty acids; CYP96 as a member of CYP86 family, works in order to surface resistance in biosynthesis of plants-based wax [55- 61].
The gene co-expression network was reconstructed for up regulated genes during cluster development process (Fig. 4c). The highest number of directed edges was related to Hsp70b gene (10 edges). Also, this gene showed the highest betweenness centrality (0.21) and the highest closeness centrality (1). The HIK gene was another hub node which had nine directed edges including betweenness centrality and closeness centrality equal to 0.07 and 1, respectively (Supplementary file. 4). As illustrated in Fig. 4c, the up regulated genes consist of two separately graphs (sub-network A & sub-network B). The sub-network (A) includes responsive genes to environmental stresses, especially heat stress (like HSP genes). The GolS1 gene product is a galactinol synthase which has a key role in the biosynthesis of raffinose oligosaccharides (RFOs). The accumulation of raffinose oligosaccharides increases plant resistance to different stresses such as heat, cold and salinity [62]. On the other hand, BAG6 controls several cellular activities. Its product is a chaperone binding which has an important role in resistance to heat stress through regulation of sHSP transcription cascade. It is also effective in programmed cell death and resistance against fungal diseases [63].
The sub-network (B) has been consisted of 9 genes. Two 3xHMG-box1 and 3xHMG-box2 genes are DNA-binding proteins which have (HMG) box domain in many eukaryotes. These proteins are involved in cell division cycle so that their highest expression occurs in meiosis.
The microscopic images have indicated that expression of 3xHMG-box proteins is taken place at the end of G2 phase in the cell cycle; as soon as the nucleus membrane is destroyed in prophase, these proteins are bound to chromosomes. The 3xHMG-box proteins are destroyed by a proteolytic process, immediately after the end of mitosis [64, 65]. Other genes in the sub-network (B) which interacted to HMG-box are effective in biosynthesis of proteins and microtubule construction. Totally, their function occurs in the cell cycle and is related to nucleus or cytoplasm division.
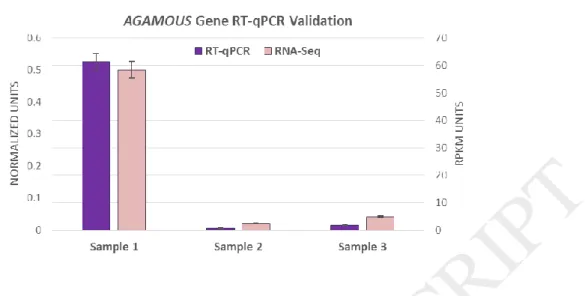
Validation RNA-Seq results by RT-qPCR
RT-qPCR was performed for AGAMOUS gene to validate the expression profile obtained by RNA-Seq. RT-qPCR expression profile was in complete agreement with the RNA-Seq data (Fig. 6) (Supplementary file. 5)
.
Also, ANOVA table for RT-qPCR related to AGAMOUS gene is provided (Table S2).The GRIP genes (GRIPs) are expressed specifically during grape berry ripening [66]. These genes may be employed as markers for this stage [3]. We analyzed our RNA-Seq dataset in respect to seven GRIPs (Table 6), which showed a little increment in their expressions at the third sampling time. However, since the final sampling was two weeks before harvesting time, this increment was not highly significant. However, the ascending trend in this expression profile can indicate the higher expression of these genes in berry ripening stage.
ACCEPTED MANUSCRIPT
Conclusion
Transcriptomic studies generate large scale information that requires to classifying and analyzing. Yaghooti grape of Sistan compared by other grape cultivars due to unique traits such as early ripening, resistance to heat, salinity and drought stresses and its cluster characteristics such as highly cluster compactness, seedless berries and small size of berries is suitable for transcriptomic analysis. A total of 24121 genes were expressed simultaneously with growing of the clusters, of which 3040 genes in the first stage, 2381 genes in the second stage and 2400 genes in the third stage had a significant increment as expression. More than 2,000 genes exhibited 10-fold change as gene expression. 240 differentially expressed genes were studied and analyzed based on GO terms, protein family and gene co-expression network during growth and development of Yaghooti grape clusters. The genes involved in metal ion binding, oxidation-reduction process and cell membrane were the most active genes during cluster development with 33, 32 and 65 representatives, respectively. The results showed that when the harvesting time of clusters is near, nucleus, cytoplasmic, cytosol, membrane and chloroplast genes activity are decreased and endoplasmic reticulum, vacuole and extracellular region genes activity are increased in cluster architecture. ATP-binding proteins increment indicated highly cell requirement to ATP as a source of energy. Reducing of chloroplast activities and increasing of mitochondrial activities indicated that shifting the cell metabolic equilibrium from anabolic to catabolic reactions. The metabolic pathways which are related to response to biotic and abiotic stresses are being increasing, when the plant is developing. Most of these genes which spend a large portion of plant's energy are related to response to heat stress.
The smHSPs family proteins are important in resistance to heat and dry weather in Yaghooti grape of Sistan. The gene co-expression network showed that AGAMOUS is a key gene in compactness of the Yaghooti grape clusters because of its influence on GA (gibberellin hormone) gene expression. It has previously been validated that this hormone affects increasing the length of cluster and size of the berries. To understand the biological process involved in cluster compactness of Yaghooti grape, it should be studied the effect of AGAMOUS expression enhancement on cluster compactness, in future projects. It is also possible to obtain a more comprehensive view about the processes involved in the construction, evolution and compactness of the clusters of Yaghooti grape of Sistan. This can be achieved by comparing the transcriptome of Yaghooti grape to transcriptome of other grape cultivars including loose clusters, or studying the transcriptome under hormonal treatments such as gibberellic acid; as well as, it is recommended the ncRNAs and smallRNAs analysis and epigenetic studies for this purpose in future.
Acknowledgement
We appreciate to “Center for International Scientific Studies &Collaboration (CISSC)” to funding us for this project.
Conflict of interest
This Work has been supported by the Center for International Scientific Studies
&Collaboration (CISSC).
ACCEPTED MANUSCRIPT
References
[1] H. Dolati-Baneh, R. Jalili, Modification of fruit trees (Genetic and breeding of Grape Reproduction), Mashhad University Press, IR Iran, 2014.
[2] Bryan Hed, Henry K. Ngugi, J.W. Travis, Relationship Between Cluster Compactness and Bunch Rot in Vignoles Grapes, Plant Dis, 93 (2009) 7.
[3] S. Zenoni, A. Ferrarini, E. Giacomelli, L. Xumerle, M. Fasoli, G. Malerba, D. Bellin, M.
Pezzotti, M. Delledonne, Characterization of transcriptional complexity during berry development in Vitis vinifera using RNA-Seq, Plant physiology, 152 (2010) 1787-1795.
[4] S. Domingos, J. Fino, O.S. Paulo, C.M. Oliveira, L.F. Goulao, Molecular candidates for early-stage flower-to-fruit transition in stenospermocarpic table grape (Vitis vinifera L.) inflorescences ascribed by differential transcriptome and metabolome profiles, Plant Sci, 244 (2016) 40-56.
[5] L. Chai, Y. Li, S. Chen, A. Perl, F. Zhao, H. Ma, RNA sequencing reveals high resolution expression change of major plant hormone pathway genes after young seedless grape berries treated with gibberellin, Plant Sci, 229 (2014) 215-224.
[6] R.H. Japelaghi, R. Haddad, G.A. Garoosi, Rapid and efficient isolation of high quality nucleic acids from plant tissues rich in polyphenols and polysaccharides, Molecular biotechnology, 49 (2011) 129-137.
[7] K.J. Livak, T.D. Schmittgen, Analysis of relative gene expression data using real-time quantitative PCR and the 2(-Delta Delta C(T)) Method, Methods (San Diego, Calif.), 25 (2001) 402-408.
[8] B.M. Bolstad, R.A. Irizarry, M. Astrand, T.P. Speed, A comparison of normalization methods for high density oligonucleotide array data based on variance and bias, Bioinformatics, 19 (2003) 185-193.
[9] A.J. Kal, A.J. van Zonneveld, V. Benes, M. van den Berg, M.G. Koerkamp, K.
Albermann, N. Strack, J.M. Ruijter, A. Richter, B. Dujon, W. Ansorge, H.F. Tabak, Dynamics of gene expression revealed by comparison of serial analysis of gene expression transcript profiles from yeast grown on two different carbon sources, Molecular biology of the cell, 10 (1999) 1859-1872.
[10] D.M. Martin, J. Bohlmann, Identification of Vitis vinifera (-)-alpha-terpineol synthase by in silico screening of full-length cDNA ESTs and functional characterization of recombinant terpene synthase, Phytochemistry, 65 (2004) 1223-1229.
[11] R.K. Jansen, C. Kaittanis, C. Saski, S.B. Lee, J. Tomkins, A.J. Alverson, H. Daniell, Phylogenetic analyses of Vitis (Vitaceae) based on complete chloroplast genome sequences:
effects of taxon sampling and phylogenetic methods on resolving relationships among rosids, BMC evolutionary biology, 6 (2006) 32.
[12] C. Da Silva, G. Zamperin, A. Ferrarini, A. Minio, A. Dal Molin, L. Venturini, G. Buson, P. Tononi, C. Avanzato, E. Zago, E. Boido, E. Dellacassa, C. Gaggero, M. Pezzotti, F.
Carrau, M. Delledonne, The High Polyphenol Content of Grapevine Cultivar Tannat Berries Is Conferred Primarily by Genes That Are Not Shared with the Reference Genome, The Plant Cell, 25 (2013) 4777-4788.
[13] T.M. Lowe, S.R. Eddy, tRNAscan-SE: a program for improved detection of transfer RNA genes in genomic sequence, Nucleic acids research, 25 (1997) 955-964.
[14] L. Venturini, A. Ferrarini, S. Zenoni, G.B. Tornielli, M. Fasoli, S. Dal Santo, A. Minio, G. Buson, P. Tononi, E.D. Zago, G. Zamperin, D. Bellin, M. Pezzotti, M. Delledonne, De novo transcriptome characterization of Vitis vinifera cv. Corvina unveils varietal diversity, BMC genomics, 14 (2013) 41.
[15] V.V. Goremykin, F. Salamini, R. Velasco, R. Viola, Mitochondrial DNA of Vitis vinifera and the issue of rampant horizontal gene transfer, Molecular biology and evolution, 26 (2009) 99-110.
ACCEPTED MANUSCRIPT
[16] O. Jaillon, J.M. Aury, B. Noel, A. Policriti, C. Clepet, A. Casagrande, N. Choisne, S.
Aubourg, N. Vitulo, C. Jubin, A. Vezzi, F. Legeai, P. Hugueney, C. Dasilva, D. Horner, E.
Mica, D. Jublot, J. Poulain, C. Bruyere, A. Billault, B. Segurens, M. Gouyvenoux, E. Ugarte, F. Cattonaro, V. Anthouard, V. Vico, C. Del Fabbro, M. Alaux, G. Di Gaspero, V. Dumas, N.
Felice, S. Paillard, I. Juman, M. Moroldo, S. Scalabrin, A. Canaguier, I. Le Clainche, G.
Malacrida, E. Durand, G. Pesole, V. Laucou, P. Chatelet, D. Merdinoglu, M. Delledonne, M.
Pezzotti, A. Lecharny, C. Scarpelli, F. Artiguenave, M.E. Pe, G. Valle, M. Morgante, M.
Caboche, A.F. Adam-Blondon, J. Weissenbach, F. Quetier, P. Wincker, The grapevine genome sequence suggests ancestral hexaploidization in major angiosperm phyla, Nature, 449 (2007) 463-467.
[17] Z. Khan, J.S. Bloom, L. Kruglyak, M. Singh, A practical algorithm for finding maximal exact matches in large sequence datasets using sparse suffix arrays, Bioinformatics, 25 (2009) 1609-1616.
[18] D. Szklarczyk, J.H. Morris, H. Cook, M. Kuhn, S. Wyder, M. Simonovic, A. Santos, N.T. Doncheva, A. Roth, P. Bork, L.J. Jensen, C. von Mering, The STRING database in 2017: quality-controlled protein–protein association networks, made broadly accessible, Nucleic acids research, 45 (2017) D362-D368.
[19] P. Shannon, A. Markiel, O. Ozier, N.S. Baliga, J.T. Wang, D. Ramage, N. Amin, B.
Schwikowski, T. Ideker, Cytoscape: a software environment for integrated models of biomolecular interaction networks, Genome research, 13 (2003) 2498-2504.
[20] Y. Assenov, F. Ramirez, S.E. Schelhorn, T. Lengauer, M. Albrecht, Computing topological parameters of biological networks, Bioinformatics, 24 (2008) 282-284.
[21] S. Maere, K. Heymans, M. Kuiper, BiNGO: a Cytoscape plugin to assess overrepresentation of gene ontology categories in biological networks, Bioinformatics, 21 (2005) 3448-3449.
[22] I. Rivals, L. Personnaz, L. Taing, M.C. Potier, Enrichment or depletion of a GO category within a class of genes: which test?, Bioinformatics, 23 (2007) 401-407.
[23] Y. Benjamini, Y. Hochberg, Controlling the False Discovery Rate: A Practical and Powerful Approach to Multiple Testing, Journal of the Royal Statistical Society. Series B (Methodological), 57 (1995) 289-300.
[24] A. Alisoltani, B. Shiran, H. Fallahi, E. Ebrahimie, Gene regulatory network in almond (Prunus dulcis Mill.) in response to frost stress, Tree Genetics & Genomes, 11 (2015) 100.
[25] S.P. Borgatti, M.G. Everett, A Graph-theoretic perspective on centrality, Social Networks, 28 (2006) 466-484.
[26] R. Apweiler, A. Bairoch, C.H. Wu, W.C. Barker, B. Boeckmann, S. Ferro, E. Gasteiger, H. Huang, R. Lopez, M. Magrane, M.J. Martin, D.A. Natale, C. O’Donovan, N. Redaschi, L.- S.L. Yeh, UniProt: the Universal Protein knowledgebase, Nucleic acids research, 32 (2004) D115-D119.
[27] P.J. Kersey, J.E. Allen, I. Armean, S. Boddu, B.J. Bolt, D. Carvalho-Silva, M.
Christensen, P. Davis, L.J. Falin, C. Grabmueller, J. Humphrey, A. Kerhornou, J. Khobova, N.K. Aranganathan, N. Langridge, E. Lowy, M.D. McDowall, U. Maheswari, M. Nuhn, C.K.
Ong, B. Overduin, M. Paulini, H. Pedro, E. Perry, G. Spudich, E. Tapanari, B. Walts, G.
Williams, M. Tello–Ruiz, J. Stein, S. Wei, D. Ware, D.M. Bolser, K.L. Howe, E. Kulesha, D.
Lawson, G. Maslen, D.M. Staines, Ensembl Genomes 2016: more genomes, more complexity, Nucleic acids research, 44 (2016) D574-D580.
[28] R.J. Kinsella, A. Kähäri, S. Haider, J. Zamora, G. Proctor, G. Spudich, J. Almeida-King, D. Staines, P. Derwent, A. Kerhornou, P. Kersey, P. Flicek, Ensembl BioMarts: a hub for data retrieval across taxonomic space, Database, 2011 (2011) bar030-bar030.
[29] C.M. Ford, P.K. Boss, P.B. Høj, Cloning and Characterization of Vitis viniferaUDP- Glucose:Flavonoid 3-O-Glucosyltransferase, a Homologue of the Enzyme Encoded by the
ACCEPTED MANUSCRIPT
Maize Bronze-1Locus That May Primarily Serve to Glucosylate Anthocyanidins in Vivo, Journal of Biological Chemistry, 273 (1998) 9224-9233.
[30] S.K. Muthusamy, M. Dalal, V. Chinnusamy, K.C. Bansal, Genome-wide identification and analysis of biotic and abiotic stress regulation of small heat shock protein (HSP20) family genes in bread wheat, Journal of plant physiology, 211 (2017) 100-113.
[31] M.-H. Oh, X. Wang, U. Kota, M.B. Goshe, S.D. Clouse, S.C. Huber, Tyrosine phosphorylation of the BRI1 receptor kinase emerges as a component of brassinosteroid signaling in Arabidopsis, Proceedings of the National Academy of Sciences, 106 (2009) 658- 663.
[32] Y. Belkhadir, J. Chory, Brassinosteroid Signaling: A Paradigm for Steroid Hormone Signaling from the Cell Surface, Science, 314 (2006) 1410.
[33] X. Wang, U. Kota, K. He, K. Blackburn, J. Li, M.B. Goshe, S.C. Huber, S.D. Clouse, Sequential transphosphorylation of the BRI1/BAK1 receptor kinase complex impacts early events in brassinosteroid signaling, Dev Cell, 15 (2008) 220-235.
[34] D.M. Friedrichsen, C.A.P. Joazeiro, J. Li, T. Hunter, J. Chory, Brassinosteroid- Insensitive-1 Is a Ubiquitously Expressed Leucine-Rich Repeat Receptor Serine/Threonine Kinase, Plant physiology, 123 (2000) 1247.
[35] S. Nellaepalli, S. Kodru, T. Malavath, R. Subramanyam, Change in fast Chl a fluorescence transients, 2 dimensional protein profile and pigment protein interactions during state transitions in Arabidopsis thaliana, Journal of Photochemistry and Photobiology B:
Biology, 128 (2013) 27-34.
[36] X. Yi, M. McChargue, S. Laborde, L.K. Frankel, T.M. Bricker, The Manganese- stabilizing Protein Is Required for Photosystem II Assembly/Stability and Photoautotrophy in Higher Plants, Journal of Biological Chemistry, 280 (2005) 16170-16174.
[37] G. Ditta, A. Pinyopich, P. Robles, S. Pelaz, M.F. Yanofsky, The SEP4 gene of Arabidopsis thaliana functions in floral organ and meristem identity, Curr Biol, 14 (2004) 1935-1940.
[38] H. Huang, M. Tudor, C.A. Weiss, Y. Hu, H. Ma, The Arabidopsis MADS-box gene AGL3 is widely expressed and encodes a sequence-specific DNA-binding protein, Plant Molecular Biology, 28 (1995) 549-567.
[39] K. Ehlers, A.S. Bhide, D.G. Tekleyohans, B. Wittkop, R.J. Snowdon, A. Becker, The MADS Box Genes ABS, SHP1, and SHP2 Are Essential for the Coordination of Cell Divisions in Ovule and Seed Coat Development and for Endosperm Formation in Arabidopsis thaliana, PLOS ONE, 11 (2016) e0165075.
[40] H. Lee, Y. Guo, M. Ohta, L. Xiong, B. Stevenson, J.K. Zhu, <em>LOS2</em>, a genetic locus required for cold‐responsive gene transcription encodes a bi‐functional enolase, The EMBO Journal, 21 (2002) 2692-2702.
[41] H. Sakamoto, K. Maruyama, Y. Sakuma, T. Meshi, M. Iwabuchi, K. Shinozaki, K.
Yamaguchi-Shinozaki, Arabidopsis Cys2/His2-Type Zinc-Finger Proteins Function as Transcription Repressors under Drought, Cold, and High-Salinity Stress Conditions, Plant physiology, 136 (2004) 2734-2746.
[42] V. Lippuner, M.S. Cyert, C.S. Gasser, Two Classes of Plant cDNA Clones Differentially Complement Yeast Calcineurin Mutants and Increase Salt Tolerance of Wild-type Yeast, Journal of Biological Chemistry, 271 (1996) 12859-12866.
[43] R. Mittler, Y. Kim, L. Song, J. Coutu, A. Coutu, S. Ciftci-Yilmaz, H. Lee, B. Stevenson, J.-K. Zhu, Gain- and loss-of-function mutations in Zat10 enhance the tolerance of plants to abiotic stress, FEBS Letters, 580 (2006) 6537-6542.
[44] Y. Zheng, N. Ren, H. Wang, A.J. Stromberg, S.E. Perry, Global Identification of Targets of the Arabidopsis MADS Domain Protein AGAMOUS-Like15, The Plant Cell, 21 (2009) 2563-2577.
ACCEPTED MANUSCRIPT
[45] D.C. Mundy, S.R. Haycock, V. Raw, R.H. Agnew, E. Sherman, A.R.G. McLachlan, G.C. Hagerty, Effects of chemical and natural product treatments on bunch openness and botrytis bunch rot in sauvignon blanc grapes, New Zealand Plant Protection, 67 (2014) 157- 167.
[46] J. Grimplet, J. Tello, N. Laguna, J. Ibáñez, Differences in Flower Transcriptome between Grapevine Clones Are Related to Their Cluster Compactness, Fruitfulness, and Berry Size, Frontiers in Plant Science, 8 (2017) 632.
[47] J. Malabarba, V. Buffon, J.E.A. Mariath, M.L. Gaeta, M.C. Dornelas, M. Margis- Pinheiro, G. Pasquali, L.F. Revers, The MADS-box gene Agamous-like 11 is essential for seed morphogenesis in grapevine, J Exp Bot, 68 (2017) 1493-1506.
[48] P.K. Boss, M. Vivier, S. Matsumoto, I.B. Dry, M.R. Thomas, A cDNA from grapevine (Vitis vinifera L.), which shows homology to AGAMOUS and SHATTERPROOF, is not only expressed in flowers but also throughout berry development, Plant Mol Biol, 45 (2001) 541-553.
[49] H. Cheng, S. Song, L. Xiao, H.M. Soo, Z. Cheng, D. Xie, J. Peng, Gibberellin acts through jasmonate to control the expression of MYB21, MYB24, and MYB57 to promote stamen filament growth in Arabidopsis, PLoS genetics, 5 (2009) e1000440.
[50] M.D. BeGora, M.J.R. Macleod, B.E. McCarry, P.S. Summers, E.A. Weretilnyk, Identification of Phosphomethylethanolamine N-Methyltransferase from Arabidopsis and Its Role in Choline and Phospholipid Metabolism, Journal of Biological Chemistry, 285 (2010) 29147-29155.
[51] A. Cruz-Ramirez, J. Lopez-Bucio, G. Ramirez-Pimentel, A. Zurita-Silva, L. Sanchez- Calderon, E. Ramirez-Chavez, E. Gonzalez-Ortega, L. Herrera-Estrella, The xipotl mutant of Arabidopsis reveals a critical role for phospholipid metabolism in root system development and epidermal cell integrity, Plant Cell, 16 (2004) 2020-2034.
[52] W.X.-y. XU Jun, GUO Wang-zhen, The cytochrome P450 superfamily: Key players in plant development and defense, Journal of Integrative Agriculture, 14 (2015) 1673-1686.
[53] D.R. Nelson, The Cytochrome P450 Homepage, Human Genomics, 4 (2009) 59-65.
[54] D.R. Nelson, R. Ming, M. Alam, M.A. Schuler, Comparison of Cytochrome P450 Genes from Six Plant Genomes, Tropical Plant Biology, 1 (2008) 216-235.
[55] H. Duan, M.A. Schuler, Differential Expression and Evolution of the Arabidopsis CYP86A Subfamily, Plant physiology, 137 (2005) 1067-1081.
[56] O. Serra, M. Soler, C. Hohn, V. Sauveplane, F. Pinot, R. Franke, L. Schreiber, S. Prat, M. Molinas, M. Figueras, CYP86A33-targeted gene silencing in potato tuber alters suberin composition, distorts suberin lamellae, and impairs the periderm's water barrier function, Plant physiology, 149 (2009) 1050-1060.
[57] H. Li, F. Pinot, V. Sauveplane, D. Werck-Reichhart, P. Diehl, L. Schreiber, R. Franke, P.
Zhang, L. Chen, Y. Gao, W. Liang, D. Zhang, Cytochrome P450 family member CYP704B2 catalyzes the {omega}-hydroxylation of fatty acids and is required for anther cutin biosynthesis and pollen exine formation in rice, Plant Cell, 22 (2010) 173-190.
[58] R. Ramamoorthy, S.Y. Jiang, S. Ramachandran, Oryza sativa cytochrome P450 family member OsCYP96B4 reduces plant height in a transcript dosage dependent manner, PLoS One, 6 (2011) e28069.
[59] T. Heitz, E. Widemann, R. Lugan, L. Miesch, P. Ullmann, L. Désaubry, E. Holder, B.
Grausem, S. Kandel, M. Miesch, D. Werck-Reichhart, F. Pinot, Cytochromes P450 CYP94C1 and CYP94B3 Catalyze Two Successive Oxidation Steps of Plant Hormone Jasmonoyl-isoleucine for Catabolic Turnover, The Journal of Biological Chemistry, 287 (2012) 6296-6306.
[60] A.J.K. Koo, G.A. Howe, Catabolism and Deactivation of the Lipid-Derived Hormone Jasmonoyl-Isoleucine, Frontiers in plant science, 3 (2012) 19.
ACCEPTED MANUSCRIPT
[61] R. Delventhal, C. Falter, R. Strugala, N. Zellerhoff, U. Schaffrath, Ectoparasitic growth of Magnaporthe on barley triggers expression of the putative barley wax biosynthesis gene CYP96B22 which is involved in penetration resistance, BMC Plant Biology, 14 (2014) 26.
[62] T.J. Panikulangara, G. Eggers-Schumacher, M. Wunderlich, H. Stransky, F. Schoffl, Galactinol synthase1. A novel heat shock factor target gene responsible for heat-induced synthesis of raffinose family oligosaccharides in Arabidopsis, Plant physiology, 136 (2004) 3148-3158.
[63] Y. Li, M. Kabbage, W. Liu, M.B. Dickman, Aspartyl Protease-Mediated Cleavage of BAG6 Is Necessary for Autophagy and Fungal Resistance in Plants, Plant Cell, 28 (2016) 233-247.
[64] C.S. Gillmor, A.H.K. Roeder, P. Sieber, C. Somerville, W. Lukowitz, A Genetic Screen for Mutations Affecting Cell Division in the Arabidopsis thaliana Embryo Identifies Seven Loci Required for Cytokinesis, PLOS ONE, 11 (2016) e0146492.
[65] M. Antosch, V. Schubert, P. Holzinger, A. Houben, K.D. Grasser, Mitotic lifecycle of chromosomal 3xHMG-box proteins and the role of their N-terminal domain in the association with rDNA loci and proteolysis, The New phytologist, 208 (2015) 1067-1077.
[66] C. Davies, S.P. Robinson, Differential screening indicates a dramatic change in mRNA profiles during grape berry ripening. Cloning and characterization of cDNAs encoding putative cell wall and stress response proteins, Plant physiology, 122 (2000) 803-812.
ACCEPTED MANUSCRIPT
Fig. 1. Venn diagram for the number of differentially expressed Sistan grape cluster genes in three steps of cluster development (Sample 1, Sample 2 and Sample 3). The genes have been considered with P-value less than 0.01 and a fold change more than 3.
ACCEPTED MANUSCRIPT
Fig. 2. Gene Ontology analysis of up-regulated genes in the cluster development process of Yaghooti grape. Sample-1) time: when the approximate size of clusters was about 5 cm and the flowers had not been opened; Sample-2) time: two weeks after the first sampling; Sample-3) time: two weeks after the second sampling. Each column represents the number of genes belonging to a GO term, and each color in the column represents a sampling stage of grape’s clusters.
ACCEPTED MANUSCRIPT
Fig. 3. The Protein Families related to up-regulated genes in the cluster development process of Yaghooti grape. Sample-1) time: when the approximate size of clusters was about 5 cm and the flowers had not been opened; Sample-2) time: two weeks after the first sampling; Sample-3) time: two weeks after the second sampling. Each column represents the number of genes belonging to a protein family, and each color in the column represents a sampling stage of grape’s clusters. Small heat shock family (HSP20) (short-term, smHSPs) proteins have up regulated significantly during cluster development.
ACCEPTED MANUSCRIPT
Fig. 4. Co-expression network of differential expressed in the clusters of Yaghooti grape during development and growing process. A) Co-expression network for all differentially expressed genes. B) Co- expression network for down-regulated genes. C) Co-expression network for up-regulated genes. The node size is based on betweenness centrality (low values to small size) while its color is based on closeness centrality (blue to low values), and edge thickness and color is based on edge betweenness is variable from blue color and thin edge (The lowest betweenness) to red color and thick edge (The highest betweenness).
ACCEPTED MANUSCRIPT
Fig. 5. Regulatory Network of AG (AGAMOUS) gene among up-regulated genes during cluster formation in Sistan Yaghooti grape. The AGAMOUS gene Showed key roles in flowering, flower development and cell differentiation (A, B and C pathways), defense response (D, E and F pathways), Transcription regulation (G pathway)
ACCEPTED MANUSCRIPT
and in other biological processes.
ACCEPTED MANUSCRIPT
Fig. 6. Quantitative RT-PCR validation of differential Gene expression observed for AGAMOUS gene. Comparison of gene expression for AGAMOUS measured by RNA-Seq and RT-qPCR. Right vertical axis represents expression determined by RNA-Seq in RPKM (Reads Per Kilobase Million) units while left vertical axis represents expression determined by RT- qPCR in normalized units.
ACCEPTED MANUSCRIPT
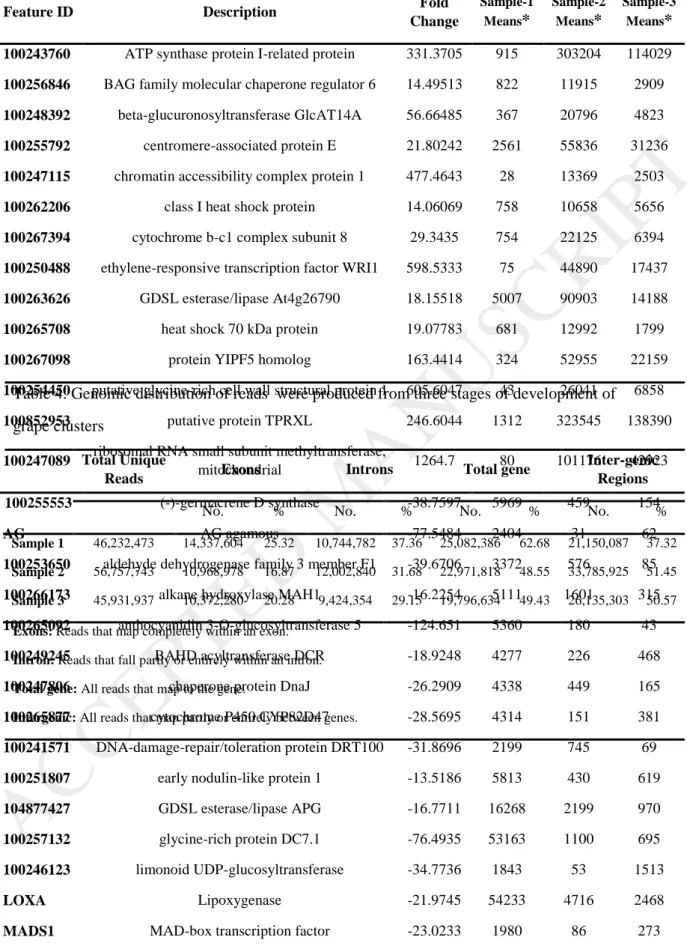
Table 1. Summary of reads number were produced from three stages of development of Yaghooti grape clusters
No. of reads not mapped - non-
specifically Unique
No. of mapped reads No. of total
reads
497,449 11,496,310
46,232,473 57,728,783
58,226,232 Sample 1
3,919,656 10,543,193
56,757,743 67,300,936
71,220,592 Sample 2
1,628,571 6,663,426
45,931,937 52,595,363
54,223,934 Sample 3
Unique: Number of reads that mapped uniquely in one place of the reference genome.
Non-specifically: When a read would have matched equally well another place in the mapping, it is considered a non-specific match.
No. of reads not mapped: Number of reads that is not mapped to the reference genome.
ACCEPTED MANUSCRIPT
Table 2. Mapping Parameters in CLC Genomics Workbench 9.5.3 software. The reads were mapped onto the 12-fold draft sequence of the Pinot Noir 40024 reference genome.
Also map to inter-genic regions Mapping type
1 Mismatch cost
Insertion cost 1
1 Deletion cost
0.65 Length fraction
0.65 Similarity fraction
Maximum number of hits for a read* 10
* If a read matches to multiple distinct places, but less than the specified maximum number, it will be randomly assigned to one of these places. The random distribution is done proportionally to the number of unique matches that the genes to which it matches have, normalized by the exon length. This means that if there are 10 reads that match two different genes with equal exon length, the 10 reads will be distributed according to the number of unique matches for these two genes. The gene that has the highest number of unique matches will thus get a greater proportion of the 10 reads.
ACCEPTED MANUSCRIPT
Table 3. Steps of Transcriptome analysis using RNA-Seq data
Analyzing Steps Tools Method
1. RNA Extraction - Japelaghi method [6]
2. RNA Sequencing
HiSeq 2500 (Macrogen Co.)
TruSeq Stranded Total RNA LT Sample Prep Kit (plant)
3. Quality Control of reads
CLC Genomics Workbench 9.5
Quality trimming based on quality scores Trim ambiguous nucleotides (Ns)
Adapter trimming (with a Trim Adapter List) Trimming of 3’ or 5’ ends of the reads
Length trimming to remove reads shorter or longer than a specified threshold
4. Mapping reads on reference genome
CLC Genomics Workbench 9.5
CLC read Mapper with MEM (Measurement Error Model) approach [17]
5. Normalizing data and statistical analysis
CLC Genomics Workbench 9.5
Normalizing method [8]
Statistical analysis method [9]
Also find statistical graphs in Fig. S1, Fig. S2 & Fig. S3 6. Determination of
differential expressed genes based on statistical values
Office 2013-Excel
p-value ≤0.01 fold change ≥10 expression value ≥2000
Finally 240 genes was selected and studied as significant differential expressed genes
7. Gene Ontology analysis (GO)
Cytoscape v.3.4.0 Ensembl
UniProt
Cytoscape BiNGO 3.0.3, Hypergeometric test [22], Benjamini- Hochberg False Discovery Rate –FDR correction [23], and significant level 0.05)
The selected genes were studied using the information in UniProt (http://www.uniprot.org) [26] and Ensembl (http://plants.ensembl.org) [27, 28] databases.
8. Reconstruction of Gene Co-Expression network
Ensembl STRING web service
Cytoscape v.3.4.0
Vitis Vinifera Gene IDs changed to Arabidopsis Thaliana Gene IDs using Ensemble Plant BioMart service
Calculating Genes combined Score using STRING web service Visualizing Gene Co-Expression network using Cytoscape NetworkAnalyzer 2.7 plugin
Extraction network topology using Cytoscape NetworkAnalyzer 2.7 plugin
9. Reconstruction of Gene Regulatory network
Ensembl Plant Pathway Studio
11
Vitis Vinifera Gene IDs changed to Arabidopsis Thaliana Gene IDs using Ensemble Plant BioMart service
Visualizing Gene Regulatory network using Plant Pathway Studio 11