This paper examines the impact of the Performance-Based Research Fund on the research quality of New Zealand universities from 2003 to 2012. The paper also critically examines the PBRF assessment process and the characteristics of the metrics used, suggesting opportunities for improvement in how researchers are assessed and how universities are ranked. The main purpose of the Performance Based Research Fund (PBRF) is to ensure that research excellence in the tertiary education sector is encouraged and rewarded.
1For background and detailed discussion of the PBRF, see New Zealand Tertiary Education Commission and Ministry of Education (2012). A summary of the change in the quality of researchers in New Zealand universities since the introduction of the PBRF is provided in Section 4.
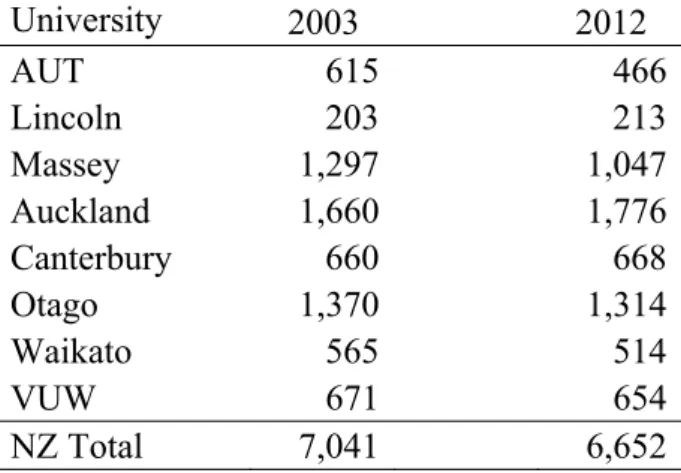
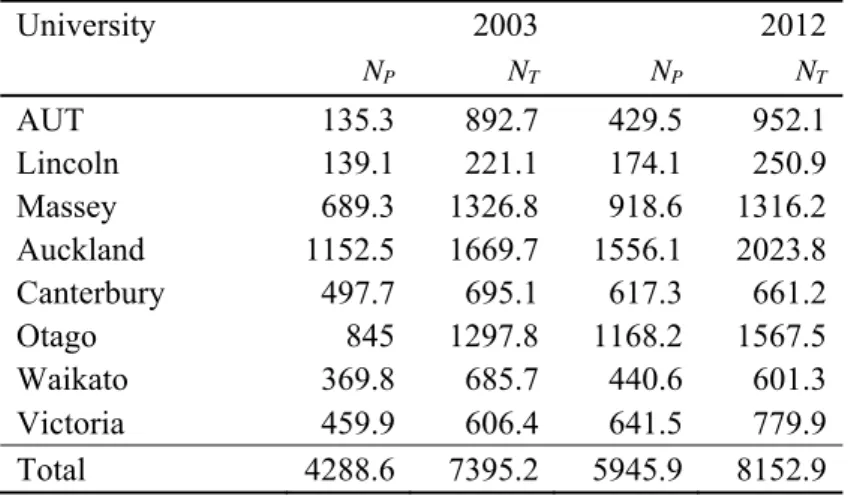
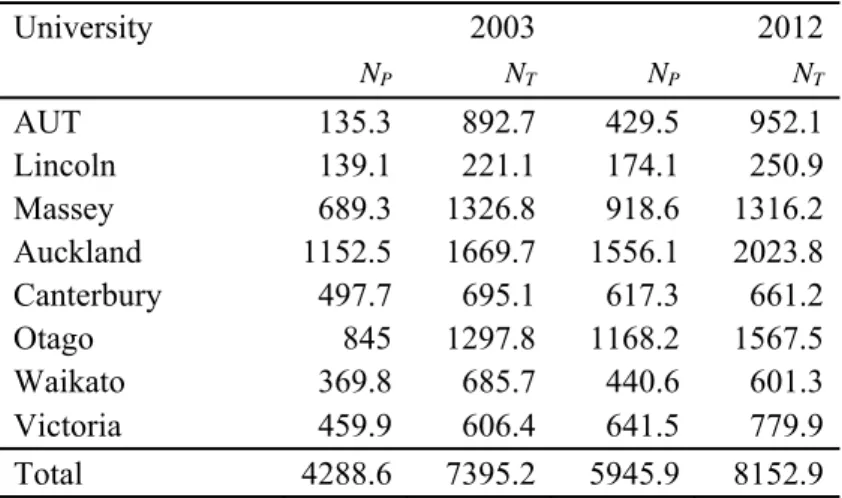
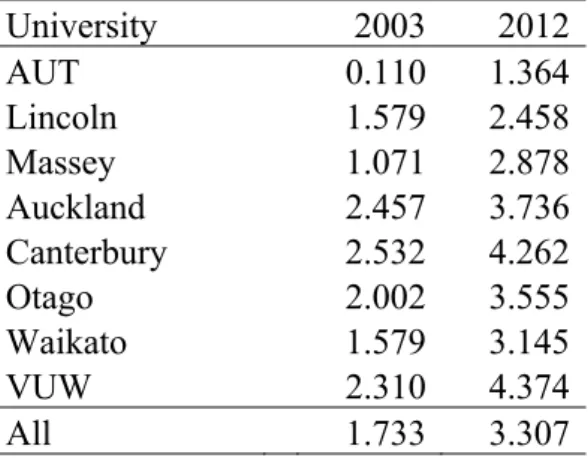
Changes in average quality scores for New Zealand universities This section reports changes between 2003 and 2012 in average quality scores, AQS. A rule change in 2012 which allowed universities not to submit R-type portfolios of potential researchers means that the AQS published by the Tertiary Education Commission for 2012 are not necessarily comparable to those for 2003.18. However, an alternative priority measure can be derived using the total number of non-managerial staff as the denominator in equation (2).
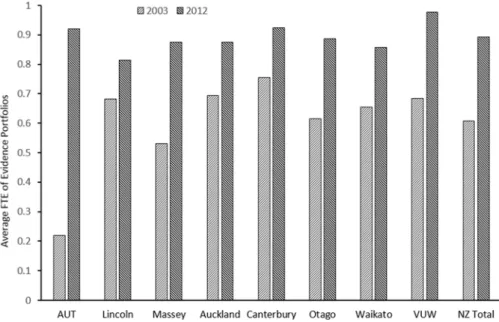
The use of this denominator avoids the comparability problems mentioned in the previous section. An AQS based on all non-administrative staff can be obtained by multiplying the AQS, which includes all portfolios, including R researchers and based on the unweighted TEC data, by the ratio of the employment-weighted number of portfolios to the total number of non-administrative employees. - administrative staff. The proportional growth rates for each university are shown in Table 4. The last row of this table shows the extent to which the growth in each AQS exceeds that which would result in a scoring system where all non-R researchers receive the same score . .
We can see that for all universities combined, the change in the distribution of C, B and A researchers contributed only an additional 9 percent to the growth of AQS. The term "Average Quality Score" is not actually an average of scores, but rather a weighted average of the values assigned to individual quality categories, the latter being determined by the position of the individual in the distribution of total weighted scores. At VUW, for example, a change in the quality composition of researchers (resulting from recruitment and restructuring) resulted in AQS growth 83 percent higher than it would have been under a scoring system that gives equal weight to all non-R researchers.
The percentage of additional contribution arising from the composition of researchers is lowest for AUT, Waikato and Canterbury, yet they are in the group with the highest growth rates in their AQSs.
Patterns of change in research quality of NZ universities
Massey has the second lowest AQS in 2003 and the second highest growth rate of almost 170 per cent. However, the remaining observations do not follow the pattern predicted by convergence: there is no systematic trend towards uniformity of AQS across universities.21. While a stated aim is to raise the quality of research in NZ universities, this can create a tension between 'equity' and 'efficiency' in research funding; see, for example, Hicks and Katz (2011).
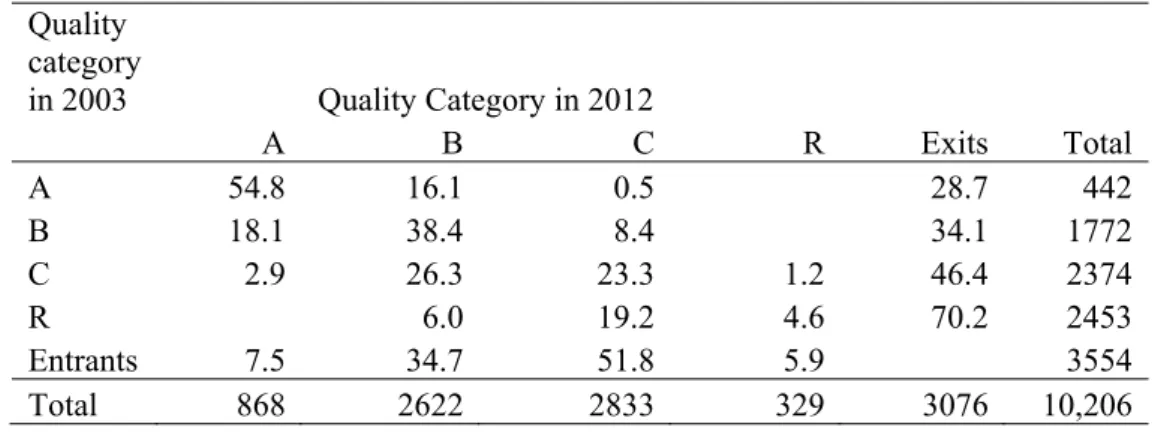
Incentives may have the effect of generating a concentration of higher quality research in a small number of universities. However, objections may be made on equity grounds involving, for example, the geographical distribution of researchers. Therefore for Bs and Cs, it can be said that about a third of participants (between 2003 and 2012) fell into each category, and about a quarter of those classified as Bs or Cs in 2003 progressed to a highest class in the same institution until 2012.23.
It is likely that many of these moves were to another university and may have involved some form of promotion, but this information is not available from the data. The B researchers also experienced considerable outward mobility, and 29 per cent of those who were A in 2003 had gone out. This is consistent with the fact that a small proportion of the participants in the period were classified as A researchers in 2012.
There may be a large proportion of As that left between 2003 and 2012, as the denominator (the initial number of As) is much smaller than the total number of participants in all categories during the period.
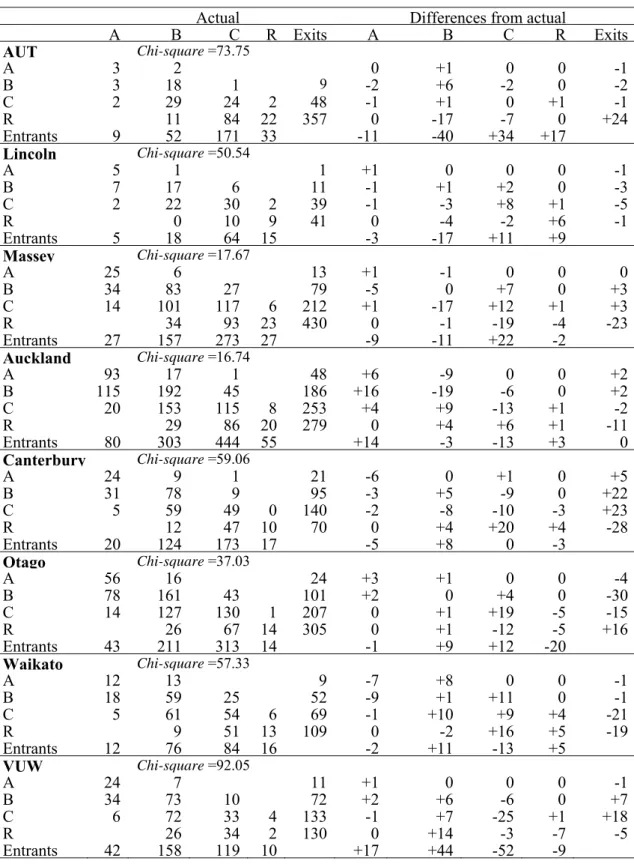
Individual university responses
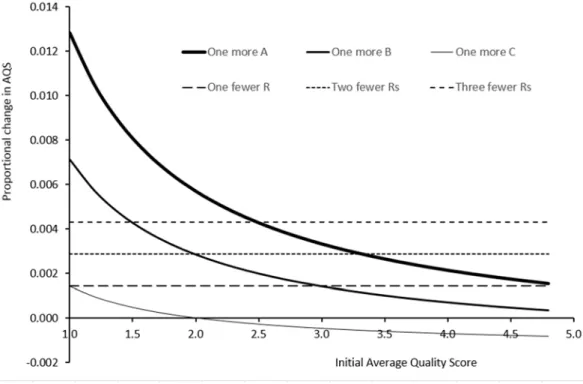
There are greatly diminishing returns, in terms of the impact on AQS, of hiring A and B researchers. Thus, experiences differed between the three universities that consistently ranked at the lower end of the AQSs. VUW topped the AQS ranking in 2012 and achieved success naming As and Bs and retaining higher scoring staff.
The higher ranked universities were also relatively better at converting researchers to higher grades, with the possible exception of Otago. Also, when recruiting Rs, they can also choose from those who are at the higher end of the scale in terms of potential. The greater ease of attracting As and Bs to the higher AQS universities, combined with the effect of the funding formula, could lead to an effective reduction in their 'price'.
However, there is no doubt that New Zealand universities in 2003 had a large number of Rs and this was not consistent with the incentive structure created by the PBRF exercise. An equilibrium distribution obtained using the transition matrix and birth vector in Table 5 was found to give equilibrium stocks of each quality category that are not feasible and very different from the observed totals for 2012.28 It is therefore not unreasonable. In addition, there may have been other external influences, such as the effect of the global financial crisis on the ability of New Zealand universities to recruit academics from other countries, the effects of which cannot be isolated.
These results help show the extent to which the changes since 2003 have actually been large, despite many characteristics of universities that make structural change difficult.
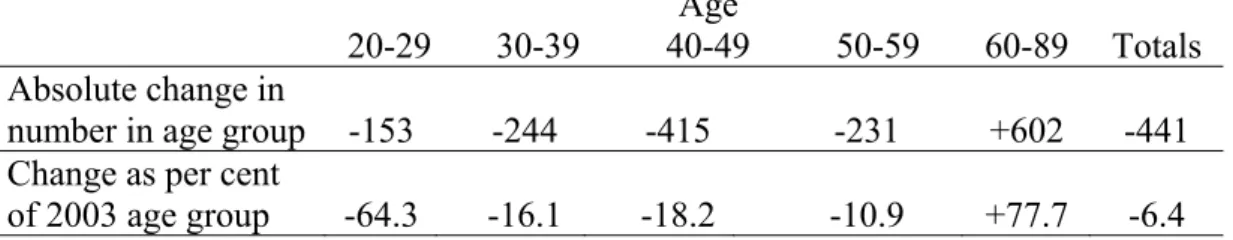
Changes in the age distribution of researchers
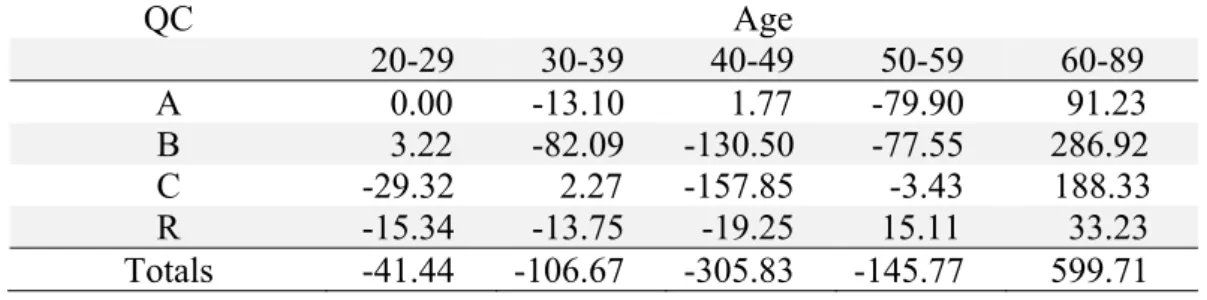
These totals reveal that the large increase in the rate of researchers in the 60–89 age group is much higher (by 599.71) than would be expected from the 2003 marginal rates. Conversely, the decline in the frequency of researchers in each of the other age groups is greater than would be expected from the 2003 marginal frequencies. The biggest differences are the decline of approx. 306 in the 40-49 age group, and the increase of approx. 600 older cohort researchers.
Conversely, there are sudden large drops in the number of people in C and R categories aged 20-29, B in the 30-39 age group, C and B researchers aged 40-49 and large sudden drops in A and B. researchers aged 50-59. The unexpectedly high number of R-grade seniors may be because it is more difficult and expensive to remove people in the older age groups.29 The 'excessive' decline of lower grade researchers in the age group younger may reflect the possibility that people at that stage of their career are more mobile in their careers or are easier to remove. With three sj components, j each assigned an integer score from zero to seven, the total weighted score, S, can range from 0 to 700, but many values in the range are not possible.
The next two numbers in the sequence are 70 and 75, and then increase in steps of 5 to 570. An examination of the distribution of the initial weighted scores in the 2003 and 2012 PBRF rounds and the movement of these scores during the evaluation of the expert panel shows that the use of quality categories and associated thresholds clearly influenced the performance scores assigned to research portfolios and the final allocation of portfolios to quality categories. In particular, the process produced large jumps in the distribution of total weighted scores at the lower thresholds for each quality category.
However, as mentioned in the introduction, funding is based on a formula that uses individual quality categories, rather than AQS, with funding weights varying by discipline.
Conclusions
However, experience varied widely between universities, and this difference was usually related to the university's research ranking in 2003. Particularly among new entrants between 2003 and 2012, higher-ranked universities tended to be more successful in attracting and retaining quality A and B researchers. Preferred the objective should influence the design of performance-based funding schemes and their incentives.
Without similar data prior to PBRF, it is not obvious that all observed changes can be attributed to the introduction of the PBRF process. Therefore, it is reasonable to assume that the large changes in the period 2003 to 2012 were largely driven by the introduction of the PBRF and that such large changes are unlikely to occur again. This paper has shown that the research quality of New Zealand universities has improved significantly and it can be argued that this is a direct result of the introduction of the PBRF system.
2017a) Evolution of research quality in New Zealand Universities as measured by the Performance Based Research Fund process. A history and overview of PBRF. https://education.govt.nz/assets/Documents/Further-education/Policies-. andstrategies/Performance-based-research-fund/PBRFHistoryAndOverview.pdf Ministry of Education. New Zealand Tertiary Education Commission (2002) Investing in Excellence: Report of the Performance Based Research Fund Working Group.
Available at: www.educationcounts.govt.nz. 2012) Citations as a measure of the research output of New Zealand's economics departments: the problem of 'long and variable lags'. 2017).