ePress
Research with impact
Wetback Research: Thermodynamic Flow Characteristics of Passive
Thermosyphon Energy Transfer from Independent Heat Source to Remote Storage Using Both Direct and Indirect Systems
RESEARCH
REPORT SERIES
Garry Cruickshank Don Mardle
doi.org/10.34074/rsrp.094
Wetback Research: Thermodynamic Flow Characteristics of Passive Thermosyphon Energy Transfer from Independent Heat Source to Remote Storage Using Both Direct and Indirect Systems by Garry Cruickshank and Don Mardle is licensed under a Creative Commons Attribution-NonCommercial 3.0 New Zealand licence.
This publication may be cited as:
Cruickshank, G., and Mardle, D. (2022). Wetback Research:
Thermodynamic Flow Characteristics of Passive Thermosyphon Energy Transfer from Independent Heat Source to Remote Storage Using Both Direct and Indirect Systems. Unitec ePress Research Report Series (1/2022). https://doi.org/10.34074/rsrp.094
About this series:
Unitec ePress periodically publishes research report papers that highlight findings of completed research projects by current members of staff and their research associates. All papers are blind reviewed. For more papers in this series please visit: www.unitec.
ac.nz/epress/index.php/category/publications/epress-series/
research-reports-epress-series/
Cover design by Penny Thomson
Contact:
[email protected] www.unitec.ac.nz/epress/
Unitec, Te Pūkenga
Private Bag 92025, Victoria Street West Auckland 1142
New Zealand
Wetback Research: Thermodynamic Flow Characteristics of Passive Thermosyphon Energy Transfer from Independent Heat Source to Remote Storage Using Both Direct and Indirect Systems By Garry Cruickshank and Don Mardle
ISSN 2357-206X
Wetback Research:
Thermodynamic Flow
Characteristics of Passive
Thermosyphon Energy Transfer from Independent Heat Source to Remote Storage Using Both Direct and Indirect Systems
Garry Cruickshank and Don Mardle
Figure 1. Whiteboard used to plan pipe layouts forming a wall in the workshop.
Garry Cruickshank started a 10,000-hour (five-year) apprenticeship in plumbing and gasfitting in 1971, and obtained a Trade Certificate in Plumbing and Gasfitting and an Advanced Trade Certificate in Plumbing. After moving to Auckland he worked in commercial plumbing and industrial gasfitting. He was a member of the Auckland Apprenticeship Committee for four years, and spent two years on the National Apprenticeship Committee.
Moving back to the Waikato in 1986, he owned a contracting company, opened a Gas Centre and became area manager for the Natural Gas Corporation. In 1987 he started work at Unitec as a Lecturer in the Plumbing and Gasfitting Department, becoming Programme Leader and later Head of Department.
During the time he ran the department, the number of full-time equivalent students (mainly apprentices) went up from 65 to 450. During that time an electronic textbook (ebook) was produced (under the direction of Don Mardle) for the plumbing and gasfitting industry, which was generally considered as the most advanced trade-teaching tool in the world at that stage.
During a 3.5-year sabbatical (2009–13) he wrote training programmes and technical instruction books for a range of industry organisations, and was employed as a Gas Auditor for the Plumbers, Gasfitters and Drainlayers Board for two years. Garry returned to Unitec from 2013 to 2016, and left to take up a position at Auckland Council as a Technical Trainer, training building inspectors and processors. In 2019 he moved into the Regulatory Compliance Department, in the Targeted Initiatives team. He now trains compliance investigators and deals mainly with complex issues related to dangerous and insanitary buildings.
Don Mardle left school and started work in a factory as a process worker making TV and stereo cabinets.
After a great year, and lots of time to think, he applied to, and was accepted for, teacher’s college, where he trained for three years, before heading to Whangārei for a short stint of teaching. This was an important time, and although a love of education became entrenched in Don’s psyche he soon became disillusioned with the inadequacies of the system, and began looking for something new.
Influenced by new, creative and skilled friends with trades, Don quit teaching, took a big pay cut, and began a carpentry apprenticeship. Building soon became his new love, which, like education, quickly became ingrained. While still an apprentice, Don completed his Trade Certificate (winning an award for the top candidate of his year), and also took on night school to train for his Advanced Trade Certificate.
Then, after 16 fantastic and diverse years contracting in New Zealand, Sydney and London, and developing additional skills along the way in shopfitting, furniture and cabinetmaking, and wooden flooring, it all fell apart with a career-ending hand injury.
Then a long and rewarding academic career began, along with a long and rewarding friendship with Garry Cruickshank. Don was able to combine his two great loves – education and building – and taught carpentry for a couple of years. He was then seconded to Unitec’s Plumbing Department, which had just come under Garry’s leadership, and so an extraordinary journey began – and Don accidently became fascinated with the science and craft of plumbing and gasfitting. Garry and Don worked together to contribute to a massive increase in plumbing, drainlaying and gasfitting student numbers, and dramatic improvement in retention and success. Over a period of about four years, Don designed and project managed the development of a world-leading, comprehensive, interactive, online learning resource for plumbing, gasfitting and drainlaying apprentices, along with a variety of electronic support tools, databases and a unique assessors’ tracking system.
Garry had a sabbatical for several years, during which Don was seconded to other parts of Unitec, and led online and distance-learning development programmes in courses such as veterinary nursing.
Garry returned from his sabbatical, and he and Don teamed up again for this wetback research project – something they had been talking about for more than a decade. Don designed the unique firebox, Garry fitted it up and commissioned the gas componentry, and together they designed and enacted the research project.
In 2017 Don and Garry both moved on to positions at Auckland Council and together ran the award- winning in-house training school for building officers who process plans for consent, and inspect buildings during construction. Don eventually left Auckland and moved to rural Hawkes Bay, where he worked in the regulatory environment, training building officers for a further two and a half years. Don is now an independent contractor working in the construction industry, and still has an unnatural interest in plumbing.
2 About the authors 4 Proviso
5 Executive summary
6 Recommendations
7 Terminology
8 Introduction and background
8 The genesis of this research project
9 Purpose
10 Aims and objectives 11 Methodology
13 Pipe volumes
14 Surface area of pipes 14 Efficacy of wetbacks
16 Measurement and recording of results
18 Resources
19 Water supply to system 20 Results and findings
22 Scenario 1. Types of wetback.
23 Scenario 2. Under what conditions, if any, is 25 mm pipe better than 20 mm pipe?
26 Scenario 3. Given the different requirements of G12/AS1 and AS/NZS 3500.4, are the gradients specified more efficacious than any other?
27 Scenario 4. Is there a maximum or optimum distance after which performance of a wetback suffers, either horizontally or vertically?
27 A word on insulation (lagging)
28 Scenario 5. Indirect systems. In terms of efficiency, is it better to connect the wetback to the coil, or the wetback to the main body of water in the storage vessel, with the coil used to transfer heat to the consumed water?
30 Scenario 6. Is it necessary or desirable to have THE return pipe at the same gradient as the flow pipe?
33 Scenario 7. Does a commercially available surge valve have any noticeable effect on any system, or is the same effect provided by a heat trap?
34 Scenario 8. Counterflow. What effect, if any, does reversing the flow and return connections from the wetback to the HWC have on the efficiency or safety of the system?
35 Scenario 9. At a standard distance of 10 m (horizontal), compare the differences between a conventional adjacent configuration and an over/under configuration with both 20 mm and 25 mm pipe, and conventional/counter-flow connections.
37 Scenario 10. And then we did something very stupid.
39 Discussion
39 General principles of a syphon 40 Stratification
41 Water loss at high temperature
42 Counterflow system
43 Configuration of return pipe
46 Full of sound and fury, signifying nothing 48 Theory of water movement within wetback pipes 56 Conclusion
57 Other systems: Solar and pumped – extrapolation
57 Solar
57 Pumped systems
57 Recommendations 59 References
60 Appendix 1. G12/AS1
61 Appendix 2. AS/NZS 3500.4.2018 63 Appendix 3. Schedule of tests 69 Appendix 4. Recommended systems 71 Appendix 5. General photos
Proviso
In most instances, the primary purpose of a solid-fuel heater is to provide space heating;
in such circumstances heating water via a wetback is a secondary benefit. This research has been designed to establish the best configuration for water heating – any increase in water-heating efficiency is at the cost of a reduction in heat output for space heating.
Further, a decrease in heat output (space heating) could have implications for published figures on solid-fuel heater emissions and efficiency of authorised burners in relation to Clean Air Zones.
Executive summary
The method of heating water by means of a water jacket installed in the firebox of a solid-fuel burner, connected by pipes to a hot-water cylinder (HWC), was once commonplace in New Zealand, but has become less so in recent years. These systems, known as wetbacks, are covered by Building Code Clause G12, but considerable confusion has been caused by conflicting rules specified in the two main compliance documents, G12/AS1 and AS/NZS 3500.4 (hot water). In both compliance
documents, wetback systems are defined as ‘uncontrolled heat sources’ with specific rules and limitations that stipulate how they are to be installed, and to keep them safe.
However, other than common safety rules, each has entirely different ‘mandatory’
installation rules that affect the efficiency of the systems.
They couldn’t both be right, but they could both be wrong.
This is further confused by another standard, NZS 4603:1985, being mentioned in G12 as ‘another acceptable solution’ and differing from and contradicting both of the above. This standard is often quoted by manufacturers in their instructions.
One driver of this research, from a regulatory view, was to determine which of the two main compliance documents was correct, if either.
By building a wetback heater with measurable and constant inputs, and measuring the results using a state-of-the-art data logger, we were able to measure and record the efficacy of different pipe configurations and different systems.
A series of practical tests was conducted over a two-year period, to determine the effect different pipe configurations (pipe diameter, length, gradient, etc.) had on water circulation, and thus the efficacy of different installations.
The authors tested systems where there was a separation between the heater and HWC at 1.0 m, 3.0 m and 10.0 m horizontally, and ranging from 100 mm to 3.0 m rise (vertical separation), as well as indirect heat transfer through a heat exchanger coil within the storage vessel, and direct systems in which the consumable water flows through the wetback and is heated directly. We also tested a once very popular remote system, known as an ‘over/under’ system, where the heater and storage vessel are separated by a room; in this case, the flow pipe runs through the roof space and the return pipe runs under the floor.
We also included a number of comparative tests in which we fitted a proprietary
‘surge valve,’ comparing those results with identical installations with no valve. We concluded this valve had no measurable effect.
What we were able to show is that much of what we thought we knew about wetbacks (uncontrolled heat sources), and most of what is taught to apprentices and tradespeople alike is fundamentally wrong. With the exception of basic safety principles requiring wetback systems to be open vented, neither of the two compliance documents deemed to comply with Building Code Clause G12 appears to have been based on any sort of research, and the systems specified are among the least effective configurations we tested.
Various incontrovertible and ‘known facts’ taught to generations of plumbers, and examined as part of their registration requirements, have been shown by our research to be fundamentally flawed.
All available textbooks, as well as all the teaching material reviewed, stipulate that water is moved through the pipes due to thermosyphon (convection currents), but we discovered, and demonstrated unequivocally, that this is only true to a limited extent,
and that, in many systems, the main motivation force is in fact provided by a series of small steam explosions. This has serious implications in the design and application of this principle to other aspects of the plumbing trade.
In short, the main conclusions are as follows:
– Basing the pipe sizes on distance between heater and HWC is incorrect – a 20 mm pipe is the most suitable size in all circumstances tested.
– There is no advantage in a 25 mm pipe in any circumstance tested.
– Requiring a minimum or specific rise (away from the heater) in the flow pipe is flawed – any rise will do as long as there is one.
– Requiring the return pipe to fall away from the cylinder is counterproductive, and reduces the efficiency of the system.
– The return pipe should fall from the cylinder and then rise to the heater, forming a heat trap. Alternatively, a purpose-made heat trap should be fitted.
– Taking the flow pipe to the top, and the return pipe from the bottom of the cylinder, is the least effective method – these connections should be reversed (counterflow).
– If connecting a wetback to a water heater containing a coil (indirect heating), the least effective method is to connect the coil to the wetback flow and return pipes.
It is better to heat the water in the storage vessel directly, and run the consumable water through the coil (indirect heating).
– A formula for ascertaining the most effective design (in terms of heat transfer) of a wetback element is suggested.
– Once water in a wetback system exceeds a certain temperature, it will generate a series of contained steam explosions, which drive the circulation. This contradicts most explanations for the process, and we believe this is the first time the
phenomenon has been documented.
– At a certain ‘tipping point’ a process will start that results in an unstoppable and considerable discharge of boiling water out of the open vent pipe. In this process, up to a third of the water in the storage vessel will be discharged before incoming water cools the vessel enough to stop the discharge.
RECOMMENDATIONS
After digesting these findings, we suggest five main courses of action – all need to be done concurrently.
1. MBIE and Standards NZ should consider getting together, recognising that their respective solutions require amending, and set up a joint committee to rewrite the section in G12/AS1 on wetbacks.
2. Modify AS/NZS 3500.4 to align with G12/AS1.
a. Encourage Standards Australia to amend AS/NZS 3500.4.
b. Encourage Standards New Zealand to amend NZS 4603:1985.
3. Teaching organisations should review their teaching material to reflect this research.
4. The Plumbers, Gasfitters, and Drainlayers Board should ensure all examination questions and marking criteria align with these findings.
5. Emissions of authorised burners should be reviewed.
TERMINOLOGY
There is a lot of trade terminology applied to certain aspects of this research. Some textbooks and some manufacturers’ instructions confuse or misuse the terms: for example, the term ‘wetback’ is used for both the heat exchanger unit inside the space heater, and the pipe-work connecting this unit to the storage tank. It is also sometimes used to describe the entire installation including all of the above.
To avoid confusion, we have determined to use standardised terms for specific parts of the installation, and use these throughout. This includes a number of terms we have had to allocate (or invent) as we discovered new phenomena.
Term Meaning
Wetback Heat exchanger unit (water jacket) contained within a solid-fuel space heater.
Heater Usually solid-fuel uncontrolled space heater designed to heat the internal environment, in this case also containing a wetback.
Flow pipe Pipe leading from the wetback to hot-water storage tank.
Return pipe Pipe leading from the hot-water storage tank to the wetback.
Rise and fall The gradient of the pipe in the direction of flow.
Riser Pipe within a hot-water cylinder (HWC) designed to deliver heated water to the top of the cylinder.
Coil A heat exchanger contained within the HWC in the form of a coil through which water passes.
Vent pipe A pipe connected to some part of the system that is open to the atmosphere, and that limits pressure and allows the escape of steam.
Adjacent system Heater immediately adjacent to the HWC, either sideways or below.
Over/under system The HWC is at a distance from the heater, separated by some structural element such as a doorway or wall; the flow is taken over the ceiling and the return brought back under the floor.
Direct heating system The water is heated by the wetback and stored in the HWC; the heated water is used directly, with no other heat exchanger used.
Indirect heating system The water heated by the wetback is not consumed. The consumed water is heated via a heat-exchanging coil.
Thus, the water flowing through the wetback indirectly heats the consumed water.
Indirect systems enable mains-pressure supply for consumed water.
Counterflow Where the flow and return pipes are connected to the HWC in reverse order to the traditional method; that is, the flow is connected to the bottom of the HWC, and the return pipe connected to the top of the HWC.
Conventional Standard and traditional pipe configuration where the flow pipe is connected to the top of the HWC, and the return pipe to the bottom.
HWC Hot-water cylinder, being the usual storage vessel in domestic installations. Will usually have an electric element as the default energy source with the wetback as a booster only. Also referred to as a storage vessel or water heater.
Introduction and background
When Garry was serving his plumbing and gasfitting apprenticeship in Tokoroa in the 1970s, the installation of wetbacks was an integral and common part of the job.
Hundreds of solid-fuel heaters were installed with wetbacks or wetbacks fitted to open fireplaces. Many were of the over/under type, and the techniques and principles used were commonly known and applied. Only after moving to Auckland in 1979 did Garry discover wetbacks were not commonly installed in that city.
A few years after moving to Auckland, Garry was employed as an Organiser for the Northern Branch of the Plumbers Union, and had occasion to visit the plumbing tutors at Manukau Institute of Technology (MIT). They were in the lunch room discussing a new textbook being written for apprentices, which was to replace the existing Technical Correspondence Institute textbook – the default plumbing text at the time.
The only tutor Garry recognised at the time was Ken Doyle, the Head of the Plumbing Department. Discussion turned to wetbacks, and as none of those present had experience of over/under systems Garry drew a sketch of the system on the back of a pie packet, and left them to it.
Some years later, Garry was employed as a tutor at Unitec, and found most of the people who wrote the new textbook (Doyle, 1988–90a, 1988–90b, commonly referred to as Doyle Parts 1 and 2) were now also employed at Unitec. He found that the textbook now included the drawing he had done on the pie packet (with one minor error) some 16 years earlier.
The same drawing with the same error had also been incorporated in NZS 4603.
While the teaching of hot-water systems at the time was loosely based on Doyle (1988–90a, 1988–90b), it also had to be packaged around Building Code Clause G12 compliance documents – G12/AS1 (see Appendix 1) and, to a lesser extent, AS/NZS 3500.4 (hot water) (see Appendix 2). The problem was that both documents were very restrictive in their coverage and application of wetbacks, covering only systems where the hot-water storage vessel and the heat source were directly adjacent (‘adjacent system’).
But there was an even bigger problem – the rules spelled out in each document were not only different, but they directly contradicted each other. How it is that an international standard, recognised by the New Zealand Building Code as the Verification Method (G12/VM) for G12 hot water, could contradict the Acceptable Solution (G12/
AS1) from the same Building Code clause for over 20 years, and still does, is beyond comprehension.
THE GENESIS OF THIS RESEARCH PROJECT
In 1998, Garry was asked to suggest subjects suitable for practical research projects at Unitec, and came up with a list of five major industry projects including a suggested wetback project. This was accepted with some enthusiasm by the research committee of the time, who then promptly shelved the idea when they discovered it would cost money.
After Garry was put in charge of the Plumbing Department in 1999, he altered the teaching programme to include a wide range of wetbacks, and included actual installation of an over/under system as one of the practical assessment tasks. When the department produced a new e-book in 2006 to replace Doyle it included a chapter on wetbacks, including an explanatory animation. This was not adopted by other
providers, and also clashed with some fixed ideas of the then Chief Examiner of the Plumbers Gasfitters and Drainlayers Board (PGDB), over how indirect systems should work. For several years in a row, a candidate for Plumbers Board exams was presented with a requirement to draw the pipe configuration between boilers and storage tanks, as shown in Doyle. Candidates who gave an alternative to the model answer (mainly Unitec apprentices) were marked wrong, and in some cases had to have their papers re-marked in order to pass the exam. This was a most unsatisfactory situation.
Garry had several terse disagreements with the Chief Examiner, who refused to countenance the possibility that he might be wrong and was adamant that the indirect method shown in the textbook was the only way of doing it. Unfortunately, other providers continued to deliver material that was supplied by a training organisation, leading to what many of us viewed as an unsatisfactory level of knowledge and substandard skill-set.
When Garry returned to Unitec in 2013 following a three-and-a-half-year sabbatical, he found many of the teaching materials and tasks previously covered had been abandoned, but on the other hand, a new research director was keen on pursuing practical research opportunities. A new proposal detailing the advantages of such a project was finally approved by the Research Committee, which granted $10,000 towards project costs.
This research project, therefore, commenced some 16 years after first being proposed and accepted.
PURPOSE
While once a common method of heating water in New Zealand, the use of wetbacks connected to storage water-heaters by pipes has been declining for many years – for a variety of technical, environmental and economic reasons.
The authors felt that one of the key problems was the lack of authentic research- based technical information on the correct design and installation of wetbacks, with most textbooks being largely silent on the matter, and the only three regulatory documents (two Standards and a New Zealand Building Code Acceptable Solution) incomplete and contradictory. This was preventing many Building Consent Authorities (BCAs) from approving once-popular systems, because they fell outside the narrow range of systems detailed in the compliance documents.
We felt the first step in standardising the rules regarding this neglected technology was to gather empirical data to determine which, if any, of the specifications detailed in these documents was correct, and to gather data on alternative systems not covered at all.
This included remote systems where the wetback and storage heater are not adjacent (over/under systems), and indirect systems where a heat exchanger is used to enable mains-pressure hot water to be delivered to the end user. Neither of these once-common systems are mentioned in any of the official compliance documents.
Many manufacturers’ guides (that is, manufacturers of water heaters and wetbacks) actually do give instructions, but these often fall outside the parameters of the existing codes and standards, and differ so widely (even for identical situations) that it is impossible to reconcile them. When we approached some of these manufacturers, they were unable to enlighten us as to the source of their recommendations, and, in some instances, admitted them to be based on hearsay or personal experience of a staff member.
Some of the installation recommendations seemed to be potentially dangerous, so we felt it important to obtain accurate empirical data from which to draw reliable conclusions and make recommendations to industry and standards-setting bodies to enable new rules to be enacted covering all types of systems based on verifiable evidence.
Garry Cruickshank, Lead Researcher
Aims and objectives
The original aim of the research was to simply test a variety of pipe configurations, with the following variable factors:
– Pipe diameter.
– Distance between heat source and water cylinder to determine optimum and maximum distances (should they exist).
– Height above heater to cylinder connections, i.e., rise – also to determine optimum and maximum rises.
And, in addition:
– To test different scenarios and configurations for systems separated by rooms or doorways (over/under systems), for which no data exists, and on which the compliance documents are silent.
– To compare the performance of direct and indirect (with heat exchanger) systems, for which no data or rules exist.
– To gather data on different commercially available wetback elements (water jackets), to determine if manufacturer-published outputs are accurate, and determine if any specific design may be best suited to a specific purpose.
– After analysing these results, prepare reports and recommendations to Standards NZ and the MBIE to facilitate changes to the Building Code and relevant Standards.
– Rewrite teaching materials, alter training packages and include new chapters in various textbooks.
However, when we started to run practical tests on our research rig, we discovered a number of assumptions based on accepted industry norms to be unsupported by the gathered data. This forced us to repeat a number of tests to confirm the results, while at the same time running newly designed tests in order to try out alternative solutions not previously considered. This had the effect of taking a considerable amount of extra time, as well as changing the focus from simply gathering data on known systems, to comparing that data to new systems.
By the end of the year, we were able to accurately predict what would happen under certain circumstances, if a particular heating method was used in an adjacent system. An understanding of the physics involved in heating water to very high
temperatures (above 112°C) and the forces involved in moving that water through pipes using temperature differentials and steam pressure gave us new insights into the causes of known phenomena.
None of this information was previously available, and we now believe we have the basis for postulating previously unexplored principles and theories in this field.
Methodology
As the purpose of the research was to determine the efficacy of different pipe configurations and heat-transfer systems, it was imperative that the method used to heat the water be absolutely consistent – without which the data would be worthless.
The method did not need to accurately reflect a standard wood burner (if such a thing could be defined), but rather ensure that the same energy input was used over the same period. A consistent temperature, for each configuration tested, was essential to enable accurate comparisons of configurations. This one factor may explain why there appears to be no such data available anywhere in the world.
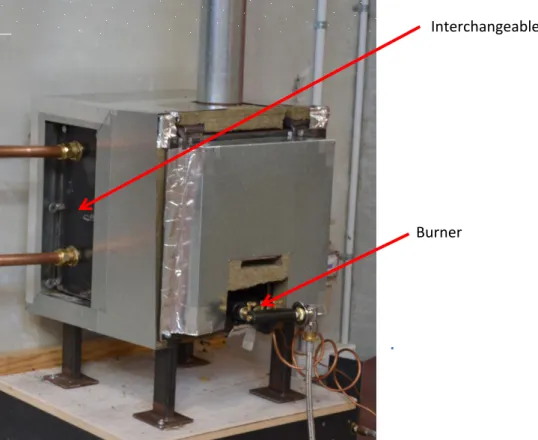
As a normal wood-burner output is erratic and inconsistent, depending on type, moisture content and amount of wood burned, we decided to design, build and use a gas burner in a custom-built fire box, which could be calibrated and checked for consistent energy input for each test. We needed access to the burner, as well as the ability to change the wetback type without having to alter the pipe work every time we did that. To that end, we designed and built our own firebox, which incorporated a hinged door with adequate ventilation for combustion air, and an interchangeable side panel to which different wetbacks could be fitted. We then encased the unit with 50 mm-thick high-density fibreglass insulation, which we held in place with sheet-metal casing.
Figure 2. Firebox designed and built for the study.
12
Interchangeable plate
Burner
.
Figure 2. Firebox designed and built for the study.
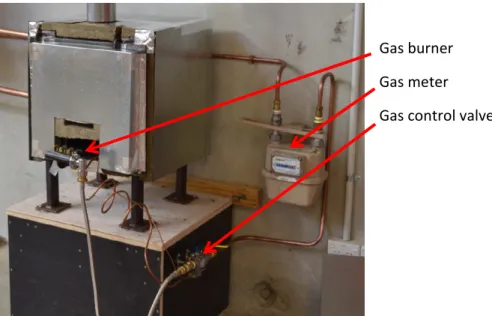
An off-the-shelf cast-iron gas burner was purchased, and tested using a gas meter in the Unitec gas lab. The burner was labelled as having an output of 40 MJ/h, but testing showed the consumption (input) to be 30 MJ/h – out by 25%! Garry, a licenced gasfitter, rectified this by drilling out the injectors and retesting the burner, until we were satisfied it had an input of 40 MJ/h. A burner safety-control unit was fitted, consisting of a thermo-electric flame-failure device (thermocouple) and pilot flame, and this was connected to a manual gas valve. We installed a standard LPG regulator and pigtail arrangement, and ran a gas line through a standard gas meter before connecting it to the burner using a flexible hose connector. This enabled us to measure the gas pressure both at the meter and at the outlet of the control valve, and to measure gas consumption using the gas meter and a stopwatch.
An off-the-shelf cast-iron gas burner was purchased, and tested using a gas meter in the Unitec gas lab. The burner was labelled as having an output of 40 MJ/h, but testing showed the consumption (input) to be 30 MJ/h – out by 25%! Garry, a licenced gasfitter, rectified this by drilling out the injectors and retesting the burner, until we were satisfied it had an input of 40 MJ/h. A burner safety-control unit was fitted, consisting of a thermo-electric flame-failure device (thermocouple) and pilot flame, and this was connected to a manual gas valve. We installed a standard LPG regulator and pigtail arrangement, and ran a gas line through a standard gas meter before connecting it to the burner using a flexible hose connector. This enabled us to measure the gas pressure both at the meter and at the outlet of the control valve, and to measure gas consumption using the gas meter and a stopwatch.
Figure 3. Firebox showing gas burner, meter and control valve.
13
Gas burner
Gas meter
Gas control valve
Figure 3. Firebox showing gas burner, meter and control valve.
New Zealand uses a commercial blend of LPG, consisting of 60% propane and 40% butane (by weight, not volume) and an energy content (calorific value) of 104 MJ/M3, approximately 50 MJ/kg.
Gas was regulated to the meter at a pressure of 2.75 kPa (standard LPG operating pressure) and consumption calculated using the following formula.
V = 0.01 x 3,600 = m3/h Seconds
where 0.01 is one complete revolution of the meter test dial 3,600 is seconds in an hour
Seconds is the number of seconds taken to complete the revolution Pressure correction can then be applied using Boyle’s Law:
P1V1 = P2V2
P1 is the initial or pipeline pressure P2 is the atmospheric or base pressure V1 is the volume measured by the meter V2 is the true or corrected volume
All the above using absolute pressure (not gauge pressure), we transpose the formula to read:
P1V1 = V2
P2
where P1 is 104.075 (atmospheric plus 2.75 kPa) P2 is 101.325 (atmospheric pressure)
V1 is volume as measured above.
This gives the corrected volume of LPG gas used in m3/h, which is then multiplied by the heat value of 104 MJ/m3 to express heat input to the burner in MJ/h.
New Zealand uses a commercial blend of LPG, consisting of 60% propane and 40%
butane (by weight, not volume) and an energy content (calorific value) of 104 MJ/m3, approximately 50 MJ/kg.
Gas was regulated to the meter at a pressure of 2.75 kPa (standard LPG operating pressure) and consumption calculated using the following formula.
where 0.01 is one complete revolution of the meter test dial 3,600 is seconds in an hour
Seconds is the number of seconds taken to complete the revolution
Pressure correction can then be applied using Boyle’s Law:
P1 is the initial or pipeline pressure P2 is the atmospheric or base pressure V1 is the volume measured by the meter V2 is the true or corrected volume
13
Gas burner
Gas meter
Gas control valve
Figure 3. Firebox showing gas burner, meter and control valve.
New Zealand uses a commercial blend of LPG, consisting of 60% propane and 40% butane (by weight, not volume) and an energy content (calorific value) of 104 MJ/M3, approximately 50 MJ/kg.
Gas was regulated to the meter at a pressure of 2.75 kPa (standard LPG operating pressure) and consumption calculated using the following formula.
V = 0.01 x 3,600 = m3/h Seconds
where 0.01 is one complete revolution of the meter test dial 3,600 is seconds in an hour
Seconds is the number of seconds taken to complete the revolution Pressure correction can then be applied using Boyle’s Law:
P1V1 = P2V2
P1 is the initial or pipeline pressure P2 is the atmospheric or base pressure V1 is the volume measured by the meter V2 is the true or corrected volume
All the above using absolute pressure (not gauge pressure), we transpose the formula to read:
P1V1 = V2
P2
where P1 is 104.075 (atmospheric plus 2.75 kPa) P2 is 101.325 (atmospheric pressure)
V1 is volume as measured above.
This gives the corrected volume of LPG gas used in m3/h, which is then multiplied by the heat value of 104 MJ/m3 to express heat input to the burner in MJ/h.
13
All the above using absolute pressure (not gauge pressure), we transpose the formula to read:
where P1 is 104.075 (atmospheric plus 2.75 kPa) P2 is 101.325 (atmospheric pressure) V1 is volume as measured above.
This gives the corrected volume of LPG gas used in m3/h, which is then multiplied by the heat value of 104 MJ/m3 to express heat input to the burner in MJ/h.
PIPE VOLUMES
We reasoned that the movement of water through a given length of pipe by a set amount of energy would be affected by the volume of water within that pipe, so we wanted to know exactly what that volume was. We therefore needed to measure the exact (as near as we could) volume of each piece of pipework. We used standard- gauge copper pipe; however, standard-gauge copper in New Zealand is not standard everywhere, given we are one of only three countries that measure our pipes by internal diameter (ID) not external diameter (ED). Further, the pipe diameters are nominal, rather than exact. The only relevant table we could find in any of the standards was in AS/NZS 5601.1.2013, Table D1, which gives the following volumes per metre.
Figure 4. AS/NZS 5601.1.2013, Table D1, pipe volumes per metre. Copyright in AS/NZS 5601.1.2013 is Standards Australia Limited and Crown copyright, administered by the New Zealand Standards Executive. Reproduced with permission from Standards New Zealand, on behalf of New Zealand Standards Executive, under copyright licence LN001457.
Gas burner
Gas meter
Gas control valve
Figure 3. Firebox showing gas burner, meter and control valve.
New Zealand uses a commercial blend of LPG, consisting of 60% propane and 40% butane (by weight, not volume) and an energy content (calorific value) of 104 MJ/M3, approximately 50 MJ/kg.
Gas was regulated to the meter at a pressure of 2.75 kPa (standard LPG operating pressure) and consumption calculated using the following formula.
V = 0.01 x 3,600 = m3/h Seconds
where 0.01 is one complete revolution of the meter test dial 3,600 is seconds in an hour
Seconds is the number of seconds taken to complete the revolution Pressure correction can then be applied using Boyle’s Law:
P1V1 = P2V2
P1 is the initial or pipeline pressure P2 is the atmospheric or base pressure V1 is the volume measured by the meter V2 is the true or corrected volume
All the above using absolute pressure (not gauge pressure), we transpose the formula to read:
P1V1 = V2
P2
where P1 is 104.075 (atmospheric plus 2.75 kPa) P2 is 101.325 (atmospheric pressure)
V1 is volume as measured above.
This gives the corrected volume of LPG gas used in m3/h, which is then multiplied by the heat value of 104 MJ/m3 to express heat input to the burner in MJ/h.
We were to use 15 mm, 20 mm and 25 mm in our research, but were unwilling to accept the volumes without checking the veracity of the figures supplied, which is just as well given they were out by between 6% and 11%.
We measured the volume by cutting exactly 1.0 m of each size of pipe and blanking off one end, then filling it with water and emptying that into a calibrated measuring container. We did this 10 times, then measured that volume and divided it by 10. This gave us the volume of water in any metre of pipe measured in millilitres per metre (ml/m).
TABLE 1. CLAIMED PIPE VOLUMES VS ACTUAL PIPE VOLUMES.
Pipe diameter Claimed volume per metre AS/NZS 5601.1 2013 (millilitres)
Actual volume in millilitres
15 mm 130 138
20 mm 280 310
25 mm 500 550
We used this information to calculate the capacity of each of the commercial wetbacks we had purchased (totalling the measured lengths of each section of pipe). To check these volumes, we filled each wetback with water using the same process as above (10 fills totalled and divided by 10). This gave us an accurate volume for each wetback model.
SURFACE AREA OF PIPES
Having determined the capacity (volume) of the pipes, we decided we would also need to determine the surface area of the pipe we intended to use, as this is the primary factor in heat loss. To achieve this, we cut a length of pipe exactly 100 mm long (or as close as we could manage), split it down the middle, flattened it out and carefully measured it. This gave us the surface area of 100 mm of copper pipe in each of the sizes we were to use.
TABLE 2. SURFACE AREA OF PIPES.
Nominal pipe diameter Surface area of pipe
Per 100 mm Per metre
15 mm 4,300 mm2 43,000 mm2
20 mm 6,300 mm2 63,000 mm2
25 mm 8,200 mm2 82,000 mm2
EFFICACY OF WETBACKS
We purchased three commercially available wetbacks, representing the three most common designs. We will refer to them as the loop, the box and the ladder type, though there are many variations of these available.
Product data for each commercially manufactured wetback included specific outputs ranging from 1.0 kW to 3.0 kW. However, we struggled to understand how these claims could be made, given the variable inputs of a solid-fuel heater, so we asked the manufacturer how these figures were arrived at. He replied that when he bought the company, he found the figures in a drawer, so assumed they were correct! He went on to admit that, to his knowledge, no testing had ever been done.
With this in mind, we wondered whether a general rule could be devised to determine the relative efficiency of different models of wetbacks, and as one did not seem to exist, decided to invent one – we propose the following:
For heated water to begin to circulate (by thermosyphon), the water in the wetback must reach a temperature whereby the density difference overcomes the friction and mass of the static water. Given a constant input (energy) and a common material, the faster the water heats up the sooner it
should start to function.
Therefore, for any heat input and wetback material, the circulation of heated water from the wetback should occur fastest when the wetback provides the largest surface area and the smallest volume of water. The formula we devised is described below:
Surface area (in mm2) divided by volume (in ml) = N. The greater this number, the more efficient the heat transfer. We decided to call this the Cruickshank (or C) number … because … well … we could!
As discussed at the beginning of this paper, not all wetbacks need to be highly efficient, as the more heat removed from the combustion chamber to heat water the less efficient the combustion process, the higher the level of pollutants generated, and the less heat available for the primary function of space heating. In many cases, therefore, a wetback with a very small output might be preferable as a hot-water booster only, but in some cases a greater heat output is desired for quick hot-water recovery.
We then calculated the surface area of each wetback and, using the formula described above, found the Cruickshank number for each wetback unit. This showed that higher C numbers were consistent with greater measured outputs.
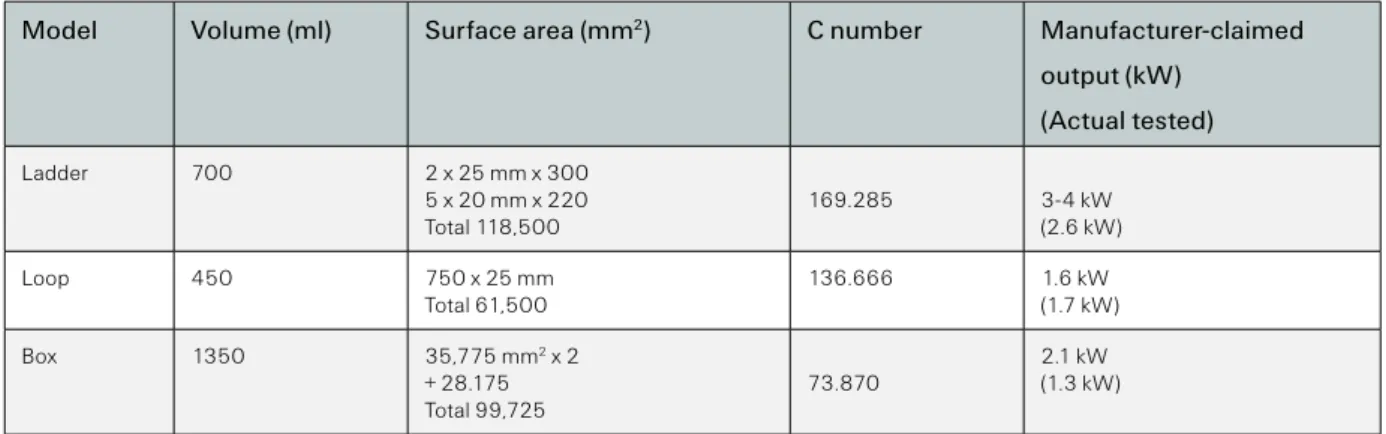
TABLE 3. C NUMBER COMPARED TO MANUFACTURER-CLAIMED OUTPUT FOR COMMERCIALLY AVAILABLE WETBACKS.
Model Volume (ml) Surface area (mm2) C number Manufacturer-claimed output (kW)
(Actual tested)
Ladder 700 2 x 25 mm x 300
5 x 20 mm x 220
Total 118,500 169.285 3-4 kW
(2.6 kW)
Loop 450 750 x 25 mm
Total 61,500 136.666 1.6 kW
(1.7 kW)
Box 1350 35,775 mm2 x 2
+ 28.175 Total 99,725
73.870 2.1 kW
(1.3 kW)
Having determined that the formula appeared to be credible, at least in relation to manufacturer-claimed output, we then set about (as an exercise) seeing whether we could design a better wetback – one specifically designed to extract the maximum heat. This was not difficult to do, as the ratio of area to volume is improved by simply reducing the diameter of the pipes and including more of them. We came up with several theoretical designs we figured would be more efficient than any currently on the market, and even started to build a couple, but in the end decided that this was not the purpose of our research, and that others could do that if they wished.
However, to prove the point, we did build one, based on the ladder design (subsequently called the Unitec Ladder). The Unitec Ladder wetback design reduced the top and bottom pipes to 20mm, linked by as many 15mm pipes as could be fitted.
The C number for this wetback is shown in Table 4.
TABLE 4. C NUMBER FOR THE UNITEC LADDER WETBACK.
Model Volume (ml) Surface area (mm2) C number Manufacturer-claimed output (kW)
Unitec Ladder 600 2 x 20 mm x 340
11 x 15 mm x 230
Total 151,630 252.716 N/A
Testing of this unit (detailed later in the report) in fact did confirm that our design was the most efficient, and after a series of tests under various conditions to set a baseline for comparisons for the actual wetbacks, we ended up conducting the majority of the research on pipe configurations using the Unitec Ladder.
MEASUREMENT AND RECORDING OF RESULTS
The purpose of a wetback is to heat water, so to ascertain the efficiency of each configuration had to involve measuring temperature rise over time. Not all the water in the storage vessel is heated at once, and it is known that a certain amount of stratification occurs within most hot-water storage systems, so we had to decide how to measure results. We were also very keen on measuring actual flow, to determine how much of the flow was uniform, and how much, if any, was due to surges often anecdotally ‘observed’ in wetback systems.
Following extensive consultation with a number of industry specialists, it was determined that the flow rates would be far too small to allow monitoring with any currently available technology, and certainly within the price range the project could afford. So we settled on measuring the temperature using the very latest state-of-the-art data logger, an Almemo 5690-2M, supplied and calibrated by Teletherm Instruments Ltd. The data logger was set up to record readings from eight different thermocouple temperature sensors.
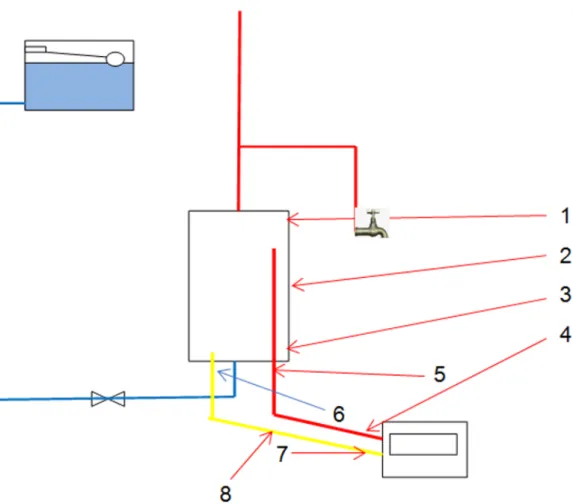
After some experimentation, we placed the sensors in the following places:
1. Top of the HWC.
2. Centre of the HWC.
3. Bottom of the HWC.
4. Flow pipe as close as possible to the firebox.
5. Flow pipe as close as possible to the HWC.
6. Return pipe as close as possible to the HWC.
7. Return pipe as close as possible to the firebox.
8. Initially inside the firebox to determine temperature.
a. After we had proven the consistency of the temperature in the firebox, this thermocouple was moved to the centre of the return pipe.
Although there were insufficient sensors to allow extremely accurate measurement of total heat input into the water, we used a method that gave what we believe to be more than adequate estimates for comparative purposes, using the following method.
1. Measure the water temperature in the HWC at points 1, 2 and 3.
2. Add these together and divide by three to obtain an HWC average start temperature.
3. Measure water temperature at these same three points at set intervals, and repeat the averaging process each time.
4. Calculate average temperature rise.
This gave us two different measurements. Using the specific heat of water, we could determine fairly closely how much heat had been transferred into the entire volume of water, and by calculating the total energy used by the burner (see above) and subtracting one from the other, we could determine the output of the wetback.
Secondly, a simple comparison of the average temperature rise after a set time would indicate what difference, if any, a new or different configuration made.
TABLE 5. COMPARISON OF THE AVERAGE TEMPERATURE RISE, CONFIGURATIONS 1 AND 2, AFTER A SET TIME.
Start temperature at three positions on the HWC
Temperature after 5 hours Average temperature rise
Configuration 1 1. 15°C
2. 13°C 3. 11°C Average 13°C
1. 65°C 2. 60°C 3. 52°C Average 59°C
59 – 13 = 46°C
Configuration 2 1. 12°C
2. 11°C 3. 10°C Average 11°C
1. 66°C 2. 62°C 3. 60°C Average 62.66°C
62.66 – 11 = 51.66°C
In this example, the temperature rise in Configuration 2 was 5.66°C greater than in Configuration 1 – an improvement of 12.3%.
By placing the sensors where we did, we could also measure, with reasonable accuracy, the speed of the water flow, so if a pocket of water at, say, 90°C passed Sensor 5, we could see how long before it hit Sensor 6, three metres away. If it took 10 seconds, then the water was moving at 3.3 metres a second. By knowing the volume of the pipe (see
Figure 5. Positions of thermocouple temperature sensors.
above) we could estimate the flow volume.
To calculate the output of the wetback, we first calculated the total energy input to the burner (heater).
Rated input = 40 MJ/h x 6 hours = 240 MJ
Specific heat of water = 4.2 kJ x 180 litres x 46°C rise = 34,776 kJ
Which = 34.776 MJ over 6 hours, or 5.796 MJ/h
There are 3.6 MJ/h in 1 kW, so the input of the wetback in this case is:
5.796 ÷ 3.6 = 1.61 kW
This equates to about 14.49% of the total energy in the firebox being transferred to the water through the wetback.
During early stages of the research, we set the measuring intervals at 30 seconds and ran each test for six hours, believing that would give us sufficient evidence for comparative evaluation. While this certainly enabled many of the initial basic questions to be answered, it also raised a number of others, including the fact that we were seeing unexpected temperature spikes between readings that were not being captured with a 30-second interval.
We also became curious as to whether things might change if we continued heating the water to boiling point; therefore, we changed to 8-hour test cycles and 10-second recording intervals.
The results surprised us, and caused us to repeat some of the earlier tests for the longer duration.
With eight temperature sensors reading at 10-second intervals, we recorded 2,880 data points per hour, or 23,040 over an 8-hour test. These raw data were then imported into Microsoft Excel spreadsheets and converted to graphs. The graphs provide a visual comparison of the numbers, but importantly, also reveal a great deal about the processes at play within each system tested.
In addition to the electronic data, which simply recorded temperature, we also printed forms upon which we recorded the temperature at each point at 15-minute periods. We also noted such things as when noises became audible and when steam or boiling water was expelled. This enabled us to keep a running tab on comparative performance, and after a while we could predict with a degree of accuracy when certain things would happen. These forms have been scanned and are identified as Scanned Forms, and can be viewed by contacting the corresponding author via the publisher.
RESOURCES
A number of organisations and suppliers were very generous in contributing materials and time to our project.
Foremost was Rheem New Zealand Limited, the largest manufacturer and supplier of water heaters in the country, who donated three water heaters for the project. Here is a summary of all donated items:
– A 180-litre low-pressure HWC with 25 mm wetback connections (bottom entry).
– A new (and at that stage unreleased) 180-litre stainless-steel dual-coil mains- pressure HWC. This had coils designed for both a wetback and a solar water heater
to be connected simultaneously.
– A 135-litre low-pressure HWC with 25 mm wetback connections (bottom entry).
– In addition, an Elephant brand mains-pressure indirect HWC, also 180 litres.
– As three of the HWCs were nominally 180 litres, we allowed that a direct comparison between them was reasonable and treated the 135-litre model as a separate case.
– Prior to July 2015, most of our tests were done on 180-litre models with only a couple done on the 135-litre unit, but after July 2015 all our tests were done on the 135-litre unit.
– A commercially available mechanical ‘surge valve’ designed to increase the efficiency of wetbacks, which we had agreed to test for the manufacturer.
– Ten lengths of 25 mm copper pipe donated by Manukau Institute of Technology plumbing department. (This was damaged pipe, having fallen off a truck, and had earlier been donated to MIT for training purposes by a pipe supplier).
– A quantity of 20 mm and 15 mm copper pipe, fittings and consumables, LPG, lagging and numerous items of sundry equipment borrowed or otherwise obtained from Unitec, occasionally by official means.
WATER SUPPLY TO SYSTEM
The building in which the research project was housed was – it has now been demolished – a specially designed training facility for plumbing and gasfitting apprentices at Unitec, and thus had on hand all the tools and equipment required to undertake the work, as well as a ready supply of apprentices for the purpose of heavy lifting when needed. The training facility had at its heart a rainwater capture system, which harvests and recycles rainwater for training systems. We were able to hook into this supply, so when we dumped the water after use we weren’t wasting town water supply.
The facility had a long, high concrete wall upon which we could run pipe, and up which we could fix the vent pipe. There was also a mezzanine that gave ready access to the higher reaches of the system.
We supplied the HWC and wetback systems from a 135-litre supply tank situated directly above the heater, with a measured head of approximately 4.5 m. The reason we used a tank supply rather than the more common valve-fed system was simply to ensure consistency in results. We were not attempting to replicate real-life conditions (though we did as closely as practicable), but to gather data for comparative purposes, which required exactly the same conditions to be applied every time. We felt a supply tank with a known head was best able to provide that consistency.
With the exception of one factor, we do not believe the results would have been any different had we used a pressure-reducing (PR) valve, but if anyone feels that may be the case we would welcome further research on that point. That exception is the fact that as the water heated it expanded, and was able to push back up the supply pipe into the supply tank; a PR valve incorporates a non-return valve and does not allow the water to do that. To replicate this situation, we placed a non-return valve in the supply line at various times and recorded the (comparative) results.
After a number of tests, we found that – depending on the type of HWC or how it was connected, and how hot the water got (length of trial) – some very spectacular
and exciting things happened. This was a combination of loud bangs, crashes, whistles and thuds, accompanied by copious quantities of steam or boiling water being ejected from various orifices when least expected. Later on, we expected them. At one point the entire top of the building filled with steam, setting off the fire alarm and causing the building to be evacuated, and we had to wait outside for the fire service to come and turn the alarm off.
We were instructed by management not to set the alarm off again or they would cancel the research, so we disconnected the alarm, which had the desired effect.
When these events began to happen, we thought it prudent to add to our system certain devices to enable us to measure some of these effects.
These included lengths of transparent plastic tube, expansion chambers, and a number of interlinking (valved and un-valved) pipes to enable the escaping water to be captured and measured. These were held in place by a variety of bits of string, tape and other bits of pipe. It looked a bit Heath Robinson, but it worked. As a result, we had an endless stream of visitors who would drop by, witness the above accompanied by noise and steam, and always ask the same question: “Do you know what you are doing?”
In the end we posted a notice stating the following, which we simply pointed at, and they normally went away:
Stupid question. Of course we don’t know what we are doing.
If we knew what we were doing, it wouldn’t qualify as research.
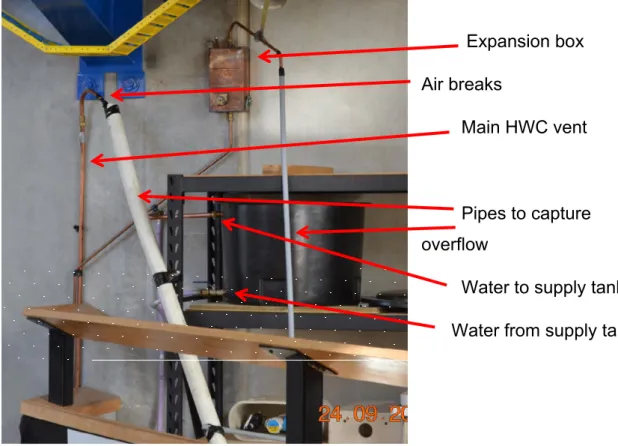
Figure 6. How we measured water expelled during heating cycle.
21 When these events began to happen, we thought it prudent to add to our system certain devices to enable us to measure some of these effects.
These included lengths of transparent plastic tube, expansion chambers, and a number of
interlinking (valved and un-valved) pipes to enable the escaping water to be captured and measured.
These were held in place by a variety of bits of string, tape and other bits of pipe. It looked a bit Heath Robinson, but it worked. As a result, we had an endless stream of visitors who would drop by, witness the above accompanied by noise and steam, and always ask the same question: “Do you know what you are doing?”
In the end we posted a notice stating the following, which we simply pointed at, and they normally went away:
Stupid question. Of course we don’t know what we are doing.
If we knew what we were doing, it wouldn’t qualify as research.
Expansion box Air breaks
Main HWC vent
Pipes to capture overflow
Water to supply tank Water from supply tank
Figure 6. How we measured water expelled during heating cycle.
Results and findings
We attempted to undertake the research on a logical basis, by first testing the four wetbacks on a basic adjacent HWC with a minimum rise/fall on the flow and return pipes. By using the same pipework, etc., the only thing changing would be the wetback itself, so a direct comparison and calculation of output could be made. The data could then be used as a baseline for all future configurations.
Our first set of tests involved connecting the heater to the 180-litre low-pressure (LP) HWC using 25 mm pipes – a basic configuration covered in both compliance documents. A stand was constructed
Results and findings
We attempted to undertake the research on a logical basis, by first testing the four wetbacks on a basic adjacent HWC with a minimum rise/fall on the flow and return
pipes. By using the same pipework, etc., the only thing changing would be the wetback itself, so a direct comparison and calculation of output could be made. The data could then be used as a baseline for all future configurations.
Our first set of tests involved connecting the heater to the 180-litre low-pressure (LP) HWC using 25 mm pipes – a basic configuration covered in both compliance documents. A stand was constructed for the firebox to replicate a domestic solid-fuel heater installed on a suspended wooden floor (this was not changed from then on).
Another stand, with adjustable height, was constructed for the HWC, which we initially placed at a measured height that provided the flow and return pipes the minimum possible rise and fall. We placed the HWC exactly 1 m from the firebox, so we could use that measurement as a comparative base.
We then heated the water for six hours, taking readings throughout, then emptied the HWC and refilled it with cold water, allowing it to cool down overnight. This
procedure was repeated with each of the four wetbacks with 25 mm, then 20 mm pipe.
Later, the HWC was raised and the tests repeated. This enabled us to determine which wetback and which size pipes worked best, and what difference the amount of gradient had on the efficiency of each unit.
Our initial results for this series of tests showed that the advertised or claimed output for the three commercially available wetbacks was inaccurate, and that, as predicted by our earlier calculation of the C number, the Unitec Ladder was most efficient.
Most of our tests for the first year were done from that position; that is, 1-metre distance, using all four HWCs, and a variety of pipe configurations using both direct and indirect heating methods. Later, we moved the HWC further away horizontally, to a distance of 3 metres, and finally to a full 10-metre distance. In both of those cases we conducted tests with both 20 mm and 25 mm pipes, and with gradients ranging from a 150 mm minimum rise, to as much as a 3-metre rise.
By these means we were able to determine that a number of ‘known’ facts and universally accepted principles and beliefs were in fact unfounded.
The following parameters were investigated:
– Efficacy of different model wetbacks.
– Impact of pipe diameter – 25 mm vs 20 mm.
– Gradient of flow and return pipes.
– Differences in performance due to horizontal distance.
– Comparison of direct vs indirect systems – Two different indirect options:
Thermosyphon through the coil vs water supply through the coil.
– Gradient and configuration of the return pipe.
– Performance of a heat trap vs surge valve on the return pipe.
– Counter connection (flow and return connections reversed).
– Over/under systems using different pipe size and configuration.
During our testing, some of the results seemed to contradict what we had expected based on ‘known facts and principles.’ These ‘known facts’ included:
– Both flow and return pipes must rise and fall with a consistent gradient.
– The flow pipe must be connected, or discharge, as close as possible to the top of
the HWC.
– Thermosyphon (natural convection) is the motivating force – the thing that makes the water move – for wetback systems.
– NOTE: Thermosyphon results from different water densities brought about by temperature differential.
Our research showed that none of these ‘truths’ are in fact correct, at least in their entirety: in particular, we believe we have proved that in some cases specifically, and in all cases, at latter stages in their heating cycles, a completely different force is at play. This ‘other force’ provides the only explanation for the performance of many less-conventional, but once-popular systems, that do not feature in the compliance documents – i.e., over/under systems.
A small number of other unusual scenarios were also tested, and we will report on those results as well.
We also consulted a number of manufacturers and trade bodies that provided instructions. Most were based on G12/AS1, and some were based on NZS 4603, which are listed under References at the end of this paper. Several of these instructions have simply been copied, and repeat the error of referring to the New Zealand Standard as NZS 6403.
SCENARIO 1. TYPES OF WETBACK.
Box type
Ladder (commercial)
Loop type
Unitec Ladder
Figure 7. Types of wetback.
Brief finding of fact
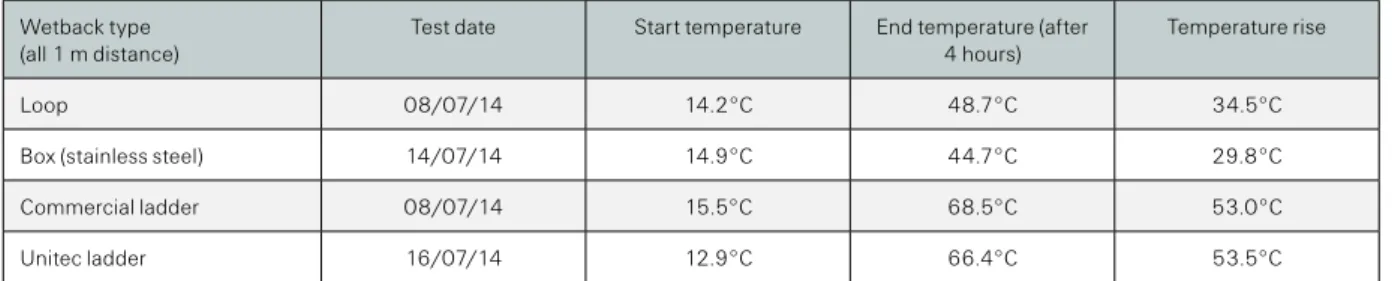
TABLE 6. COMPARATIVE PERFORMANCE OF WETBACKS.
Wetback type
(all 1 m distance) Test date Start temperature End temperature (after
4 hours) Temperature rise
Loop 08/07/14 14.2°C 48.7°C 34.5°C
Box (stainless steel) 14/07/14 14.9°C 44.7°C 29.8°C
Commercial ladder 08/07/14 15.5°C 68.5°C 53.0°C
Unitec ladder 16/07/14 12.9°C 66.4°C 53.5°C
Conclusion
The output of the wetbacks does not match those advertised by the manufacturer. The worst performing was the stainless-steel box, followed by the loop. The Unitec Ladder using 20 mm headers and 15 mm connecting pipes was the most efficient means of transferring heat, having the highest C number but also using smaller pipe (20 mm), so was cheaper and easier to install.
Because of these factors, and to prevent any accusations of favouring particular manufacturers, we decided to conduct all tests from this point using our own manufactured ‘ladder’ arrangement, the Unitec Ladder.
The readings were taken after five hours, although the tests continued for longer.
The reason is that around this time we started to lose water through the vent pipes, which made useful numbers more difficult to obtain.
NOTE: Not every situation wants or needs the most effective wetback, as energy removed from the combustion chamber reduces the efficiency of the wood burner, which in turn produces more particulates and general pollution. This might reduce the efficiency below the legal limits for that model, so a less efficient model is deliberately chosen to prevent this from happening.
SCENARIO 2. UNDER WHAT CONDITIONS, IF ANY, IS 25 MM PIPE BETTER THAN 20 MM PIPE?
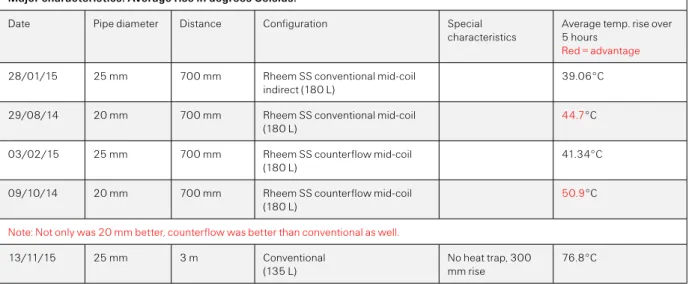
TABLE 7. EXAMPLES OF COMPARATIVE TESTS.
Major characteristics. Average rise in degrees Celsius.
Date Pipe diameter Distance Configuration Special
characteristics