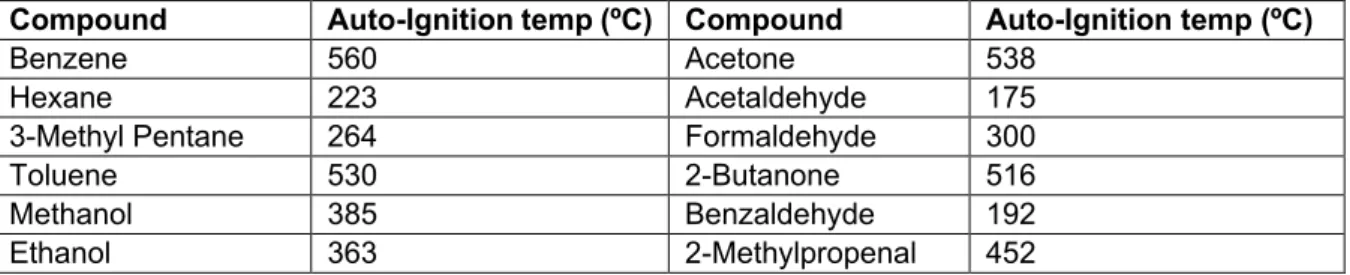
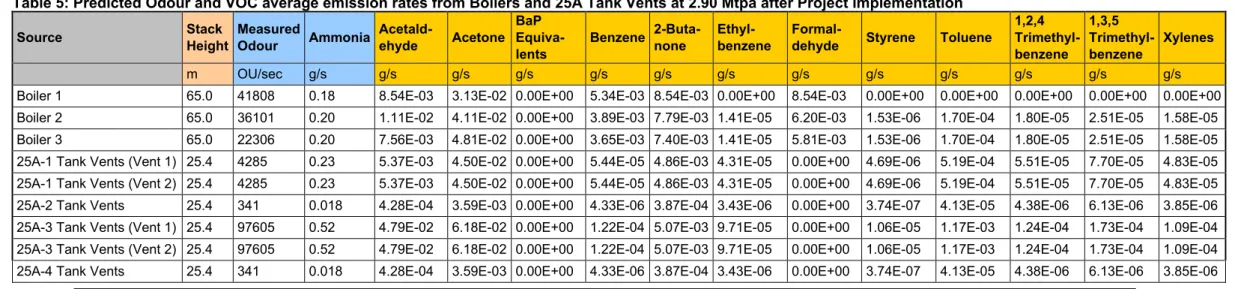
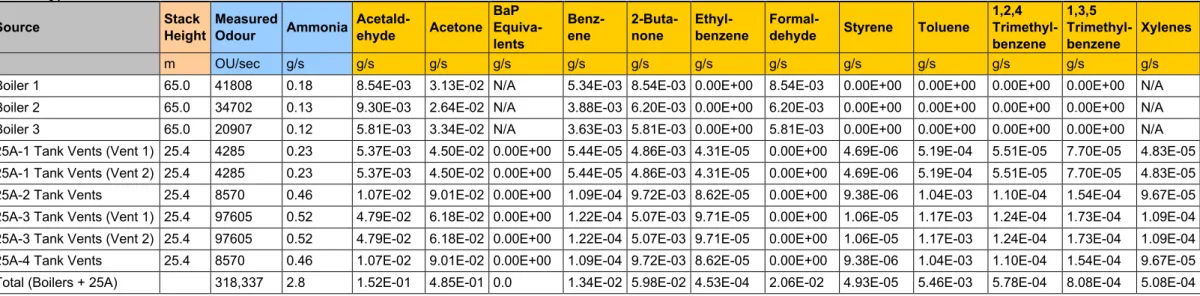
This Environmental Commission Plan applies to 25A-2 and 25A-4 Slurry Storage Tanks and Boilers 2 and 3, for which the emissions will be changed as a result of the work described in Appendix 3B. Of the VOCs listed in the emissions inventory, these compounds account for 80%, 9.5%, and 8.7%, respectively, of the total average VOC emission from the 25A-2 tank. The environmental commissioning plan for the project will focus on these three VOCs (acetone, acetaldehyde and 2-butanone) which are expected to make up the majority of VOC emissions from the slurry storage tanks.

Contents
Overview __________________________________________________________________ 3 2. Related Approvals __________________________________________________________ 5
Overview
Related Approvals
- Ministerial Statements
- Historical Emissions Reductions Projects and Related Production Increases
Approval Request
- Relevant Licence Conditions
- Condition A5
- Conditions A22(a), A22(b) and A27
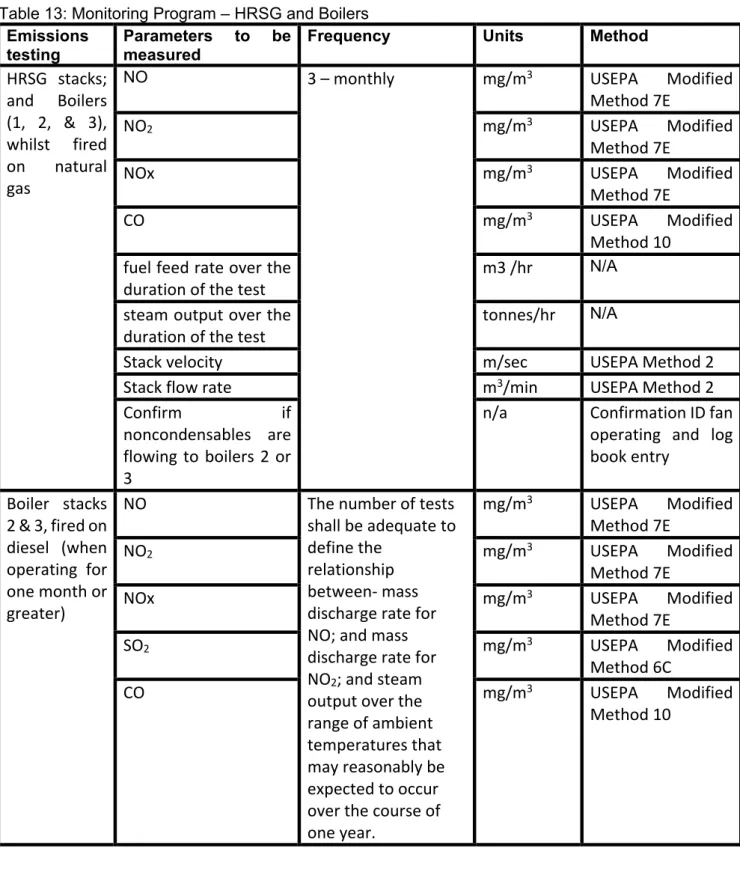
During the construction phase of this project, the existing 35N VOC reticulation system, which conducts gases and steam to the boilers' air supply, will require an estimated shutdown period of between two and three weeks to allow the new infrastructure to be tied into the existing system. The interruption of operation of this system will be planned to ensure that the system is offline for the minimum period possible and has been considered under condition A5 (ii) of the license as a maintenance activity. The permit holder shall provide the Executive Director with a report on the results of the monitoring program specified under condition A22(a), comprising concentrations of the parameters specified in Table 13 of Appendix A and the calculated mass emissions of the parameters specified in Table 13 of Appendix A using measured flow rates of the time of sampling of the parameter, and includes the operating range for each operating parameter.
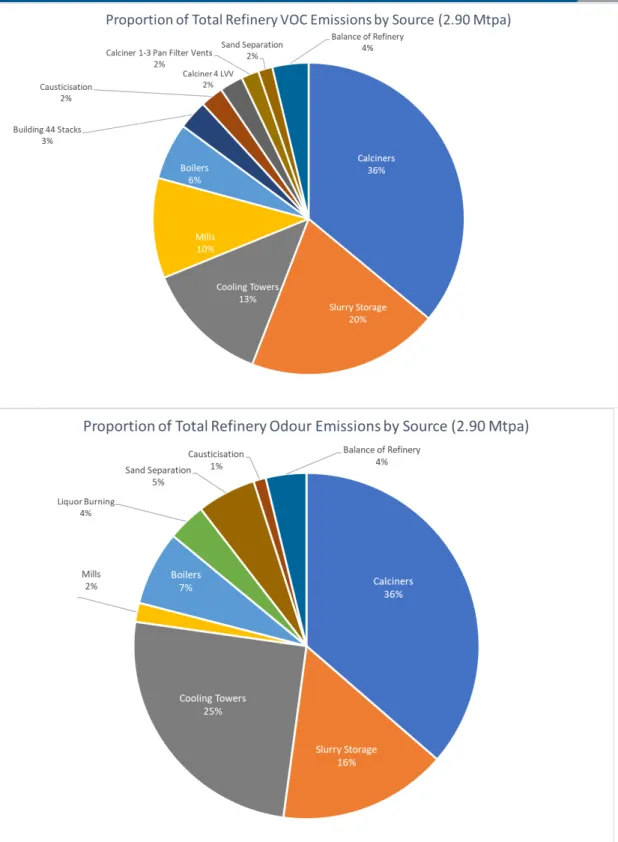
Overview of Refinery VOC and Odour Emissions
As described in Section 3.1 of this document, these License Terms are not intended to be affected by, nor are Alcoa seeking any changes to, these Terms. It is important to note that the increased emission reduction project and increased production scenarios are predicted forecasts. It is expected that this project will achieve an additional 0.14 g/s reduction in VOC emissions beyond what is required to offset a future request for a 5% increase in production.
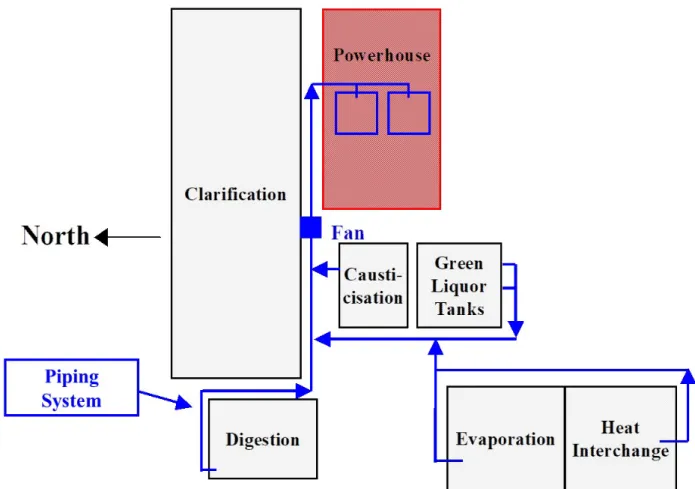
Description of Existing Powerhouse Boilers Vapour Destruction and 35N Reticulation System
The analysis showed that there was no increase in the emitted VOC and odor concentrations from the boiler stacks as a result of the addition of non-condensable gases. The levels of odors emitted from the boiler stacks were comparable to the measurements made before the implementation of the project. Similarly, there was no increase in emission levels of VOC species as a result of the project, suggesting that essentially complete VOC destruction occurred.
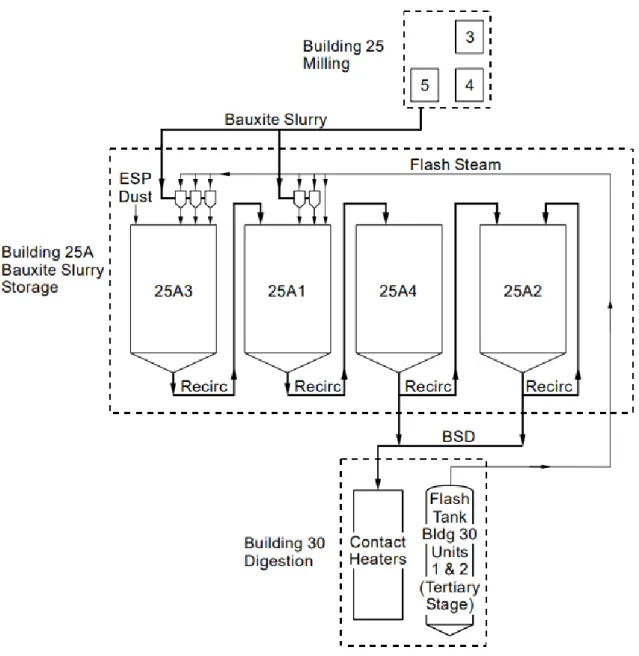
Description of 25A Bauxite Slurry Storage Tanks
The system installed in 2002 resulted in a net reduction of the total VOC and odor emissions from the refinery. Bauxite slurry from the mills in building 25 enters the top of the first storage tank, 25A3. The heating of the slurry, together with the long residence time in the 25A tanks, provide favorable reaction conditions for dehydration.
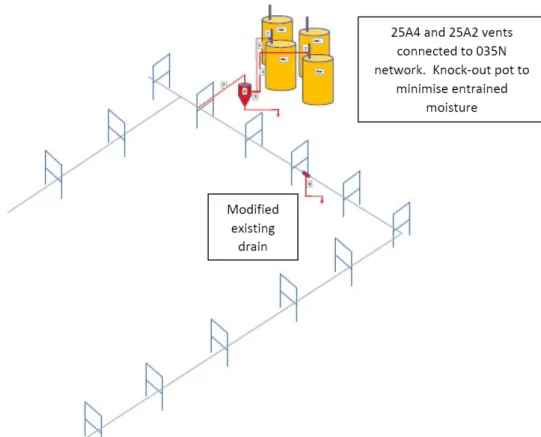
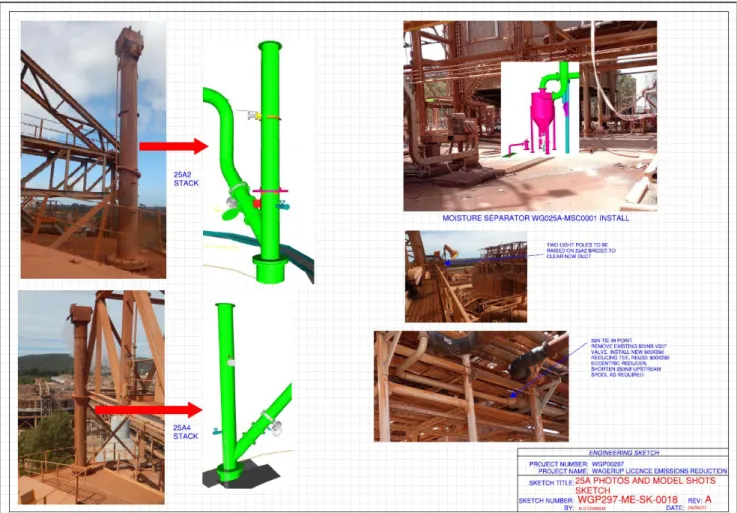
Proposed Modifications to the 25A Bauxite Slurry Storage Tanks
- Mercury Trap
During the initial digestion process that takes place in the 25A tanks, some mercury may vaporize in the vapor stream fed into the 35N system. A small amount of mercury is expected to condense as the vapor from the 25A tank vents cools naturally on its way to the 25A trip pot. It is suggested to include a mercury trap in the ejector pot for mud and moisture removal at the 25A tanks. The design of the knockout pot includes a mercury collection point to facilitate disposal of the condensed mercury by a specialized, controlled waste company.
Proposed Modifications to the 35N Reticulation System
Proposed Modifications to the Powerhouse Boilers
Consultation
- Approvals Consultation
- Regulator Consultation
- Other Consultation
- Appendix A
- Air Emissions _______________________________________________________________ 3 1 Recent development of Air Emissions Inventory, Model and Health Risk Assessment _____ 3
- Air Emissions
- Recent Development of Air Emissions Inventory, Model and Health Risk Assessment
- Impact of Proposed Project to Emission Sources
- Point Source Emissions
- Noise
- Residue and Waste
- Mercury
- Point source emissions to surface water
- Point source emissions to groundwater
- Emissions to Land
- References
- Introduction ____________________________________________________________________ 3 2. Screening Analysis Outcome ______________________________________________________ 3
- Introduction
- Screening Analysis Outcome
- Summary of Detailed Analysis Tools
- Location Review
- Local Topography and Meteorology
- Previous studies relating to odour complaints and meteorological influences
- Screening Distances
- Sensitive Receptors
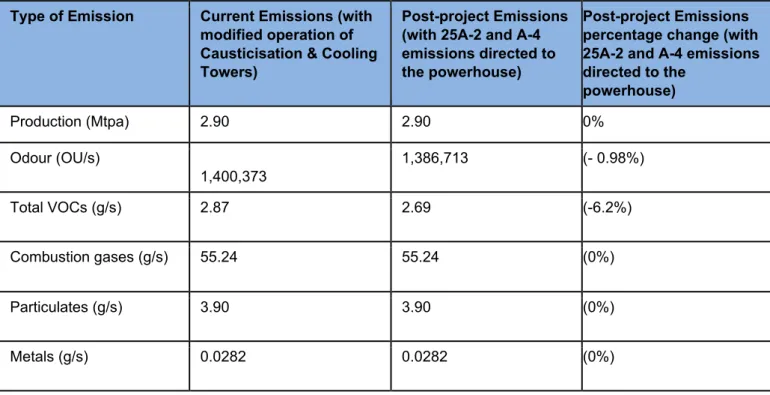
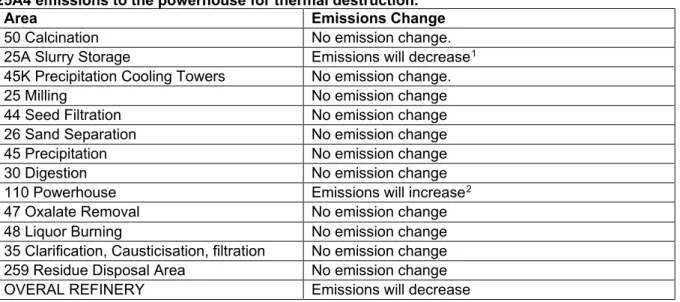
Expected changes to refinery emission sources as a result of the proposed works are outlined in Table 1. The expected impact on total refinery emissions as a result of the proposed works is described in Table 2. No changes in flue gas emissions are expected as a result of the proposed works.
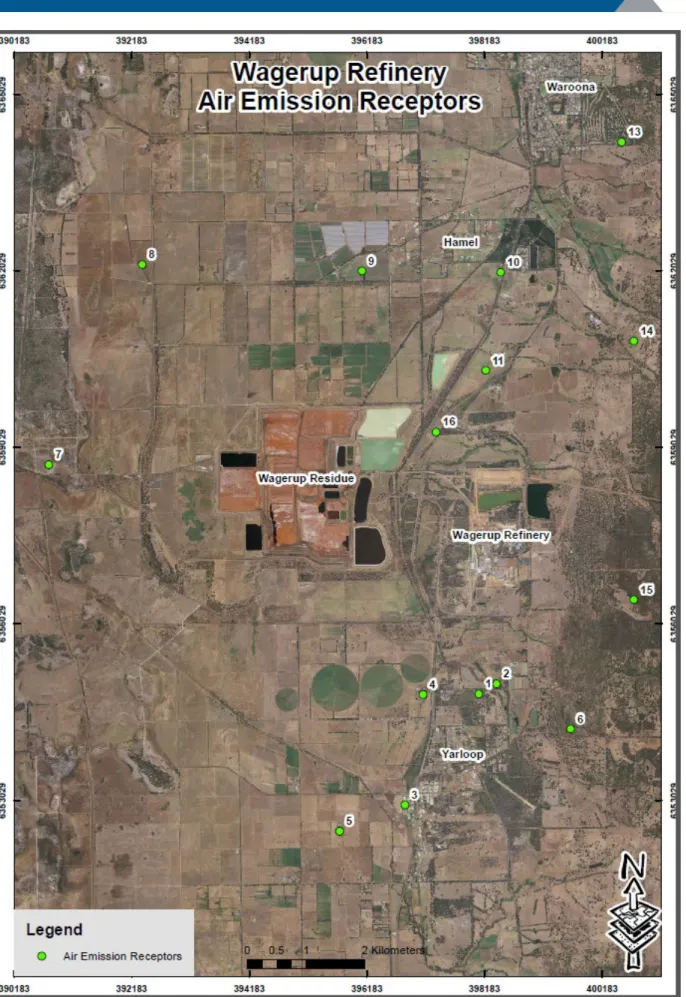
A number of key factors and consequent impacts on air quality events in the vicinity of the refinery have emerged from the studies and investigations carried out. The communities near the refinery include Yarloop, Hamel and Waroona (see Figure 4).
Easting
- Complaints Data Analysis
- Odour Characteristics
- Operational Odour Analysis
- Powerhouse Boilers 2 and 3 (Building 110) – Current Condition
- Slurry Storage Tanks 25A2 and 25A4 – Current Condition
- Powerhouse Boilers 2 and 3 (Building 110) – Proposed Condition
- Slurry Storage Tanks 25A2 and 25A4 – Proposed Condition
- Odour Source Assessment
- Odour Sources
- Odour source information summary .1 Slurry Storage Tanks (25A tanks)
- Odour Field Assessment
- References
12Indirect complaints to the DWER do not include the complainant's actual address when provided to Alcoa, but the street name is provided. Odor sources are classified as “significant” if they emit an odor greater than 1% of total refinery odor emissions. The sources listed in Table 6 are excluded from this OOA because they are known emission sources but are not changed as part of The Project.
Low throughput (feed rate <5000m3/hour) is not expected to change odor emissions for Boilers 2 and 3 compared to normal operation, as the temperature for combustion of the VOCs remains sufficient. Low throughput (feed rate <5000m3/hour) is not expected to change odor emissions for Boilers 2 and 3 compared to normal operation, as the temperature for combustion of the VOCs remains sufficient. The Wagerup Refinery's odor emission profile is expected to change as a result of the proposed project.
Document baseline information, including odor emission levels, for those odor sources that will be altered by the project; and. Slurry tanks have several functions, the main purpose of which is to increase the temperature of the slurry, which accelerates the dewatering reaction. The proposed project will change emissions from 2 of the 4 reservoirs, namely 25A2 and 25A4, which currently have one outlet each.
A report detailing and results of the field evaluation program is included as Appendix C to this document.
Appendix A : Screening Analysis Report
Screening analysis
Complete the questionnaire relevant to the application (for new or existing premises) Step 2: Use the flowchart and questionnaire responses to determine whether a Detailed analysis
Questionnaire
The shielding distance for this industry category and throughput level is specified in Appendix 2.
Flowchart - existing premises
Appendix B: Complaints Data
DWER received a complaint about a strong "wet cement" smell and visible smoke emanating from the Alcoa Wagerup chimneys. It was advised that there was low overhead cloud and a light breeze, mainly from the north, conditions that the neighbor said could contribute to odor retention. Neighbor thought the smell was present around the time of day when the air temperature started to rise after a cool night.
I didn't believe it was related to any other activities going on in the city (forest fire cleanup) and felt it was coming from the refinery. The appellant developed a sore throat, burning eyes and asthma-like symptoms and had to use Ventolin. Complainant reported serious health effects including asthma, sore throat and sore eyes requiring repeated use of Ventolin.
DWER received complaints of a strong caustic odor from the direction of the mud ponds and the refinery, accompanied by eye burns, throat burns, and skin irritation. DWER received complaint of strong caustic odor from direction of mud ponds and refinery, associated with stinging eyes, burning throat/nose and asthma. DWER received a complaint of a strong caustic smell from the direction of the refinery, accompanied by burning throat and nose.
This neighbor had recently complained as they believed that the removal of a group of trees previously planted on a property to the south of his farm helped prevent the smell from reaching their property.
Appendix C : Odour Field Assessment Report
List of Tables
Appendices
Objective
The primary objective of the odor assessment program described in this report is to provide a baseline for odor impacts for current refinery and tailings operations using the most recent DWER-mandated odor assessment methodology to replace previous assessments conducted in 2007-2015. The previous estimates reflected current odor emissions impacts as estimated using the 2002 methodology. Since then, various odor emission controls have been implemented, which are expected to reduce the magnitude of impacts at off-site locations.
Terminology
Previous odour assessments
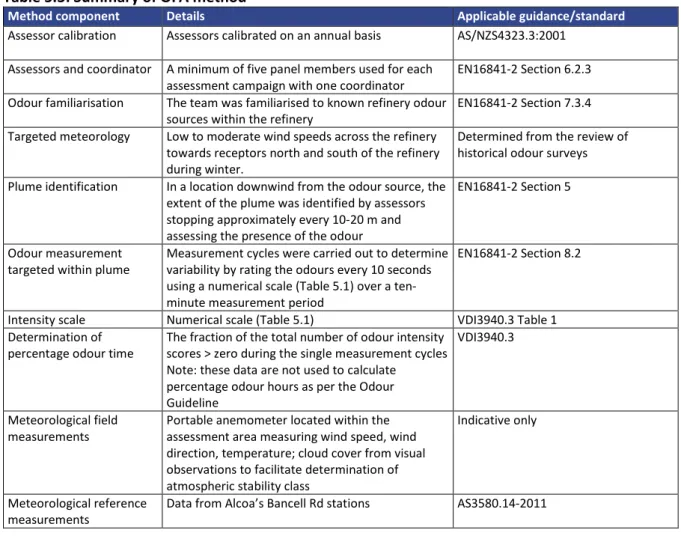
Approach and Methodology
- Odour assessment methodology
- Odour assessors
- Target weather conditions
- Assessment campaigns
- Data visualisation for reporting
Determined by review of historical odor surveys Plume identification At an upwind location from the odor source, the Coordinator was not part of the team of assessors performing the measurement cycles, but was responsible for ensuring that the assessors generated results reliable and not to experience upwind fatigue. Alcoa's three-day weather forecasts and the Bureau of Meteorology's (BOM) 7-day forecast were monitored to identify suitable conditions under which to conduct the measurement cycles.
Winds from the north and south sectors were preferred to assess odors likely to affect the Hamel and Yarloop areas. Measurement cycles were performed starting in the early morning (either just before sunrise or within 2 h after sunrise) to determine the effects of overnight inversion conditions; and continued in the morning in an attempt to capture the effects of the decay of overnight inversion conditions that can cause "fumigation" due to elevated source emissions. Fumigation occurs during clear skies when thermal convection eddies reach cloud height.
The measurement cycles, which were completed on July 8, 2020, did not begin until the afternoon, and the morning was spent completing calibration and administrative requirements. The measurement cycles continued in the afternoon, when wind conditions from a certain direction tended to stabilize. Where possible, cloud tracking was followed to determine the propagation of odors at ground level at various distances downstream from the refinery sources.
The large amount of data collected in this OFA precludes that approach and the results are presented in stacked bar charts to facilitate visualization of the results of each day of the rating campaigns.
Results of odour assessments
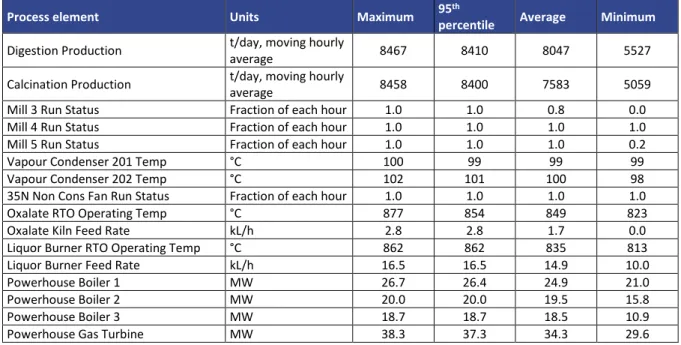
- Refinery operations
- Odour measurement cycle locations
- Method comparison
- OFA Results
- Odour sampling summary 8 July 2020
- Odour sampling summary 11 July 2020
- Non-Alcoa odours
Measurement cycles to the NW of the refinery in mid-afternoon recorded faint odors. In the late afternoon, measurement cycles detected weak odors (OI=1) further along Waterous Road approximately 4 km N from the refinery. Insignificant refinery odor was detected during the afternoon measurement cycles despite attempts to locate the plume north of the refinery directly based on observations of plume direction.
Smoke was detected in some of the afternoon measurement cycles; however, it appears that the odor emanating from the refinery was well dispersed. Very light winds prevented attempts to track the wind southwest of the refinery in the first measurement cycles on the morning of July 11, 2020. Subsequent measurement cycles closer (~800 m) to the southwest corner of the refinery determined that the weak wind was still carried in a SW direction.
In the early afternoon (13:36), the measuring cycles first detected odors towards the SE of the refinery. Winds were somewhat variable on July 30, 2020, as a result of which the measurement cycles ranged from SW to NE of the refinery (Figure 6.10). Light, variable winds in the early morning hours made cloud tracking difficult, and no odors were detected by measurement cycles southwest of the refinery.
Some odor was detected north of the refinery around 08:00 with two measurement cycles recording intensities up to OI=4 with "wet cement".
Comparison of OFA results with Envall 2015 study
Conclusions
Limitations
Alcoa Wagerup Refinery Efficiency Project Current, planned and potential future control measures for volatile organic compounds (VOC) and odor emissions.
Appendix A Meteorology
The document may only be used for the purposes for which the engagement was given and in accordance with the terms of engagement.
FILE NOTE Wagerup Emissions Reduction Project Noise Study
1 INTRODUCTION
2 DESIGN REVIEW
Fan noise
Sound power level of the system fan 35N at the inlet according to the attached data sheet. At the point where the 25 A duct joins the existing system, the predicted sound power level of the internal duct due to fan noise is 59 dB(A). The fan noise from the new 25A duct was found to have a total sound power of 56 dB(A), resulting in a peak sound pressure level of 46 dB(A) at 1 m from the duct.
Regenerated noise
3 SUMMARY AND CONCLUSION
4 RECOMMENDATIONS
Fee Calculation
Works Approval Fee Calculation