~-13/141
EFFECT OF PHYSICAL AND CHEMICAL SEED TREATMENTS ON LEAF SPOT (Bipolaris sorokiniana)
AND GRAIN YIELD OF WHEAT
MD. DUMA YUN KABIR
5tl~r.€.Bangla ~gricu\turol University'
Library
h~Ct~51~n110
.·5~··2>-3,·9···'···
Si9n~" Oa\e
:O-<trrq 1,3
I"
DEPARTMENT OF PLANT PATHOLOGY i?C) '4fi SHER~E~BANGLA AGRICULTURAL UNIVERSITY
DHAKA~1207
__ -- June·2006 --"'\
f ~
I~~~ ~~11111~11"llllIII1
\ .... 37333 ~.
. ')'
..
l'~
EFFECT OF PHYSICAL AND CHEMICAL SEED TREA TMENTS ON LEAF SPOT (Bipolaris sorokiniana)
AND GRAIN YIELD OF WHEAT
By
MD. HUMA YUN KABIR REGISTRATION NO 23956/00194
A thesis
Submitted to the Department of Plant Pathology Sher-e-Bangla Agricultural University, Dhaka
Inpartial fulfillment of the requirements for the degree of
s-
MASTER OF SCIENCE (MS)
IN
PLANT PATHOLOGY Semester: January - June 2006
Approved by:
Dr.
Md. Rafiqul Islam Associate ProfessorCo-supervisor Dr. F. M. Aminuzzaman
Assistant Professor Supervisor
Dr. Md. Rafiqul lslam Chairman
Examination Committee·
This is to certify that the thesis entitled "Effect of physical and chemical seed treatments on leaf spot (Bipolaris sarokiniana) and grain yield of wheat"
submitted to the Faculty of Agriculture; Sher-e-Bangla Agricultural University, Dhaka, in partial fulfillment of the requirements for the degree of MASTER OF SCIENCE IN PLANT PATHOLOGY, embodies the result of a piece of bonafide research work carried out by Md. Humayun Kabir, Registration No. 23956/00194 under my supervision and my guidance. No part of the thesis has been submitted for any other degree or diploma.
I further certify that any help or source of information, received during the course of this investigation has been duly acknowledged.
Dated: 30. 08. 06
Dhaka, Bangladesh Dr. F. M. Aminuzzaman
Assistant Professor Supervisor
Dedicated to My
Beloved Parents
ACKNOWLEDGEMENTS
)I{{ praises, gratitwfe and tfzanf<J are due to tlie omniscient, Omnipresent and' omnipotent jIffali wfw ena6[U[ tlie author to complete tliis thesis successJuffy.
?}ie author expresses liis deepest sense of gratituae, sincere appreciation and immense iMe6tetfness to liis supervisor <Dr. P. :M.. j1.minuzzaman, j1.ssistant professor,
<Department of p{ant Patlio[ogy, Slier.e43ane{a )4gricu{tura{ Vniversity, (])fzak.a,for liis guUfance, constructive criticism and va{ua6[e sUOgestion in successful completion of tlie researcli work. and preparation of tliis thesis. ProfoUM gratitwfe is expressed to liis liorwra6[e co-supervisor (])r. ':Md. <J(afiqufIslam, j1.ssociate Professor and cliairman, (])epartment of PCant Pat{w[ogy, S{r,er-e43ane[aJlgricu[tura{ Vniversity, (])Iia~ for liis scholastic guUfance and. constant inspiration tfiroUfJliout the research. work. and preparation
of
this thesis/Ilie author is fiiefi[y grateful to jIssistantfProj
;M.SaCafituUfin:M.. Cliowdliury, for va{ua6(e sUfJoestions and cooperation aurine tlie stuay period. Tlie author also expresses fiis fieartjefi t{zanf<J to a{[ tfie teacfiers
of
PCant Patfio[ogy (])epartment, SjIV, for tlieir 'Cla{ua6{esuggcstions and' encouragement duri1l{j t{r,eperiodof
tlie stuay.t'[(zan/(Jare eXlerufed to liis
friends
':Md. CR..,asfietfu{Islam, jIifan Jlfi, Jl6u Sayem 94.d.rtaufiUfu[ Islam, fMd )Ijza{ Hossain; Sofic{ 9tl.afimutf and other
frietuls
for ttieir fie[p andI
inspiration. fJfie author wishes to aC~1UYw{edjjefiis liea.:tfe{t indebtedness and profourui respect to tiis fattier 9rf.tf. jlzfuzr )1{i
ana
mother t])au.{otan Nesliafor tlieir sacrifice, 6Cessi1l{js,patience ana encouragement ana for his success.?fz.e author e.x:pressesfiis sincere appreciation to fiis 6rotfier, sisters, relatiues, we{[
unshers ana
jrierufs
for their inspiration, fie(p and encouragement throU{Jliout tlie study.lJ1ie
)lutliorII
EFFECT OF PHYSICAL AND CHEMICAL SEED TREATMENTS ON LEAF SPOT
(BipoiaTis sOTokiniana)AND GRAIN YIELD OF
WHEAT
By
MD DUMA YUN KABIR
An experiment was conducted at the Farm of Sher-e-Bangla Agricultural University, Dhaka during the period from December 2005 to April 2006 to study the effect of physical and chemical seed treatments on leaf spot (Bipolaris sorokinianaj and grain yield of wheat.There were ten treatments viz. farmer's stored seed (TI), apparently healthy seed (T2), farmer's stored seed treated with Vitavax-200 @ 0.4% (T3), apparently healthy seed treated with Vitavax-200 @ 0.4% (T4), fanner's stored seed washed with water (Ts), apparently healthy seed washed with water (T6), fanner's stored seed treated with brine solution @ 2%
(T7), apparently healthy seed treated with brine solution @ 2% (T8), washed farmer's stored seed treated with brine solution @ 2% (T9) and washed apparently healthy seed treated with brine solution @ 2% (TIO). The highest germination was counted 84.20% and 86.08% respectively at 10 and 15 DAS in the treatment T4 and the lowest germination 49.84% and 55.54% at 10 and 15 DAS, respectively was recorded in the treatment TIthat served as control. The lowest disease severity were recorded at panicle initiation stage, flowering stage, milking stage and hard dough _stage under the treatment T4. which were 0.06, 0.19, 0.36 and 0.84, respectively. On the other hand the highest disease severity were recorded at panicle initiation stage, flowering stage, milking stage and hard dough stage under the treatment TI, which were 0.55, 1.21, 1.69 and 2.53, respectively. The highest grain yield (3.5 t/ha) was obtained in treatment T4, which was 75% increased over control (TI).
m
LIST OF ABBREVIATED TERMS
Full name Abbreviation
AEZ et al.
BBS cm
°C
DAS etc FAO
: g
hr kg m
mm
mo MP no.% RCSD SAU m2 TSP Agro-Ecological Zone
And others
Bangladesh Bureau of Statistics Centimeter
Degree Celsius Days after sowing
Etcetera
Food and Agriculture Organization Gram
Hour Kilogram Meter Mi1Jimeter Month
Murate of Potash Number
Percent
Randomized Complete Block Design Sher-e-Bangla Agricultural University Square meter
Triple Super Phosphate
lV
C01fl!E1flS -
CHAPTER TITLE PAGE
ACKNOWLEDGEMENTS
I-IIABSTRACT
IIILIST OF ABBREVIATED TERMS
IVLIST OF CONTENTS
V-VIJLIST OF TABLES
VIIILIST OF FIGURES
IXLIST OF APPENDICES
IXCHAPTER 1 INTRODUCTION
1-3CHAPTER 2 REVIEW OF LITERATURE
4-9'CHAPTER 3 MATERIALS AND METHODS
103.1. Laboratory experiment 10
3.1.1. Collection of seeds 10
3.1.2. Preparation of the seed sample for different 10 treatments
3.1.2.1. Sorting of apparently healthy seeds 10
3.1.2.2. Seed washing 10
3.1.2.3. Seed treatment with brine solution 11 3.1.2.4. Seed treatment with vitavax-200 11 3.1.2. Seed health study of treated seed 11
3.2. Field experiment 12
3.2.1. Experimental Site and experimental period 12
3.2.2. Soil 12
3.2.3. CJimate 15
3.2.4. Layout of the experiment 16
3.2.5. Land preparation 16
3.2.'6. Treatments 16
3.2.7. Application offertilizers 17
3.2.8. Collection of seeds 17
3.2.9. Preparation of the seed sample for different 17 treatments
V
co~
(conttl)Cha~ter Title Page
3.2.10. Sowing of seed 17
3.2.11. Intercultural operation and management practices 18 3.2.]2. Isolation and identification ofBipolaris ]8
sorokiniana.
3.2.13. Recording of leaf spot / leaf blight severity 20 3.2.14. Harvesting and recording growth and yield 22
contributing characters
3.2. ]5. Recording data on grading of seeds. 23
3.2.16. Statistical analysis 23
CHAPTER 4 RESULTS
254.1. Laboratory experiment 25
4.1.1. Effect of seed treatments on germination of seeds 25 as influenced by different treatments
4.1.2. Effect of seed treatments on incidence of 26 Bipolaris sorokiniana on seed surface by blotter
method.
4.2. Field experiment 28
4.2.1. Effect of seed treatments on emerg~nce and plant 28-29 growth of wheat
4.2.2. Effect of seed treatments on leaf spot severity of 31 wheat at panicle initiation stage
4.2.3. Effect of seed treatments on leaf spot severity of 31 wheat at flowering stage
4.2.4. Effect of seed treatments on leaf spot severity of 34 wheat at milking stage
Effect of seed treatments on leaf spot severity of 34 wheat at hard dough stage
CO!Jll1!E.JV'tS (contd.)
Cha~ter
TitlePage
4.2.6. Effect of seed treatments on spikelet formation of 37 wheat
4.2.7. Effect of seed treatments on grain formation and 39-40 grain weight of wheat
4.2.8. Effect of seed treatments on number of grains/ear 43 of different grades of wheat
4.2.9. Effect of seed treatments on 1OOO-seedweight 44-47 and yield of wheat
CHAPTERS DISCUSSION
48-53CHAPTER 6 SUMMARY AND CONCLUSION
54-57REFERENCES
58-61APPENDICES
62-64VB
LIST OF TABLES Table
No.
Title Page
Morphological, physical and chemical characteristics of 13 initial soil (0-15 cm depth)
2 Monthly average of temperature, relative humidity, total 15 rainfall and sunshine hour of the experimental site during the
period from December 2005 to April 2006
3 Effect of seed treatments on germination and incidence of 27 Bipolaris sorokiniana on wheat seeds by blotter method
4 Effect of seed treatments on germination, plant height, spike 30 length and length between the point of flag leaf initiation and base of ear of wheat.
5 Effect of seed treatments on leaf spot severity of wheat at 32 panicle initiation stage
6 Effect of seed treatments on leaf spot severity of wheat at 33 flowering stage
7 Effect of seed treatments on leaf spot severity of wheat at 35 milking stage
8 Effect of seed treatment on leaf spot severity of wheat at hard 36 dough stage
9 Effect of seed treatments on number of spikelets / ear, 38 number of healthy spikelets / ear and number of diseased
spikelets/ ear of wheat.
10 Effect of seed treatments on number of grains / ear, number 42 of healthy grains / ear, number of diseased grains/ ear, weight
of grains! ear, weight of healthy grains/ ear and weight of diseased grains / ear of wheat.
II Effect of seed treatments on number of grains/ear of different 46 grades of wheat
12 Effect of seed treatments on 1000-seed weight and yield of 47
wheat '"
LIST OF FIGURES
...
-_
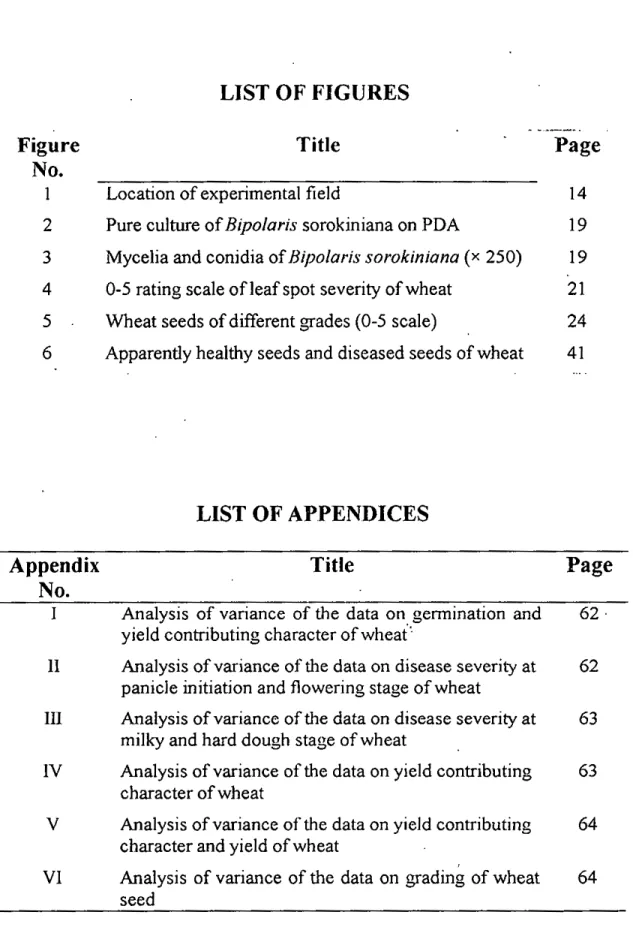
...Figure Title Page
No.
1 Location of experimental field 14
2 Pure culture of Bipolaris sorokiniana on PDA 19 3 Mycelia and conidia ofBipolaris sorokiniana (x 250) 19 4 0-5 rating scale of leaf spot severity of wheat 21 5 Wheat seeds of different grades (0-5 scale) 24 6 Apparently healthy seeds and diseased seeds of wheat 41
LIST OF APPENDICES
Appendix Title
Page
No.
I Analysis of variance of the data on germination and 62·
yield contributing character of wheat:
II Analysis of variance of the data on disease severity at 62
panicle initiation and flowering stage of wheat
III Analysis of variance of the data on disease severity at 63
milky and hard dough stage of wheat
IV Analysis of variance of the data on yield contributing 63
character of wheat
V Analysis of variance of the data on yield contributing 64
character and yield of wheat
,
VI Analysis of variance of the data on grading of wheat 64
seed
IX
Chapter 1
Introduction
1. INTRODUCTION
Wheat (Triticum aestivum L.) is one of the cereal crops in the world. About two third of the world population use wheat as staple food (Majwnder, 1991). It is the
-
second most important cereal crop next to rice in Bangladesh. Though the crop has been introduced in 1961 in the country, its popularity has gained after 1975.
Since initiation of HYV wheat expansion program in 1974, the area as well as yield has increased manifold (Ahmed and Meisner, 1996). Though the area, production and yield rate of wheat have been increasing dramatically during the last decade, the wheat yield in Bangladesh is too low (2.2 tI ha) in comparison to the other countries of the world like Japan, France, Germany and 'UK producing 3.76, 7.12, 7.28, and 8.00 t/ha, respectively (FAO, 2000). About 642.1 thousand
-
...__
hectares of land was covered by wheat cultivation with the annual production of 1253 thousand tons (1.95 t/ha) in Bangladesh (BB~05).
There are many constraints responsible for low yield of wheatin Bangladesh.
Among the different factors that affect the production of wheat, use of unhealthy or diseased seeds is one of the major constraints. Government and semi government organizations supply only 22.8 % of the total wheat seed required during 1998-1999 (Motahar, 2000). These seeds are treated as quality seeds in Bangladesh. The rest 77.2 % of the seeds produced traditionally by the farmers with no' or little care even for purity and germination and remain out of scope of certification. As a result, a huge crop loss is incurred every year in wheat due to seed diseases in the country. Seed borne disease causes enormous losses to our
..
crop (Fakir, 1982). Seed carries large number of destructive pathogens. Wheat is
-
] .
suffering from as many as 26 seed borne diseases (Fakir, 1999a). Various diseases
-
not only common crop loss in the field but also deteriorate quality of seeds in storage and reduce germination (Christensen and Kaufmann s, 1965~ Sachan and Agarwal, 1994). Fungi are the principle organisms among the various organisms
--
.-
associated with seeds instorage. Seed borne inocula of fungal pathogens may be in the form of dormant mycelia, pycnidia, acervuli, sporodochia and sclerotia. A rough estimate shows that an annual crop loss (including storage loss) ofTK.1400 millions is occurred due to seed borne diseases in Bangladesh (Fakir, 2000). Seed borne infections of fungal pathogens are important not only due to its association with the seeds that causes germination failure and attacks to the newly emerged seedlings or growing plants, but it also contaminate the soil by establishing its inocula permanently. Among the diseases, leaf spotlleaf blightlleaf blotch caused by Bipolaris sorokiniana (Sacc. In sork.) is considered to be a threat to wheat cultivation allover the world (Duveiller and Gilchrist, 1994). In Bangladesh, the disease is also considered as a common and devastating one (Hossain and Azad, 1992).
ID
Bangladesh yieldloss in wheat due to leaf blightlleaf spot/leaf blotch disease has been reported to be 20% in Sonalika, while 14% and 8% in Akbar and Kanchan, respectively (Razzaque and Hossain, 1991). In farmers field, the yield loss was estimated 14.97% (Alam et al., 1995), where up to 29% yield reduction was estimated during 1991-1992 in Kanchan (Alam et al., 1994). Rashid and Fakir (1998) estimated yield reduction of wheat due to Bipolaris sorokiniana_ as high as 57.6% and 64.5% in cvs. Kanchan and Sonalika, respectively at maximumdisease incidence. So, seed should be free from pathogens or diseases for better wheat production.
Easy and economic way of controlling seed borne diseases may be the use of clean, healthy looking and washed seeds. It may play an important role to minimize disease incidence and reducing entry of pathogens to the field. In a preliminary study, it has been found that, cleaning and washing fanner's seed reduces seedling diseases up to 53.87% over unclean farmer's seed (Hossain and
"
Asad-ud-Doullah, 1998). Seed cleaning and washing are easy and practically feasible method for our poor fanner's (Hasan, 2000). This technique does not require much effort and it is free from chemical threat. It is an alternative method of avoiding seed treating chemicals and thus environment will be save from pollution. Nowaday's scientists are giving more emphasis on sustainable technology for agriculture. It would be possible when 'ecologically sound, economically viable, culturally appropriate and socially acceptable technology will be adopted. Therefore, the present study has been undertaken with the following objectives:
1. To evaluate the effect of seed sorting, seed washing on the incidence of Bipolaris sorokiniana in wheat. seeds.
, 2. To determine the effect of seed treatment with Vitavax-200 and brine solution on the incidence of Bipolaris sorokiniana in wheat seeds.
3. To evaluate the effect of seed sorting, seed washing and seed treatment with brine solution and Vitavax-200 on leaf spot severity (Bipolaris
sorokiniana ) of wheat.
4. To determine the effect of seed sorting, seed washing and seed treatment with brine solution and Vitavax-200 on grain yield of wheat.
3
-
2. REVIEW OF LITERATURE
Seed borne pathogens are reported to cause spots or discoloration on the seed.
Seed cleaning and washing may reduce number of seed bome pathogens associated with seed and thus improves the quality of seed. The experimental evidence regarding the benefit of seed cleaning, washing and treated with brine solution at home and abroad is rare and scanty. Therefore, attempt has been taken to collect relevant literature on this aspect, which are given below:
Hanson and christensen (1953) reported that the relation of discolored seed to germination and plant stand depend on some organism or organisms responsible for discoloration. If Helminthosporium caused it, there may be detrimental effects. They also found an almost similar trend of variation in germination of Helminthosporium sativum infected wheat seeds variety Kubanka collected from direct sources. They found the seed germination as 60% and 62% from the seeds having respectively 89% and 74% infection with H. sativum. Seed infected with H. sativum on the other hand, commonly germinated poorly and produced inferior stands with more seedling blight than clean seeds.
Bedi and Gill (1960) reported that a substantial loss in germination (11.0 to 37.3%) is associated with the spotted seeds. They found spotted seeds, which did not germinate was profusely covered with mycelium and the spore of Helminthosporium oryzae. Healthy seeds· gave very high percentage
4
germination as 99% and remained free from any seedling mortality. In the case of naturally infected seed there was a loss of about 5% among the seedlings.
They also found appreciable loss in weight with spotted seeds. It was found to
I I'
vat)' from 40.58% to 29%.
Khanum et 01. (1987) stated that black point is responsible for the germination failure of grains in the field. Visual observations indicated that natural infection of grains of the cultivars Lyp-73, Pai-73 and Pka-81 were 58%, 35% and 150/0, respectively .The germination of healthy grains was 55~96.5% and that of diseased grains 34.5-71 %.
Hossain and Asad-ud-Doullah (I998) reported that cleaning and washing of fanner's rice seeds reduced the seedling diseases up to 53.870/0 over the unclean farmer's seed. Use of healthy seedlings resulted 14.77% increase in grain yield over the unbiased use of normal seedlings from seedbed.
Rashid and Fakir (2000) reported that high quality healthy seeds are crying need of the day to assure sustainable good crops to the farmers who must be aware of the consequences of the crop losses with unhealthy seeds. With a view to obtain good harvest, the effectiveness of other inputs such as fertilizer, irrigation etc. influence largely the quality of seeds.
" Fakir et al. (2000) found that seed cleaning had paramount importance for improvement of quality of rice seeds in the Seed Health Improvement Project under PETRRA. They separated out the best or clean apparently healthy seeds from the original fanner's stored rice seeds through elimination of seed contaminants (weed seeds, insects, varietal mixture, seeds of other crops, germinated seeds, smutted seeds and matter) and abnormal seeds (spotted, discolored, deformed, shriveled, unfilled and half-seeds) by manual physical seed .sorting. The least percentage of seed- borne pathogenic fungi were recorded on seed health analysis. Also, lesser number of dead/abnormal seedlings and higher percentage of normal seedling were obtained from best seeds in the germination test.
Hasan (2000) found that seed cleaning and washing with water increase of germination and vigour index by 8.33 and 31.10%, respectively in farmers rice seed (cv. BR 11). Seed health test revealed that farmer's seeds yielded Bipolaris oryzae, Fusarium moniliforme, Alternaria padwickii, Aspergillus niger,
. .
Aspergillus flavus and Penicillium spp. by 1.5%, 13.5%, 1.3%, 0.5%, and 0.5%, respectively, over the best seeds. Seed cleaning followed by washing with water also increased 24.63% grain yield over fanner's seeds. He emphasized the importance of seed cleaning and washing for controlling seed- borne pathogens of rice. Seed cleaning and washing reduced incidence .of foliar diseases in the field and increased seed yield by 35.13% over the use of normal
fanner's seed of rice.
6
Rahman et a1. (2000) carried out an experiment to improve seed quality by seed cleaning (manual sorting and flotation in water) in four seed samples of-rice cv.
BR 11. The seed borne fungi associated with the treated and untreated seeds were Bipolaris oryzae, Trichoconis padwickii, Curvularia lunata, Nigrospora oryzae, Alternaria tenuis, Aspergillus spp. and Penicillium spp. AU the three seed treatment methods reduced an seed bome fungal infections. The best method was treatment with Vitavax-200, followed by manual seed sorting and flotation. Germination test following paper towel method showed that chemical treatment was the best in producing normal seedlings, fol1owed by manual sorting and flotation method. Vitavax-200 treatedseeds and manually sorted seed produced the highest number of tillers/hill, percentage
or
healthy seeds and 1000- seed weight. Grain yield was increased in manually sorted, flotation and Vitavax-200 treated seeds/ plots by 30.5, 13.5, and 27.3%, respectively.Hossien (2002) reported that fanner's dean seed, washed farmer's seed, washed clean seed and seed treated with Vitavax-200 increased 16.62%, 16.45%, 23.39% and 26.6% grain yield, respectively over farmersaved seeds of rice (BR 11).
Gworgwor et 01. (2002) conducted field trials in N.igeria during 1997 and 1998 wet seasons to determine the effect of seed treatment of different sorghum cultivars with brine solution (NaCl) on
Strtga hermonthicam
in sorghum.Different concentration of brine at 0.5, 1.0, 1.5, and 2.0 M. were used. They
reported that the effect of brine treatments on plant establishment, growth and yield of sorghum under Striga infestation shows there that was a decrease' in crop stands with increase in brine concentration, with the least value at 2.0 M brine treatment, which was damaging at this rate. Plant height and LAI of sorghum increased with increasing concentration of brine to a maximwn at 1.5 M and declined at 2.0 M brine treatment. The 1.5M brine treatment produced the height grain yield.
Kabir (2003) reported that the germination test of fanner's seed treated with Vitavax-200 resulted highest percentage of germination, followed by soaked washed clean seed. Seedling emergence in seedbed' was significantly higher (21.35%) in soaked washed cleaned seed than all other treatment (untreated fanner's seed, cleaned seed, washed fanner's seed, soaked washed fanner's seed, washed clean seed, and chemical treatment of fanner's seed with Vitavax-200). ",The disease severity of brown spot, narrow brown spot, blast, sheath blight and sheath rot was the lowest in plots under farmer's seed treated
,
.
with Vitavax-zuu, followed by soaked washed cleaned seed. The Vitavax-200 treated seed significantly resulted highest plant height, panic1e length and yield (5.88 ton s!ha) , which was 18.07% higher over the use of untreated fanner's seed; while soaked washed cleaned seed and washed cleaned seed gave 16.47%, 14.86% increased seed yield, respectively. Maximum numbers of apparently healthy seeds were obtained by using farmer's seed treated with
(
8
Vitavax-200 (76.24%), followed by soaked washed cleaned seed (70.47%) over untreated fanner's seed (57.69%).
Siddique (2003) reported that the seeds remained on sieve showed better performance in respect of seed germination, seedling vigour and seed health in different wheat varieties (Kanchan, Akbar and Sourov). Seeds were cleaned by bamboo sieve having mesh size 2.25mm. Seeds were taken on bamboo sieve and manually shaken for different duration (two, four, six and eight minute).
The seeds remained on sieve were considered as healthy seeds and those were
;'
dropped the sieve were consider as unhealthy seeds. Germination and seedling vigour increased with increasing duration of sieving. Seed cleaning by bamboo sieve reduced prevalence of pathogens. Infection percentage gradually decreased with increasing duration of sieving.
Uddin (2005) reported that seed borne pathogens were significantly reduced by treating seeds with chemical (vitavax-200) followed by garlic extract, brine solution, hot water and physically sorted seeds in Lentil. The highest reduction of seed borne fungal flora were observed in case of chemical treatment followed by garlic extract, brine solution, hot water and physically sorted seeds. In the field condition, germination percentage was hi,pher in physically sorted seeds.
· Chapter3
I Materials and Methods
'.
3. MATERIALS AND METHODS
3.1. Laboratory experiment
The experiment was carried out in the Seed Pathology Laboratory, Department of Plant Pathology, Sher-e-Bangia Agricultural University, Dhaka, Bangladesh.
3.1.1. Collection of seeds
Wheat seeds of Kanchan variety were collected from a farmer named Md.
Nurul Islam ofViUage Mahiarpur, Thana Mithapukur, District Rangpur.
3.1.2. Preparation of the seed sample for different treatments 3.1.2.1. Sorting of apparently healthy seeds
Apparently healthy seeds were obtained by manual separation of seeds from the contaminants and abnormal seeds of the lot of original farmer stored seeds.
3.1.2.2. Seed washing
For washing, required amount of seeds were taken in conical flask and required amount of water was added into the seeds. The seeds were then stirred for 10 minutes with a magnetic stirrer. The excess water was removed. The washing was done both for farmer's stored seeds and apparently healthy seeds.
10
3.1.2.3. Seed treatment with brine solution
At first 2% brine solution was prepared by mixing 100 ml tape water with 2g edible salt (NaCI) and seeds were soaked in the solution for IS minutes. After treating seeds the excess water was removed and the seeds were air dried in the laboratory prior to sowing.
3.1.2.4. Seed treatment with Vitavax-200
Seeds weretaken in a beaker and O.lg chemicals was added into 24g seeds.
The chemical was mixed thoroughly by a stick. Both apparently healthy seeds and original farmers stored seeds were treated with Vitavax-200 @ 0.4%.
3.1.3. Seed health study of treated seed
Seed health study was done following the standard method of ISTA (1999). In this method, three layers of blotting paper (whatman filter paper no.I) soaked in water and were placed at the base of a 9 em diameter plastic petridish and thereafter 25 seeds were placed on filter paper. The petridishes containing seeds were incubated at 20±2
°c
under alternating cycles of 12 hours near ultraviolet (NUV) and darkness for 7 days. The incubated seeds were examined under stereo binocular microscope in order to record the incidence ofBipolarissorokiniana that grew out of the seeds. For proper identification of fungi, temporary slides were also prepared from the fungal colony and examined
11
under compound microscope and fungi were identified (Malone and Muskett, 1964~Benoit and Mathur, 1970; Ellis, 1971 and Agarwal et al., 1989).
3.2. Field experiment
3.2.1. Experimental site and experimental period
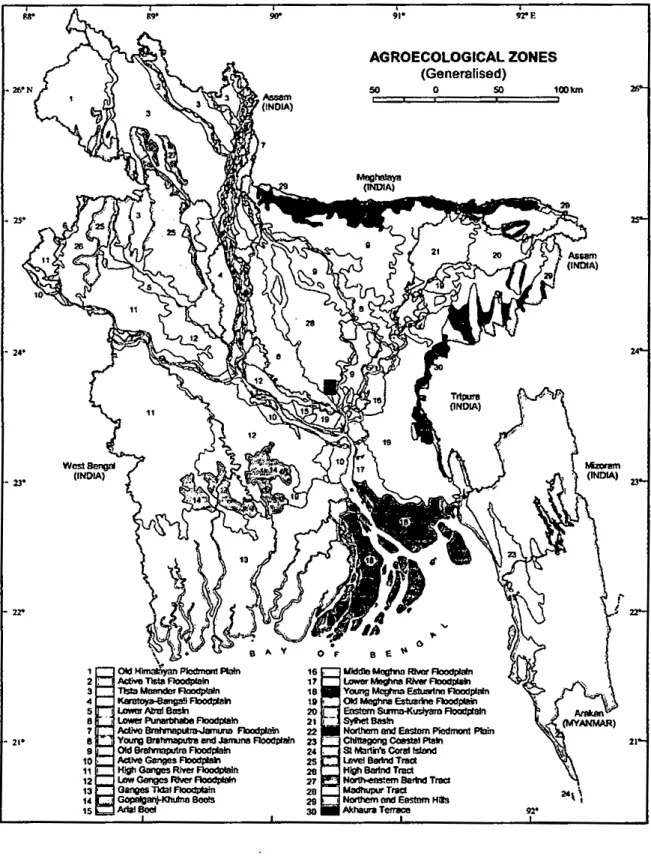
The experiment was conducted at Sher-e-Bangla Agricultural University Farm, Dhaka-1207 during the period from December 2005 to April 2006. The experimental field was located at 90°22' E longitudes and 23°41' N latitude at an altitude of 8.6 meters above the sea level. The following map shows the specific area of experimental site (Fig. 1.)
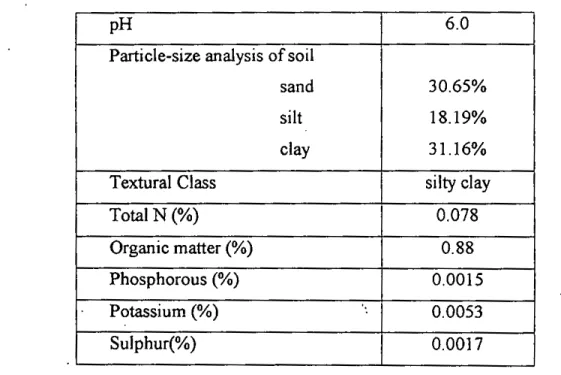
3.2.2. Soil
The soil of the experimental field belongs to the Tejgaon series under the Agro Ecological Zone, Madhupur Tract (AEZ-28) and the general soil type is Shallow, Red Brown, Terrace Soils. Details of the soil characteristics are shown in Table 1.
12
Table 1. Morphological, physical and chemical characteristics. of soil experimental field (0-15 cm depth)
pH 6.0
Particle-size analysis of soil
sand 30.65%
silt 18.19%
clay 31.16%
Textural Class silty clay
Total N (%) 0.078
Organic matter (%) 0.88
Phosphorous (%) 0.0015
Potassium (%) : 0.0053
Sulphur(%) 0.0017
(Source:Bhuiyan, 2(tQ.5)
13
9,0
AGROECOLOGICAL ZONES (Generalised)
lJO
210
8 E ~
16 UiddIa fotogma _ FIoocIpIuIn 17 e.--M191ft8 RNw~
18 YoungMcgtw13 EsbJartnofloodplllln 111 0lIlMoghnII estuarine
FIi)od.,
20 EnsttmStmIIH(IdyarD FloadPDIn 21 - ~BasIn
22 NorthIIm 8111! EasIomPicdmant Pbin 23 C1IIftItgarog CoinIeIPI8I
24. SlMJrtirfll Cor8IlsIMd 2S UM!I88ItndTI'IId 2G High 8aIIncI T!'IId
27 . ~ BIIrhI Tt8C1
28 Iotadhupur TI1ICI 28. Nar1IIcm Md Ees!Dm Hils 30 Al<hIuraT_
Fig. 1. Location of experimental field •
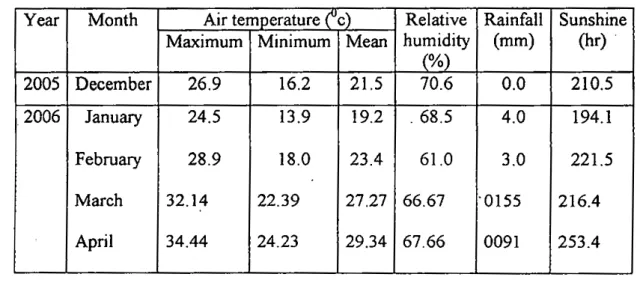
3.2.3. Climate
The monthly mean of daily maximum, minimum and average temperature, relative humidity, monthly total rainfall (mm) and sunshine hours throughout the experimental period were collected from weather office, She-e- BangIa Nagar, Dhaka. The monthly weather report for the study period is shown in Table 2.
-,
Table 2. Monthly average of temperature, relative humidity, total rainfall and sunshine hour of the experimental site during the period from December 2005 to April 2006
Year Month Air temperature (lc) Relative Rainfall Sunshine Maximum Minimum Mean humidity (mm) (hr) .
(%)
2005 December 26.9 16.2 21.5 70.6 0.0 210.5
2006 January 24.5 13.9 19.2 .68.5 4.0 194.1
February 28.9 18.0 23.4 61.0 3.0 221.5
March 32.14 22.39 27.27 66.67 '0155 216.4
April 34.44 24.23 29.34 67.66 0091 253.4
Source: Bangladesh Meteorological Department (Climate division), Agargaon, Dhaka -1212.
15
'.
3.2.4 Layout of the experiment
The experiment was laid out in a Randomized Complete Block Design with three replications. The total number of plots was 30. The size of unit plot was 2m x 1m. The distance maintained between two plots was 50 ernand between blocks was 1.0 m.
3.2.5. Land preparation
A power tiller first opened the selected land on 1stDecember 2005; afterwards the land was ploughed and cross-ploughed several times followed by laddering to obtain a good tilth. Weeds and stubbles were removed, and large clods were broken into smaller pieces to obtain a desirable tilth of soil for sowing of seeds.
Finally, the land was leveled and the experimental plot was partitioned into unit plots.
3.2.6. Treatments
There were ten treatments, which were as follows:
TJ =Farmer's stored seed (control)
T2
=
Apparently healthy seedT3
=
Farmer's stored seed treated with vitavax-200 @ 0.4%T4
=
Apparently healthy seed treated with vitavax~200 @ 0.4%T,
=
Farmer's stored seed washed with water T6=
Apparently healthy seed washed with waterT7=Farmer's stored seed treated with brine solution @ 2%
T8
=
Apparently healthy seed treated with brine solution @2%T9=Washed farmer's stored seed treated with brine solution @ 2%
rIO =
Washed apparently healthy seed treated with brine solution @2%
16
3.2.7. Application of fertilizers
The field was fertilized at the rate of 220 Kg urea, 180 Kg TSP, 50 Kg MP, 120 Kg Gypsum and 10 tons cow dung per hectare (Krishi Projukti Hatboi, 2005). Two third of Urea, full dose ofTSP, MP, Gypsum, and cow dung were applied at the time of final land preparation. Remaining one third of Urea was applied at 21 days after seed sowing.
3.2.8. Collection of seeds
Wheat seeds of Kanchan variety were collected from a farmer, Md. Nurul Islam, Village Mahiarpur, Thana Mithapukur, district Rangpur ..
3.2.9. Preparation of the seed sample for different treatments
Sorting of apparently healthy seeds, seed washing and seed treatment with brine solution and vitavax-200 were done following the method as described in laboratory experiment (3.1.2.).
3.2.10. Sowing of seeds
Wheat seeds were sown in the field on 10th December 2005 at the rate of 120 Kg/ha, The seeds were sown in lines at a depth of 5 em and covered by soil with the help of hand. The distance between lines was 20 em in every plot.
17
3.2.11. Intercultural operation and management practices
Intercultural operation like weeding, irrigation was done in order to maintain the normal hygienic condition of crop growth. Weeding was performed two times during the growing period of crop (one after
39
days and another 50 days of sowing). The experimental field was irrigated twice, first irrigation was done.
at 21 days after sowing and second irrigation was done at 60 days after sowing.
Special care was taken to protect the crop from birds especially sowing and germination stages and at the ripening stage of the crop.
3.2.12. Isolation and identification ofBipolaris sorokiniana.
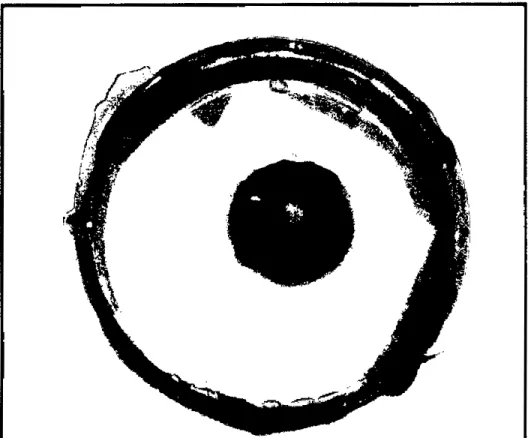
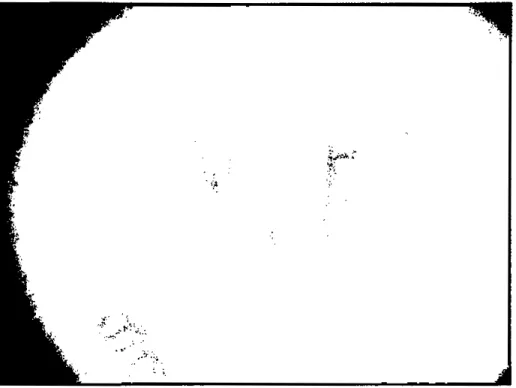
The collected diseased leaves were cut into pieces (0.5 em) and surface sterilized with HgCh (1: 1000) for 30 seconds. Then the cut pieces were washed in sterilized water thrice and were placed on to PDA in petridish. The petridish containing leaf pieces were placed in an incubator at 22-24oC for 7days. The organism was isolated by hypha1 tip culture method and then purified and identified following the key characteristics of pure culture of Bipolaris sorokiniana on PDA (Fig. 2.) and mycelia and conidia ofBipolaris sorokiniana (Fig. 3).
18
Fig. 2. Pure culture ofBipolaris sorokiniana on PDA
~~.:'.'
".~','
'.'
"
.:~,~~,~~\:.
• '0" ,.~; :;~.
Fig. 3. Mycelia and conidia ofBipolaris sorokiniana (x 250)
19
3.2.13. Recording of leaf spot Ileaf blight severity
Leaf spot severity of wheat was evaluated at four growth stages of plant viz.
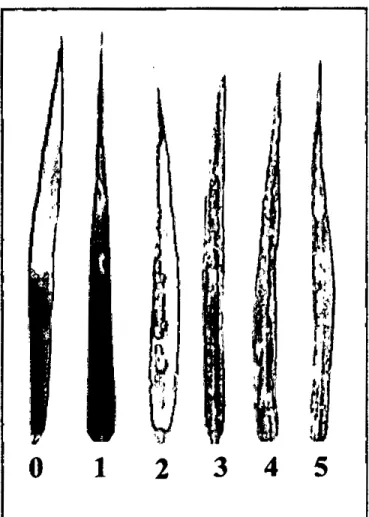
panicle initiation, flowering, milking, hard dough stage. The disease severity was recorded following rating scale as used by Hossain and Azad (1992) (Fig.
4) The rating scale is given below:
o
=No infection (Highly resistant)1=Few minute lesions on leaves (Resistant) ':
2=Black lesion with no distinct chlorotic halos coveringg 10% of the leaf area (Moderately resistant)
3 = Typical lesions surrounded by distinct chlorotic halos covering 10- 50% of the leaf area (Moderately susceptible)
4
=
Severe lesions on leaves with ample necrotic zones drying over part of the leaf, covering ~ 50% of the leaf area (susceptible)5
=
Severe infection, drying of the leaf spike infected. to some extend (Highly susceptible)The rating of the disease reaction was done on the flag leaf, second leaf and 3rd leaf from the top of the plant. The randomly selected 25 plants/plot were tagged for rating the disease severity and mean value were determined to get rating score of the material of each treatment.
20
o 1 2
,~,
345
Fig. 4. 0-5 rating scale of leaf spot severity of wheat
21
3.2.14. Harvesting and recording growth and yield contributing characters The crop was harvested at full ripening stage. The observations pertaining to the following parameters were recorded after harvesting from randomly selected and tagged 25 plants of each unit plot:
(i) Plant height (ern)
(ii)Distance between the point of flag leaf initiation and base of ear (em)
(iii) Length of ear (cm) (iv) Number of spikelets lear (v) Number of healthy spikelets/ear (vi) Number of diseased spikelets/ear (vii) Number of grains lear
:
(viii) Number of healthy grains lear . (ix) Number of diseased grains lear (x) Weight of grains lear (g)
(xi) Weight of healthy grains lear (g) (xii) Weight of diseased grains lear (g) (xiii) Weight of thousand seeds (g) (xiv) Grain yield (Kg/plot)
(xv) Grain yield (t/ha) (xvi) Straw yield (Kg/plot) (xvii) Straw yield (t/ha)
22
3.2.15. Recording data on grading of seeds
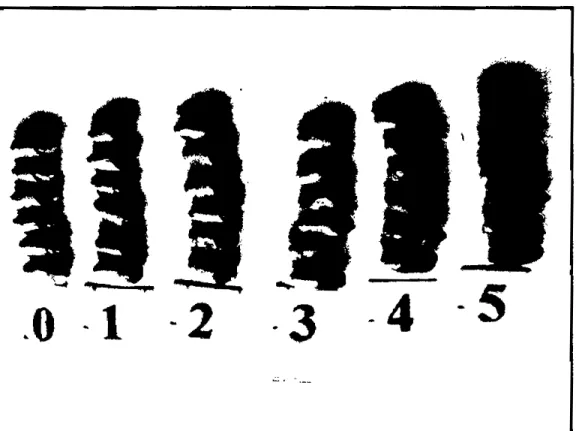
The grading of seeds was done following the 0:.5 rating scale (Fig. 5) of CIMMYT (Gilchrist, 1985). The rating scale is as follows:
0= free from infection 1
=
only embryo blackish2
=
embryo and its adjacent area slightly infected 3=
embryo and less than Y4of grains are discolored 4 =embryo and Y2of grains are infected and5 =grains are shriveled, almost completely discolored or more than Y2of grains discolored.
3.2.16. Statistical analysis
Data in respect of different growth and yield contributing characters were statistically analyzed and test of significance was done following DMRT (Duncan's New Multiple Range Test) and means were compared following LSD (Least Significance Difference).
23
~O- 1 ·3 -4
Fig. S. Wheat seeds of different grades (O-S scale)
Chapter 4
Results
4. RESULTS
The results of different quality of seed after application of seed treatment of wheat on the germination, disease severity, yield contributing character and yield have
. .
been presented in this chapter. The analysis of variance (ANaYA) of data on different parameters is given inappendix I to VI, The results have been presented under the following headings:
4.1. Laboratory experiment
4.1.1. Effect of seed treatments on germination of seeds
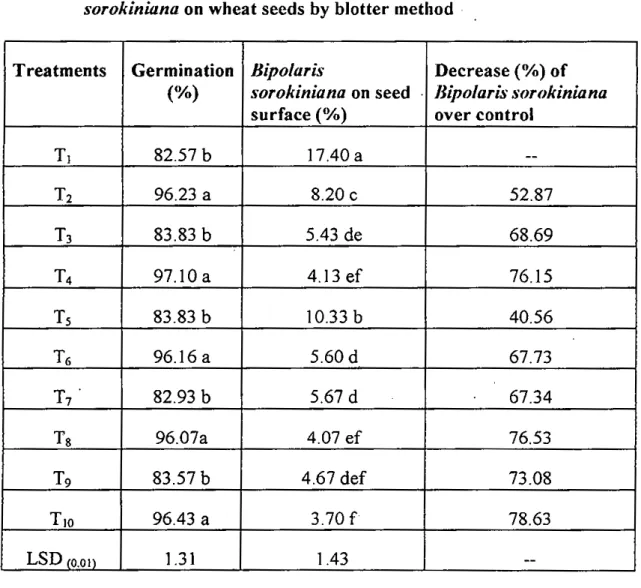
Significant variations were observed in percentage of seed germination (Table 3).
The highest germination (97.10%) was counted in the treatment T4 (apparently healthy seed treated with vitavax-200 @ 0.4%) and the lowest germination (82.57%) was counted in treatment TJ (fanner's stored seed). The treatments T2 (apparently healthy seedj.T, (apparently healthy seed treated with vitavax-200 @ 0.4%). T6 (apparently healthy seed washed with water), Ts (apparently healthy seed treated with brine solution @ 2%) and T10 (washed apparently healthy seed treated with brine solution @ 2%) were statistically similar in respect of seed
, ' .
germination but they differed significantly from TJ (farmer'S stored seed).
4.1.2. Effect of seed treatments on incidence of Bipolaris sorokiniana on seed surface byblotter method.
Different treatments differed significantly in respect to incidence of seed borne Bipolaris sorokinian that has shown in table 3, The highest incidence ofBipolaris sorokiniana was counted (17.40%) under the treatment TI (fanner's stored seed) and the lowest incidence was counted (3,70%) under the treatment TJO(washed apparently healthy seed treated with brine solution @ 2%). The treatment TIO reduced 78,63% incidence of Bipolaris sorokiniana over control TI (fanner's stored seed).
26
Table 3. Effect of seed treatments on germination and incidence of Bipolaris sorokiniana on wheat seeds by blotter method
Treatments Germination Bipolaris Decrease (%) of
«Yo) sorokiniana on seed Bipolaris sorokiniana surface (%) over control
TI
82.57 b 17.40 a--
T2 96.23 a 8.20 c 52.87
T3
83.83 b 5.43 de 68.69T4
97.10 a 4.13 ef 76.15T5
83.83 b 10.33 b 40.56T6 96.16 a 5.60d 67.73
T7 . 82.93 b 5.67 d 67.34
1'8 96.07a 4.07 ef 76.53
T9
83.57 b 4.67 def 73.08TIO 96.43 a 3.70[- 78.63
LSD (0.01) 1.31 1.43
--
TJ =Farmer's stored seed (controJ) T2
=
Apparently healthy seedT3=Farmer's stored seed treated with vitavax-200 @0.4%
T4 =
Apparently healthy seed treated with vitayax-200 @ 0.4%T5 =
Farmer's stored seed washed with water T6=
Apparently healthy seed washed with waterT7
=
Fanner's stored seed treated with brine solution @ 2%T8
=
Apparently healthy seed treated with brine solution @ 2%T9 =
Washed fanner's stored seed treated with brine solution @2%T10=Washed apparently healthy seed treated with brine solution @ 2%
4.2. Field experiment
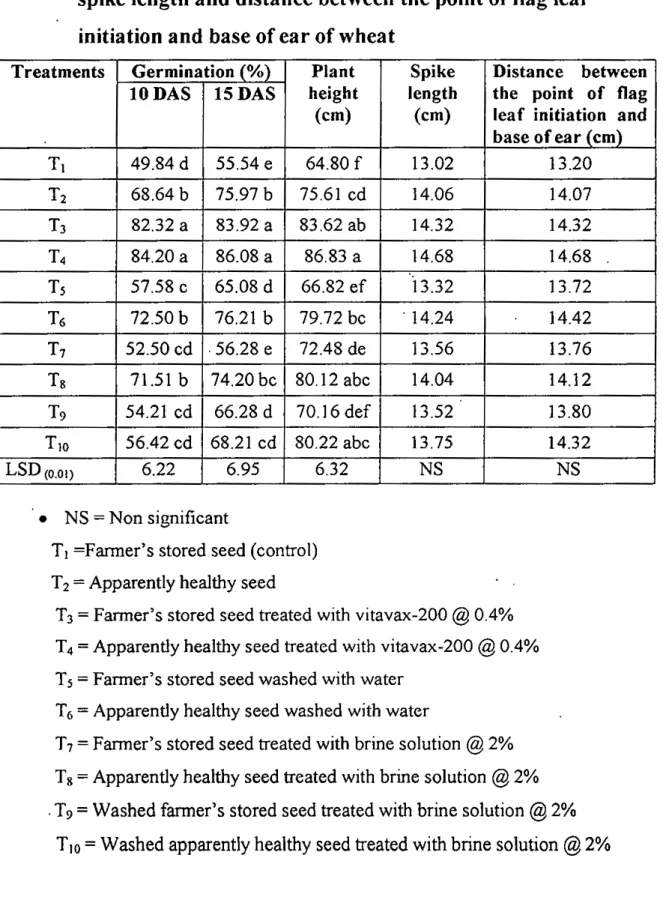
4.2.1. Effect of seed treatments on emergence and plant growth of wheat The emergence of wheat seedling was counted at J0 and 15 days after sowing (DAS) of seeds. Significant variation in percentage of seed germination at 10 DAS and 15 DAS among the treatments were found and are shown in Table 4. The germination percentage varied from 49.84% to 84.20% at 10 DAS and 55.54% to 86.08% at 15 DAS among the treatments. The highest germination was counted 84.20% and 86.08% at 10 and 15 DAS respectively, under the treatment T4 (apparently healthy seed treated with vitavax-200 @ 0.4%) and this was statistically similar to the treatment T3 (Farmer's stored seed treated with vitavax- 200 @ 0.4%) where germination was counted 82.32% and 83.92% at 10 DAS and 15 DAS, respectively. On the other hand the lowest germination (49.84% and 55.54% at 10 and 15 DAS, respectively) was recorded in the treatment TJ (farmer's stored seed).
Significant variation in plant height among the treatments was observed and has shown inTable 4. Plant height varied from 64.80 to 86.83 cm. The highest Plant height (86.83cm) was recorded under the treatment T4 treatment (apparently healthy seed treated with vitavax-200 @ 0.4%), which was statistically identical to the treatment T3 (farmer's stored seed treated with vitavax-200 @ 0.4%), Is (apparently healthy seed treated with brine solution· @ 2%) and T10 (washed apparently healthy seed treated with brine solution @ 2%). On the other hand the lowest plant height (64.80 em) was recorded in the treatment II(fanner's stored
28
seed) that was statistically similar to the treatment T,(fanner's stored seed washed with water) and T9 (Washed fanner's stored seed treated with brine solution @ 2%).
The spike length did not show any significant variation among the treatments (table 4). The spike length varies from 14.68 to 13.02 cm that was not statistically significant (Table 4). The highest spike length was found 14.68 em in T4 treatment (apparently healthy seed treated with vitavax-200 @0.4%). On the contrary, the lowest spike length (13.02 em) was recorded in the treatment T1(farmer's .stored seed). Chemically treated seed gave the maximum spike length that might be take place due to chemically treated seed could be free from seed borne pathogens which influence the development of wheat spike.
While considering the length between panicle initiation and point of spike, no significant variation was found among the treatments (Table 4). The highest distance between the point of flag leaf initiation and base of ear (14.68 em) was recorded inthe treatment T4 (apparently healthy seed treated with vitavax-200 @ 0.4%) and the lowest distance between the point of flag leafinitiation and base of ear (13.20 ern)was recorded in the treatment TI(farmer's stored seed).
Table 4. Effect of seed Treatment on germination, plant height, spike length and distance between the point of flag leaf initiation and base of ear of wheat
Treatments Germination (%) Plant Spike Distance between lODAS 15DAS height length the point of flag
(cm) (em) leaf initiation and base of ear (em)
Tl 49.84 d 55.54 e 64.80 f 13.02 13.20
T2 68.64 b 75.97 b 75.61 cd 14.06 14.07
T3 82.32 a 83.92 a 83.62 ab 14.32 14.32
T4 84.20 a 86.08 a 86.83 a 14.68 14.68
Ts 57.58 c 65.08 d 66.82 ef 13.32 13.72
T6 72.50 b 76.21 b 79.72 be . 14.24 14.42
T7 52.50 cd ·56.28 e 72.48 de 13.56 13.76
Ts 71.51 b 74.20bc 80.12 abc 14.04 14.12
T9 54.21 cd 66.28 d 70.16def 13.52 13.80
TIO 56.42 cd 68.21 cd 80.22 abc 13.75 14.32
LSD(0.01) 6.22 6.95 6.32 NS NS
• NS =Non significant
T, =Farmer's stored seed (control) T2=Apparently healthy seed
T3
=
Farmer's stored seed treated with vitavax-200 @0.4%T4
=
Apparently healthy seed treated with vitavax-200 @ 0.4%Ts
=
Fanner's stored seed washed with water T6=Apparently healthy seed washed with waterT7
=
Farmer's stored seed treated with brine solution @ 2%Ts
=
Apparently healthy seed treated with brine solution @ 2%. T9
=
Washed farmer's stored seed treated with brine solution @2%TIO
=
Washed apparently healthy seed treated with brine solution @2%30
4.2.2'- Effect of seed treatment on leaf spot severity of wheat at panicle initiation stage
Disease severity at panicle initiation stage was recorded on :flagleaf, Penulpimate leaf and 3n1 leaf of wheat and found to have statistically significant variations (Table 5). The lowest disease severities were recorded in the treatment T4 (apparently healthy seed treated with vitavax-200 @ 0.4%), which was·O.Ol, 0.04 and 0.12 at flag leaf, flag leaf-l and flag leaf-2, respectively. On the other hand the highest disease severities were obtained under the treatment TI,which was 0.15,0.42 and
1.08 on flag leaf, Penulpimate leaf and 3n1 lcnfof wheat, respectively.
4.2.3. Effect of seed treatment on leafspot severity of wheat at flowering stage Disease severity at flowering stage was recorded on flag leaf, Penulpimate leaf and 3rd leaf of wheat and was found statistically significant variation (Table 6). The lowest disease severities were recorded in the treatment T4 (apparently healthy seed treated with vitavax-200 @ 0.4%), which was 0.04, 0.12 and 0.42 on flag leaf, Penulpimate leaf and 3rd lenf, respectively. On the other hand the highest disease severities 0.52, 1.03 and 2.09 were obtained under the treatment T1
(farmer's stored seed) that was on flag leaf, Penulpimate leaf and 3rd lenf flag leaf, Penulpimate leaf and 3rd Icof,of wheat, respectively.
Table 5. Effect of seed treatment on leaf spot severity of wheat at panicle initiation stage
Treatments
Disease sever!!Y_ at 1!_anicle initiation sta_ge
Flag leaf Penulpima te 3rd lear Average leaf
T.I 0.15 a OA2a ] .08 a 0.55 a
T2
0.07 cd 0.21 d 0.66 c 0.31dT3 0.02 e 0.06 f 0.18 f 0.09g
T4
0.01 e 0.04g 0.12 g 0.05hTs 0.06 cd 0.18 e 0.54 d 0.26e
T6 0.10 b 0.31 b 0.80b OAO b
T7 0.08 c 0.25 c 0.68c 0.0.34 c
Ts 0.06 d 0.18 e OA9 de 0.24 f
T9 O.cd 0.21 d 0.65 c 0.31 d
TIO
0.06d 0.] 7 e OA8e 0.24fLSD(0.01) 0.02 0.0] 0.05 0.02
TI=Farmer's stored seed (control) T2= Apparently healthy seed
T3
=
Fanner's stored seed treated with vitavax-200 @ OA%T4 =
Apparently healthy seed treated with vitavax-200 @ 0.4%T, =Fanner's stored seed washed with water T6
=
Apparently healthy seed washed with waterT7
=
Fanner's stored seed treated with brine solution @ 2%T8=Apparently healthy seed treated with brine solution @2%
T9=Washed fanner's stored seed treated with brine solution @ 2%
TIO =Washed apparently healthy seed treated with brine solution @ 2%
32
Table 6. Effect of seed treatment on leaf spot severity of wheat at
flowering stage .
Disease severity at flowering Stage
Treatments Flag leaf Penulpimate 3rd leaf Average leaf
TI 0.52 a 1.03 a 2.09 a 1.21 a
T2 0.16 c 0.60 c 1.28 cd 0.68 d
T3 0.08 f O.IS f 0.54f 0.26g
T4 0.04g 0.12 g 0.42 f 0.19h
Ts 0.15 c 0.54 de 1.1S de 0.62 e
T6 0.24 b 0.66 b 1.50 b O.SOb
T7 0.16 c 0.60c 1.42b 0.72 c
Ts . 0.10 e 0.51 de 1.0S e 0.56f
T9 0.12 d 0.56 cd 1.40 be 0.69d
TIO 0.09 ef 0.4ge ] .06 e 0.54f
LSD(O.OJ) 0.02 0.05 0.12 0.02
TI=Farmer's stored seed (control) . T2=Apparently healthy seed
T3=Fanner's stored seed treated with vitavax-200 @0.4%
T4
=
Apparently healthy seed treated with vitavax-200 @ 0.4%T, =Farmer's stored seed washed with water T6=Apparently healthy seed washed with water
T7=Fanner's stored seed treated with brine solution @2~
Ts=Apparently healthy seed treated with brine solution @2%
T9
=
Washed fanner's stored seed treated with brine solution @ 2%TIO =Washed apparently healthy seed treated with brine solution @ 2%
4.2.4. Effect of seed treatment on leafspot severity of wheat at milking stage Statistically significant variation was found in disease severity at milking stage was recorded on flag leaf, Penulpimate leaf and 3rd ICllf of wheat (Table 7). The lowest disease severity was recorded in the treatment T4 (apparently healthy seed treated with vitavax-200 @ 0.4%), which was 0.08, 0.28 and 0.72 on flag leaf, flag leaf, Penulpirnate leaf and 3rd Icnf, respectively. On the other hand, the highest disease severity was obtained under the treatment T, (fanner's stored seed) that were 0.76, 1.50 and 2.82 on flag leaf, Penulpimate leaf and 3rd leaf of wheat, respectively.
.
.
4.2.5. Effect of seed treatment on leaf spot severity of wheat at hard dough stage
Disease severity at hard dough stage was recorded on flag leaf, Penulpimate leaf 'and 3rd leafof wheat and was found statistically significant variation (Table 8). The lowest disease severity was recorded in the treatment T4 (apparently healthy seed treated with vitavax-200 @ 0.4%), which were 0.28, 0.72 and 1.52 on flag leaf, Penulpimate leaf and 3rd lcar, respectively. On the other hand the highest disease severities 1.48, 2.56 and 3.54 were obtained under the treatrnent T, (fanner's stored seed) that was on flag leaf, Penulpimate leaf and 3rd leaf of wheat, respectively.
34
Table 7. Effect of seed treatment on leaf spot severity of wheat at milking stage
Disease severity at milking stage
Treatments Flag leaf Penulpimate 3rd leaf Average leaf
TI
0.76 a 1.50 a 2.82 a 1.69 aT2
0.38 e 0.88 d 1.96 cd 1.07 eTJ. 0.]8 g 0.52 f 0.98 f 0.56i
T4
0.08 h 0.28 g 0.72 g 0.36jTs
0.66 b 1.32b 2.21 b 1.39 bT6
0.32f 0.76 e 1.68 e 0.92gT7 0.54 e 1.27 be 2.10 be 1.30 e
Ts
0.30f 0.70 e 1.70 e 0.90hT9 0.44 d 1.21 e 2.02 c 1.22 d
Tlo 0.32 f 0.72 e 1.80 de 0.94f
LSD(0.01). 0.05 0.09 0.16 0.02
TI =
Farmer's stored seed (control) T2=
Apparently healthy seedT3
=
Farmer's stored seed treated with vitavax-200 @0.4%T4
=Apparently healthy seed treated with vitavax-200 @0.4%T,=Farmer's stored seed washed with water T6=Apparently healthy seed washed with water
T7
=
Farmer's stored seed treated with brine solution @2%Ts=Apparently healthy seed treated with brine solution @ 2%
T9
=
Washed farmer's stored seed treated with brine solution @2%TIO=Washed apparently healthy seed treated with brine solution @2%
Table 8. Effect of seed treatment on leaf spot severity of wheat at hard dough stage
Disease severity at hard dough Stage
Treatments Flag leaf Penulpimate 3rd leaf Average leaf
TJ 1.48 a 2.56 a 3.54 a 2.52 a
T2 0.70 c 1.68 cd 2.50cd 1.62 e
T3 O.44f 0.88f 1.96 e 1.09 h
T4 0.28g 0.72f 1.52f 0.84 i
T5 1.04 b 2.06 b 3.10 b 2.06b
T6 0.62 d 1.48 de 2.40 d 1.50f
T7 0.75 c 1.82 c 2.80 be 1.79 c
Ts 0.60d 1.60 cd 2.38d 1.52 f
'T9 0.52e 1.70 cd 2.86 be 1.69 d
TIO 0.42f 1.32 e 2.32 de 1.35 g
LSD(0.01) 0.08 0.22 0.38 0.05
TJ =Farmer's stored seed (control) T2=Apparently healthy seed
T3 =Fanner's stored seed treated with vitavax-200 @ 0.4%
T4 =Apparently healthy seed treated with vitavax-200 @ 0.4%
T5 =Fanner's stored seed washed with water T6=Apparently healthy seed washed with water
T7 =Fanner's stored seed treated with brine solution @ 2%
T8=Apparently healthy seed treated with brine solution @ 2%
T9 =Washed fanner's stored seed treated with brine solution @2%
rIO
=Washed apparently healthy seed treated with brine solution @2%36
4.2.6. Effect of seed treatment on spikelet formation of wheat
Considering the number of spikelets/ear different seed treatments did not differ significantly (Table 9). The lowest number of spikelets/ear (19.17) was recorded in the treatment TJ (farmer's stored seed). On the contrary the highest number of spikelets/ear (20.10) was recorded in the treatment Ts (apparently healthy seed treated with brine solution @ 2%).
Considering the number of healthy spikelets/ear different seed treatments did not differ significantly. (Table 9). The lowest number of healthy spikelets/ear (17.96) was recorded in the treatment TJ (fanner's stored seed). On the contrary the highest number of healthy spikelets/ear (20.04) was recorded inthe treatment T4 (apparently healthy seed treated with vitavax-200 @0.4%.
Considering the number of diseased spikelets/ear different seed treatments did differ significantly. (Table
9).
The highest number of diseased spikelets/ear (1.21) was recorded at the treatment T\ (farmer's stored seed). On the other hand the lowest number of diseased spikelets/ear (0.04) was recorded in the treatment T4(apparently healthy seed treated with vitavax-200 @0.4%.
Table 9. Effect of seed treatment on number of spikelets / ear, number of healthy spikelets / ear and number of diseased spikelets/ ear of wheat.
Treatments Number of Number of healthy Number of diseased spikelets / ear spikelets / ear spikelets/ ear
TI 19.17 17.96 1.21 a
T2 19.64 .19.40 0.24 de
T3 19.96 19.84 0.12 f
T4 20.08 20.04 0.04g
T5 18.65 : 0.58 b
19.23
T6 19.78 19.56 0:22 de
T7 19.18 18.82 0.36c
Tg 19.92 0.] 8 ef
20.10
T9 19.49 19.21 0.28d
TIO 19.60 19.36 0.24 de
LSD(0.01) NS NS 0.07
NS = Non significant
TI =Farrner's stored seed (control)
T2
=
Apparently healthy seed .T3
=
Fanner's stored seed treated with vitavax-200 @ 0.4%T4
=
Apparently healthy seed treated with vitavax-200 @ 0.4%T, =Farmer's stored seed washed with water T6
=
Apparently healthy seed washed with waterT7=Farmer's stored seed treated with brine solution @2%
T8
=
Apparently healthy seed treated with brine solution @ 2%T9
=Washed fanner's stored seed treated with brine solution @ 2%T10=Washed apparently healthy seed treated with brine solution @2%
38
4.2.7. Effect of seed treatments on grain formation and grain weight of wheat Number of grains/ear, number of healthy grains/ear and number of diseased grains/ear varied significantly in respect of different physical and chemical seed treatments. (Table 10).
Number of grains/ear ranged from 33.03 to 40.60 where the highest and lowest counts were made under the treatments T4(40.60) and T1(33.03) respectively. The treatments T3, T4, T6 and T8 resulted statistically similar effect in producing grains/ear. All the treatments differed significantly from the treatment TJ (farmer's stored seed) in producing number of grains/ear.
Significant variations were recorded among the treatment under the present trial in number of healthy grains/ear (Table 10). The lowest number of healthy grains/ear (30.00) was recorded in the treatment TI (farmer'S stored seed). On the other hand, the highest healthy grains/ear (40.32) was recorded in the treatment T4 (apparently healthy seed treated with vitavax-200 @0.4%).
Significant variations were recorded among the treatment under the present trial in number of diseased grains/ear (Table 10). The highest diseased grains/ear (3.03) was recorded in the treatment TI (farmer's stored seed), which was closely followed by T, treatment (farmer's stored seed washed with water). On the other
39
'.
.'
hand the lowest diseased grains/ear (0.28) was recorded in the treatment T4 (apparently healthy seed treated with vitavax-200 @ 0.4%) that was statistically identical to the treatment T3 (fanner's stored seed treated with vitavax-200 @ 0.4%).
Considering the weight of healthy grains/ear there were no significant variations among the treatments (Table 10). But the lowest weight of healthy grain/ear (1.29 g) was recorded in the treatment TJ (farmer's stored seed). On the other way the highest weight of healthy grains/ear (1.75 g) was recorded in the treatment T4 (apparently healthy see~ treated with vitavax-200 @0.4%).
Considerable variation was recorded among the treatments under the present piece of experiment in weight of diseased grains/ear (Table 10). The highest weight of diseased grains/ear (0.16 g) was recorded in the treatment TJ (farmer's stored seed), which was closely followed by Ts treatment (farmer's stored seed washed with water). On the other hand the lowest weight of diseased grains/ear (0.03 g) was recorded in the treatment T4(apparently healthy seed treated with vitavax-200
@ 0.4%) that was closely followed by T3 (fanner'S stored seed treated with vitavax-200 @0.4%). From the results it was observed that farmer's stored seed gave the highest weight of diseased grains/ear.
40
~- ~.
H D --
Fig. 12. Apparently healthy and diseased grains of wheat
Table 10. Effect of seed treatment on number of grains I ear, number of healthy grains / ear, number of diseased grains/ ear, weight of grains/ 'ear, weight of healthy
. / d wei ht
fdi d /
fh t
grams ear an
weig 0isease 2rams earo
wea
Treatments Number Number Number Weight Weight Weight
of of healthy of of of of
grains! grains! diseased grains! healthy diseased
ear ear grains! ear (g) grains! grains I
ear ear (g) ear (g)
TI 33.03 e 30.0c 3.03 a 1.45 1.29 0.16 a
T2 38.24 be 37.04 ab 1.20 c 1.60 1.54 0.06 cd
T3 39.75 ab 39.25 ab 0.51 f 1.67 1.63 0.04 ef
T4 40.60 a 40.32 a 0.28g 1.78 1.75 0.03 f
Ts 36.83 d 35.22 b 1.6lb 1.52 1.44 0.08b
T6 39.31ab 38.34 ab 0.97 de 1.65 1.55 0.06 cde
T7 35.77 d 34~68 be 1.09 cd 1.67 1.60 0.07 be
Tg 39.34ab 38.52 ab 0.82/e 1.71 1.65 0.06 cd
T9 36.87 be 35.63 ab 1.24 c 1.65 1.58 0.07 be
TIO 37.62 c 36.82ab 0.80 ef 1.73 1.68 0.05 de
LSD(O.Ol) 1.52 5.08 0.18 NS NS 0.02
. NS =Non significant
TI =Farmer's stored seed (control) T2=Apparently healthy seed
T3=Fanner's stored seed treated with vitavax-200 @ 0.4%
T4=Apparently healthy seed treated with vitavax-200 @0.4%
T, =Farmer's stored