BRAC Research Report December 2011
Rifat Afroze
Assessment of Social and Emotional Skills of BRAC Staff
EDUCATION
Assessment of Social and Emotional Skills of BRAC Staff
Rifat Afroze
December 2011
Research and Evaluation Division
BRAC Centre, 75 Mohakhali, Dhaka 1212, Bangladesh E-mail: [email protected], www.brac.net/research
Telephone: 9881265, 8824180-87
For more details about the report please contact: [email protected]
ACKNOWLEDGEMENTS
A needs assessment study on social and emotional intelligence of BRAC staff was undertaken in collaboration with BRAC Learning Division (BLD) and BRAC University Institute of Education and Development (BUIED). We would, like to thank them for their cordial support. We would like to particularly thank Md. Abdur Rahman, Deputy Programme Coordinator and In-charge BLD and Anisa Haq, Senior Professional of BUIED for their keen interest and encouragement. Thanks to Ms. Nushrat Sharmin, Faculty Member of BLD for her regular support. Further, in tools making we got support from Mr. Noor-E-Alam Siddiqee, Mr. Kabir Ahmed and Ibrahim Khalil, staff of BUIED and BRAC Education Programme respectively. Special thanks are due to BLD faculty members Ms. Shabiha Sultana, Ms. Nazneen Imam, Ms. Nurun Nahar and Md.
Majharul Islam whose hard works help complete the survey in time. We would also like to thank Mr. Biman Chandra Roy, Manager, Data Management of HRD, BRAC for his valuable assistance. We are also grateful to Dr. Elizabeth Spier of American Institute of Research for her continuous attention and feedback for the study. Finally, we would like to express our gratitude to Mr. Samir R Nath, Programme Head, Educational Research Unit of BRAC Research and Evaluation Division for his valuable thought and interest in this.
RED is supported by BRAC's core fund and funds from donor agencies, organizations and governments worldwide. Current donors of BRAC and RED include Aga Khan Foundation Canada, AusAID, Australian High Commission, Bill and Melinda Gates Foundation, NIKE Foundation, Campaign for Popular Education, Canadian International Development Agency, Charities Aid Foundation-America, Columbia University (USA), Department for International Development (DFID) of UK, European Commission, Fidelis France, The Global Fund, GTZ (GTZ is now GIZ) (Germany), Government of Bangladesh, The Hospital for Sick Children, ICDDR,B Centre for Health and Population Research, Institute of Development Studies (Sussex, UK), Inter-cooperation Bangladesh, International Committee of the Red Cross, International Research and Exchange Board, Manusher Jonno Foundation, Micro-Nutrient Initiative NOVIB, OXFAM America, Plan Bangladesh Embassy of the Kingdom of the Netherlands, Royal Norwegian Embassy, SIDA, Stanford University, Swiss Development Cooperation, UNICEF, University of Leeds, World Bank, World Food Programme, Winrock International USA, Save the Children USA, Save the Children UK, Safer World, The Rotary Foundation, Rockefeller Foundation, BRAC UK, BRAC USA, Oxford University, Karolinska University, International Union for Conservation of Nature and Natural Resources (IUCN), Emory University, Agricultural Innovation in Dryland Africa Project (AIDA), AED ARTS, United Nations Development Program, United Nations Democracy Fund, Family Health International, The Global Alliance for Improved Nutrition (GAIN), The Islamic Development Bank, Sight Saver (UK), Engender Health (USA) and International Food Policy Research Institute (IFPRI).
RED received wide support and cooperation from all divisions of BRAC, particularly from the field staff and the people of Bangladesh without whose sincere support and patronage no field research could be conducted smoothly. RED also received useful comments, suggestions, and guidance from researchers, reviewers, and editors from within and outside the country, which helped improve the quality of research and research outputs. RED is indebted to BRAC management for its
ABSTRACT
BRAC Learning Division (BLD) has been assigned to design a training programme on social and emotional needs of an individual. Before doing so it is essential to assess those needs. As such this study was undertaken to assess the social and emotional intelligence of BRAC staff. The data were collected from 174 randomly selected staff of BRAC head office (level 9-14, equally distributed by sex) through survey and group interviews. The findings of this study will be used by BLD in designing a training module with support from American Institute of Research. Findings reveal that staff understood their emotions and linking with them, seems motivated in their work, cooperate effectively with their peers. However, they felt a bit difficulty on regulating emotions like anger, tension and stress. Moreover, lack of confidence, nature to avoid disagreement and less relationship management skills (with supervisor) hampered their productivity.
INTRODUCTION
For years it has been a lay belief that when we go for work we “should leave our emotions at home.” Not surprisingly, since it has long been thought that it is primarily people’s intellect that determines the line of work they are in, their success and effectiveness and their overall competence both in their private and professional lives.
Although this belief may certainly apply in some contexts, it should be viewed with caution. It may be true that certain Intelligence Quotient (IQ) levels are required for a person to get a certain job and maintain it. However, it has been shown that people who really stand out in their work are those who possess traits beyond intellect i.e.
maturity, experience in dealing with people and situations, and that (Goleman, 2001) has been called emotional health.
It has long been known that our emotions regulate our thoughts, actions and affect the way we handle situations and interact with others. Overlooking their importance in the workplace, therefore, would be a serious flaw. In fact, the role of intelligence and emotions in the workplace has been studied in the past three decades. According to Salovey and Mayer (1999), “Emotion is typically triggered in response to an event, either external or internal, that has positive or negative valence meaning for the individuals. Emotion can be distinguished from the closely related concept of mood in that emotions are shorter and general more intense.”
Intelligence, on the other hand, refers to a person’s ability to learn and remember information, to recognize concepts and their relations, and to apply the information in daily life in an adaptive way. In other words, it is a set of cognitive abilities that enable us to acquire knowledge for learning and solving problems. The importance of emotion in a person’s daily dealings at the workplace is inevitably interrelated with his or her intellect.
EMOTIONAL INTELLIGENCE (EI) AND SOCIAL AND EMOTIONAL INTELLIGENCE (SEI)
The term EI has been coined in scientific literature on a number of occasions to describe different things from simple mentions in psychotherapy treatment during the 1960s or as part of a multi-componential theory of intelligence (Gardner 1983). It was Goleman (1995), who popularized the term and offered a comprehensive account of the construct. Emotional Intelligence, then, refers to “The ability to perceive and express emotion, assimilate emotion in thought, understand and reason with emotion, and regulate emotion in the self and others” (Mayer et al. 1999). It is a combination of cognition and affect, intelligence and emotion. This EI construct enables us to investigate how people can effectively use their emotional resource in their daily lives Mount (2005).
There have been attempts to combine the emotional and the social components of the EI construct to accommodate both emotional and social skills. From the early definitions it was revealed that the social intelligence can influence the emotional intelligence. Before a decade the two theories Salovey and Mayer established that the two concepts are related and components are same. Both concepts can identify the self perceived ability, assess and control the emotion of a person or a group. There
Even though the term social intelligence was first coined in the 1920s (Thorndike 1920), Gardner (1993) produced a ‘multiple intelligences’ theory that a social intelligence was proposed, as one of the components that comprise a unitary intelligence. Specifically, he proposed that personal intelligence consists of an awareness of one’s own feelings (intrapersonal intelligence) and the ability to notice individual differences in other people and respond appropriately to them (interpersonal or social intelligence). Bar-On (1997, 2005), proposed a SEI scale that consists of both intrapersonal and social competencies and skills which combine to determine effective behaviour and interactions. As Bar-On puts it, SEI determines “how effectively we understand and express ourselves, understand others and relate with them, and cope with daily demands” (Bar-On, 2005). The emotional and social competencies and skills include, according to Bar-On, five key components:
(a) The ability to recognize, understand and express emotions and feelings;
(b) The ability to understand how others feel and relate with them;
(c) The ability to manage and control emotions;
(d) The ability to manage change, adapt and solve problems of a personal and interpersonal nature; and
(e) The ability to generate positive affect and be self-motivated.
Hence, SEI is an approach to understand, regulate, and express all emotional aspects in life.
EMOTIONAL INTELLIGENCE AND WORK EFFECTIVENESS
To what extent is emotional intelligence important for the work situations that people encounter? What is the connection between emotional intelligence, job satisfaction, productivity and work effectiveness? Is it possible for an organization to train its staff to be more emotionally competent? Answers to these questions come partly from research literature as well as present-day facts. In sum, it has been found that emotional intelligence, with its social components, influence organizations in a number of areas, namely productivity, efficiency and teamwork, as well as other subtler areas, such as the recruitment and the development of talent. Cherniss (2001), for example, concludes that the emotional intelligence of the mentor, supervisor or peer will influence the potential of a relationship with that person for helping personnel develop and use the talent that is crucial for organizational effectiveness. Zirkel (2000) found that the way the supervisors are perceived by staff reliably predicts leave rate.
In the beginning of the century, an estimated 250 billion dollars were spent for executive development in the US alone (Cherniss and Goleman 2001). Nowadays, universities and colleges in the UK emphasize the importance of emotional and social skills in finding employment, and they fund training programmes to increase young people’s employability.
MEASUREMENT OF SEI
The concept of EI has been more thoroughly investigated by Mayer (Mayer et al.
1999) and has been widely accepted by researchers. Mayer and Salovey’s model on regulating own emotions and others ( Mayer and Salovey 1997) and Goleman (1998) dealt with both personal and corporate achievements were widely accepted by researchers. Moreover, the Consortium for Research on Emotional Intelligence in Organization developed an Emotional Competence Framework (ECF) which offered a very useful frame. It subdivides the ECF into two segments - self and social
competences - which is somewhere overlap with several sub components. A brief description of this ECF can be found in Annex.
After few years, Mayer, Caruso and Salovey had made a significant change in the measurement of EI. They have decided to use multi-faced scale which includes all the information between ‘better’ and ‘worse’ answer. They have designed four hierarchical branches of EI such as perception and appraisal of emotion, ability to assimilate basic emotion, understanding and reasoning about emotion and management, and regulation of emotion (Mayer et al. 1999). By using factor analysis these four branches condensed into three factors-perception and appraisal of emotion, understanding, and managing emotion. They have designed self reported scale and checked reliability of each sub-scale of each single factor. Like other high quality test, it is also related to some important well-being criteria like life satisfaction, relationship quality, and parental warmth and so on. Further, several researchers have tried to develop self reported measures of EI and in general they have worked in four separate fields such as emotion perception, regulation, understanding, and utilization (Ciarrochi et al. 1999). There are several popular measures of EI such as Trait Meta Mood Scales (Mayer and Salovey 1990), Toronto Alexithymia Scale (Bagby et al. 1994), Bar- On Emotional Quotient Inventory (Bar-On 1997), The Emotional Control Questionnaire (Roger and Najarian 1989) and The Emotional Quotient (Goleman 1995). However, some other studies show that the self rated EI survey provides relatively less consistent data due to personal biasness (Davies et al. 1998).
ASSOCIATION WITH JOB SATISFACTION
Several studies showed that workers with high level of EI have more dedication and satisfaction in their work. The reason behind this is that, influence of EI can increase positive attitude, change in formal and informal behavior and enhance the feeling of justice. In addition, employees with high EI tend to be more satisfied with their job, better coping skills and ability to influence others. Moreover, it has also been found that those who are capable of managing their own emotions can control situations easier. Among the components of EI, understanding emotion and controlling ability were significantly affected in performance at workplace (Kafetsios and Zampetakis 2008). Furthermore, several researches have established that even though job satisfaction is partly influenced by expectation and past experiences, it is also inversely related with stress and it creates less effectiveness at work.
RATIONALE OF THIS STUDY
This study aims to assess the psychosocial needs of BRAC staff to devise a training programme to increase their social and emotional competences. Gaining insight of the EI level of BRAC employees could enable supervisors and higher management make better decisions regarding handling and more efficient use of employees.
METHODS AND METRIALS
OBJECTIVE OF THIS STUDY
This study aims to assess the social and emotional skills of BRAC staff. To achieve this we need to estimate the social and emotional intelligence of the BRAC employees.
So, we need to:
• Calculate the Social and Emotional Intelligence (SEI) of the staff in terms of personal and social competences in workplace.
• Find whether there is any association between job satisfaction (JS) and SEI score.
PARTICIPANTS AND PROCEDURE
Data were collected from 174 randomly selected head office staff through self- completed questionnaire and group interviews. They belonged to pay levels 9 to 14 from 34 departments (Table 1). The Human Resource Division provided a list of 638 employees, 438 males and 200 females. They were divided into three groups: 228 in levels 9-10, 297 in levels 11-12, and 113 in levels 13-14. Respondents were selected randomly from each group. The selected employees were asked to read each question carefully and tick the appropriate box. Three respondents sent blank questionnaires and three respondents didn’t provide background information. Thus, the sample size finally stood at 174. Furthermore, four group interviews (five employees in each) took place to gain insight on the personnel’s overall experience of working at BRAC. The researcher rotated the questions to each person within the group, so that each of them could express their own opinion.
Table 1. Level and sex-wise respondents in the survey
Level Male staff Female staff Total
9 and 10 26 32 58
11 and 12 28 31 59
13 and14 43 14 57
Total 97 77 174
THE INSTRUMENT USED IN THE SURVEY
To estimate the SEI of BRAC staff, a competence framework developed by The Consortium for Research on Emotional Intelligence1 was used. This generic competency framework is derived, for the most part, from Working with Emotional Intelligence by Daniel Goleman2. In addition, job satisfaction of BRAC employees was also measured. For measuring job satisfaction we have followed Patricia C. Smith’s3 measurement techniques.
1 http://www.eiconsortium.org/about_us.htm
2 http://www.eiconsortium.org/pdf/emotional_competence_framework.pdf
3 http://www.sba.oakland.edu/Faculty/york/Readings434/Readings/Development%20of%20a%
20method%20of%20measuring.pdf
To measure SEI, a five point Likert scale was used. It was used to measure the respondents' perceptions by asking the extent to which they agree or disagree with a particular statement. There are five competencies and each of them has several sub- components. Seventy-five sub-components are included in this framework. Initially, for every sub-component we formulated one statement. A few sub-components were found too difficult to measure, so they were excluded. Then, the researcher set directions for each table. She had requested the participants to read each question carefully and tick to the appropriate box. Though Likert is a bipolar scaling method, here both the positive and negative modes were considered. There was a possibility, as in every Likert scale, that the respondents may avoid choosing extreme answer(s), so to reduce this bias we have tried to make a balance of positive and negative statements wherever applicable.
To measure job satisfaction Smith’s index was used which encompasses five main competencies, each of which has several sub-components. These are work, supervision, co-worker, pay and promotion. For each segment we made 2 items, totaling to 10 items for measuring job satisfaction. The participants were requested to read each question carefully and tick the appropriate box. Though Likert is a bipolar scaling method, both positive and negative mode statements were used.
Initially, we generated lots of questions, more than we required. The questionnaire was prepared in a way so that it was understandable to different levels of staff participating in the survey. To ensure this, a trial of this questionnaire was also conducted at the head office where 14 colleagues participated. After completing the questionnaire, we talked to them individually. From this discussion three important findings were revealed. Some statements were ambiguous and some terms were unclear to the respondents; and they felt hesitant to respond to some issues. Based on these some statements were re-phrased and some were excluded. Finally, 59 statements for SEI and 10 statements for JS were used. Furthermore, a brief introductory section which explained the purpose of the survey was included.
DATA ANALYSIS
For the analysis, we summed all the scores and then estimated the mean or mode of each competence. Further, dispersion was summarized by the range. Moreover, for inferential techniques, chi-square test (for proportions) and t-test (for means) were applied for comparisons within two groups (male and female), and ANOVA for comparisons within different job levels. For the median, a Mann-Whitney test was also applied. Moreover, association between SEI score and job satisfaction score was also measured. And to know which factors influence SEI and JS score, multiple regression models were established. Finally, for reliability testing Cronbach`s Alpha was used to measure the internal consistency of data.
RELIABILITY AND VALIDITY OF DATA
Test of reliability refers the consistency of any measurement. Here we estimated Cronbach’s Alpha which found 0.79, an acceptable value of the research instrument.
Furthermore, the reliability of five sub scales of SEI also achieved satisfactory values, which were more than 0.6. The item-wise reliability and item-total correlation are placed in Annex.
STRENGTHS AND SHORTCOMING OF THE STUDY
This study includes a measurement of a multi-factor SEI scale which was based on perceiving, understanding and managing emotion in the workplace. Decent reliabilities of the data, sample from various groups and mixed methods of data collection can be considered as strength of this study. However, people tend to be more positive about themselves and less positive to others. For this reason, self rating SEI sometimes provides biased answers. The perception and appraisal of emotion can be measured by having people identifying emotion on face, reaction and behavior. If this study could include some observations of staff dealing with their peers and how they express emotion, then it would be more accurate for assessing their needs.
ETHICAL CONSIDERATION
The respondents were informed about the purpose of the research, and they were free to participate. No one was forced to join. Their identity was not disclosed in the questionnaire as well as for the qualitative part.
FINDINGS
BACKGROUND INFORMATION OF THE RESPONDENTS
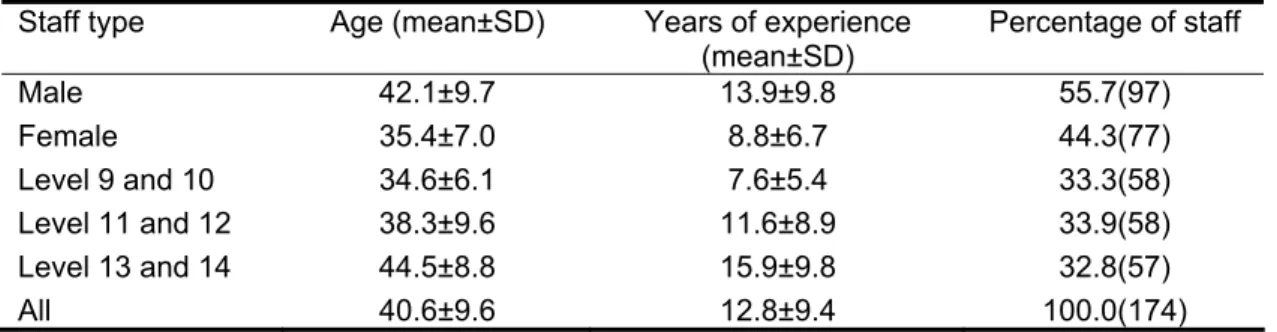
Mean age of the respondents was nearly 41 years, males around 42 years and females around 35 years (Table 2). Length of service was about 14 years for males and about 9 years for females. As expected, a positive relationship between age of the respondents and level of employment within BRAC was observed.
Table 2. Background information of the respondents Staff type Age (mean±SD) Years of experience
(mean±SD) Percentage of staff
Male 42.1±9.7 13.9±9.8 55.7(97)
Female 35.4±7.0 8.8±6.7 44.3(77)
Level 9 and 10 34.6±6.1 7.6±5.4 33.3(58) Level 11 and 12 38.3±9.6 11.6±8.9 33.9(58) Level 13 and 14 44.5±8.8 15.9±9.8 32.8(57)
All 40.6±9.6 12.8±9.4 100.0(174)
AWARENESS OF INDIVIDUAL EMOTIONS
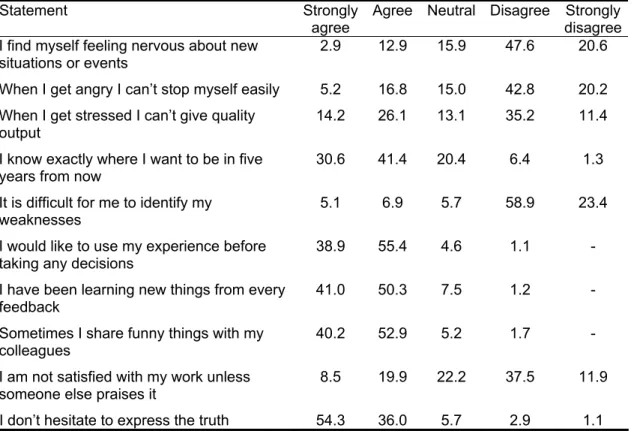
According to Goleman (1998), self-awareness of emotion can be explained by recognizing own emotions and effects, knowing one’s strengths and limitations and confidence about one's self-worth and capabilities. To estimate BRAC employees’ self awareness about emotions, ten statements were used to ultimately classify the opinions into five categories. Table 3 presents item-wise proportion of opinion on self awareness. The findings reveal that workers suffered from anger, tension, stress, and felt less confident about their performance. Nearly 40% of the respondents agreed that when they felt stressed they could not give quality output. This was confirmed by the participants of group discussions, where they expressed worry about fulfilling the demands of their job and meeting deadlines.
Table 3. Opinions on awareness on individual emotions
Statement Strongly agree Agree Neutral Disagree Strongly
disagree I find myself feeling nervous about new
situations or events
2.9 12.9 15.9 47.6 20.6 When I get angry I can’t stop myself easily 5.2 16.8 15.0 42.8 20.2 When I get stressed I can’t give quality
output
14.2 26.1 13.1 35.2 11.4 I know exactly where I want to be in five
years from now 30.6 41.4 20.4 6.4 1.3
It is difficult for me to identify my
weaknesses 5.1 6.9 5.7 58.9 23.4
I would like to use my experience before
taking any decisions 38.9 55.4 4.6 1.1 -
I have been learning new things from every
feedback 41.0 50.3 7.5 1.2 -
Sometimes I share funny things with my
colleagues 40.2 52.9 5.2 1.7 -
I am not satisfied with my work unless someone else praises it
8.5 19.9 22.2 37.5 11.9 I don’t hesitate to express the truth 54.3 36.0 5.7 2.9 1.1
Additionally, ensuring the quality of their task also gives them strain. One staff stated that the modern life is full of hassles and frustrations which may stem from personal and family issues, but they can affect professional life as well. Another staff mentioned that sometimes it was hard to cope with challenges in workplace, which created extra pressure, particularly “reduces speed and quality of work.”
BRAC staff agreed with the statement that sometimes they got angry in office if tasks were not done as planned or if any misunderstanding occurred with their colleagues. However, nobody agreed that they lost their control fully. Generally, they kept quiet when they got angry in the office. They thought that if they took a break it helped them to understand the situation. It also helped to think about the cause of anger and find the way to get rid of it. All the respondents were aware about the effect of anger, it hampered the work flow, created trouble in relationships with colleagues, caused some health problems like headache and anxiety. Antipathy among personnel is not expected in work place and they believe it is better not to say anything on that time or not share it with others. However, it doesn’t reduce dispute.
The survey reveals that BRAC personnel were less satisfied about their performance; they will not assess it favourably unless other colleagues praise it. That may well mean that their job satisfaction depends on how others (particularly supervisors) assess their work. One male employee reported that everything depends on supervisor’s approach. If the supervisor shows trust and belief on their staff and their capabilities, then the staff’s confidence level increases automatically. Hence, staff can gain a sense of self-efficiency if their manager guides them properly and deals with cases of low self-esteem carefully.
Table 4. Summary of awareness on individual emotions score Year Male Female Level 9 and
10 Level 11
and 12 Level 13
and 14 All Mean±SD 37.6±4.8 37.7±4.9 37.8±4.6 37.5±4.9 37.8±5.1 37.7±4.9 Median 38.0 39.0 38.0 38.0 39.0 38.0 Mode 37.0 41.0 42.0 41.0 43.0 39.0 Means and medians are not significantly varied between male and female staffs
Means and medians are not significantly varied between different level staffs
Table 4 shows the summary of self awareness score. Ten items were used for measuring staff’s awareness on their emotions. For each response, the respondents got score for strongly disagree=1, disagree=2, neutral=3, agree=4, and strongly agree=5. In case of negative statement, this score was reversed. But averaging all the score the BRAC staff got 37.7 out of 50 in the self awareness part and the individual scores were not much far away from the mean. The sex-wise distribution reveals that both male and female staff got similar scores which are not significantly varied from each other. Similar findings were revealed from level-wise categories which were also found not significantly varied within three categories. Moreover, the middle score found 38 which are almost same in sex and level-wise segregated groups. The median difference within groups was not significantly varied either. The mostly obtained score was 39 which are not far from the median.
REGULATING EMOTIONS
It is important for people to regulate their emotions in every aspect of daily life.
Managing own feelings and distressing emotions is the most significant factor to regulate emotions.
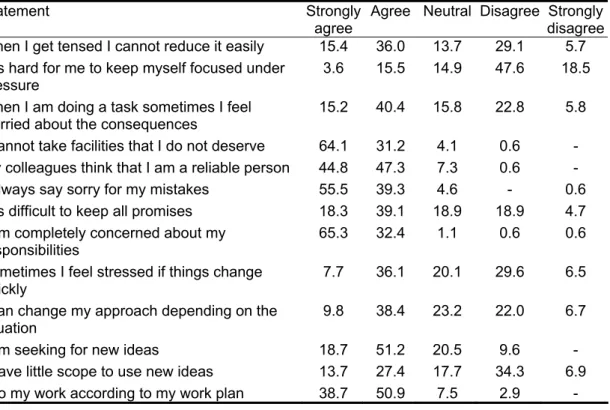
Table 5. Item-wise proportion of opinion on regulating emotions
Statement Strongly agree Agree Neutral Disagree Strongly
disagree When I get tensed I cannot reduce it easily 15.4 36.0 13.7 29.1 5.7 It is hard for me to keep myself focused under
pressure 3.6 15.5 14.9 47.6 18.5
When I am doing a task sometimes I feel
worried about the consequences 15.2 40.4 15.8 22.8 5.8 I cannot take facilities that I do not deserve 64.1 31.2 4.1 0.6 - My colleagues think that I am a reliable person 44.8 47.3 7.3 0.6 - I always say sorry for my mistakes 55.5 39.3 4.6 - 0.6 It is difficult to keep all promises 18.3 39.1 18.9 18.9 4.7 I am completely concerned about my
responsibilities 65.3 32.4 1.1 0.6 0.6
Sometimes I feel stressed if things change
quickly 7.7 36.1 20.1 29.6 6.5
I can change my approach depending on the
situation 9.8 38.4 23.2 22.0 6.7
I am seeking for new ideas 18.7 51.2 20.5 9.6 -
I have little scope to use new ideas 13.7 27.4 17.7 34.3 6.9 I do my work according to my work plan 38.7 50.9 7.5 2.9 -
In addition, self-control, trustworthiness, conscientiousness, adaptability and innovativeness also comprised the social and emotional competence frame work.
Table 5 shows that more than half of the respondents were worried, less able to reduce tension, and less willing to keep promise. Again, nearly 40% of the respondents had less adaptability and innovativeness. Even though nearly 90% of the respondents liked to stick to their work plan, almost half of them reported that they could change their approach depending on the situation. Further, nearly 70%
reportedly sought new ideas, although only 40% of them felt that there was plausibility to use them. These findings may well be indicative of staff striving for adaptability and innovativeness. However, as employees reported, there is little room for implementing new ideas or initiatives.
From group discussion it was evident that staff were worried and tensed about making mistakes. In order to tackle this kind of negative emotion effectively, “there needs to be a complete guideline for doing any work, and it is essential to make a network of sharing” - as one respondent opined. Another respondent said that his colleagues were very co-operative; they helped him by giving positive feedback.
Several staff emphasized on doing work systematically and sharing with supervisors and colleagues. It is helpful to reduce tension and keep on the right track.
Adaptability is a valuable character trait which helps those who possess it to be flexible with their work and across a wide range of situations. The findings indicate that the staff felt stressed when coming across new situation and assigned with new tasks.
The outcome of the group interviews were in line with the survey findings. The respondents reported that they felt nervous if they needed to do a new task or working in a new arena. Part of the work in BRAC sometimes requires staff shifting from one programme to another, therefore they are often asked to cooperate with new associates and people they have never worked with before. Hence, it is vital that they communicate effectively and deal with them in a fruitful manner for a productive outcome. One male worker reported that, “In new situations I try to believe in my abilities so that I can feel comfort and confident to deal with new people or situations.”
Table 6. Summary of regulating emotions score
Year Male Female Level 9
and 10
Level 11 and 12
Level 13 and 14
All
Mean±SD 45.5±5.1 44.2±5.3 44.1±5.8 45.5±5.4 45.2±4.2 45.2±5.1 Median 45.0 44.0 44.0 45.0 45.0 45.0 Mode 43.0 42.0 44.0 49.0 44.0 44.0 Means and medians are not significantly varied between male and female staffs
Means and medians are not significantly varied between different level staffs
Table 6 summing up the score of regulating emotion items. Thirteen items were used for estimating emotion regulation. Staff got 45.2 score on an average, male staff got a bit high score but the means did not vary significantly. The findings also show that the lowest level employees had skill to control their emotion. These means are not statistically different from each other. The median of all the staff was 45 and almost similar in different groups. Staff mostly scored 44 and it was found highest among 11 and 12 level staff.
SELF MOTIVATION
For this study, self-motivation is defined as the ability to improve standard of work,
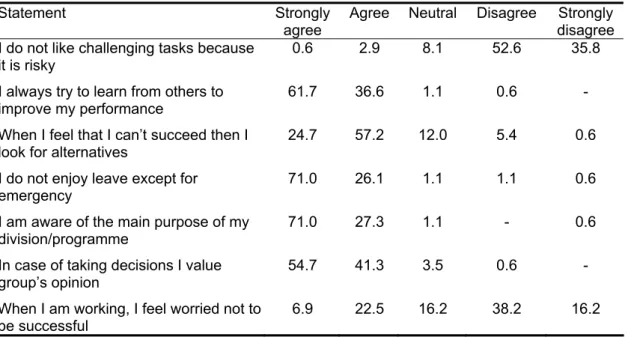
persistence in pursuing goals despite obstacles. Table 7 describes the proportions of perceptions of employees’ agreement or disagreement on self motivations. BRAC workers were found much motivated (more than 80%) about improving their performance, taking challenging task, less demanding on leave, aware of division’s goals and valuing the group’s opinion. However, nearly one-third of the workers had fear of failure rather than hope for success. Therefore, it can be said that a significant amount of BRAC staff are less optimistic about success.
Table 7. Item-wise proportion of opinion on self motivation
Statement Strongly
agree Agree Neutral Disagree Strongly disagree I do not like challenging tasks because
it is risky 0.6 2.9 8.1 52.6 35.8
I always try to learn from others to
improve my performance 61.7 36.6 1.1 0.6 - When I feel that I can’t succeed then I
look for alternatives
24.7 57.2 12.0 5.4 0.6 I do not enjoy leave except for
emergency 71.0 26.1 1.1 1.1 0.6
I am aware of the main purpose of my division/programme
71.0 27.3 1.1 - 0.6
In case of taking decisions I value
group’s opinion 54.7 41.3 3.5 0.6 -
When I am working, I feel worried not to
be successful 6.9 22.5 16.2 38.2 16.2
The qualitative data explain these findings more thoroughly. In most BRAC departments, assignments are distributed in teams where the staff get more opportunity to learn quickly. In a group discussion, a participant mentioned that when creating a team his supervisor was always aware of putting a less skilled employee with a more skilled employee. Hence, the workers can improve their work standards by sharing experiences and modelling their performance on other, more skilled colleagues. The respondents agreed that if they constantly worry about their task, they will achieve less. However, every person has different motivations for working. As reported, more work but less payment can affect inspiration negatively. Moreover, it also appeared that monotonous work can also hamper the drive for achievement, which is somewhat contradictory to the finding that BRAC employees tend to feel stressed when confronted with new tasks and situations (Table 5).
Table 8. Summary of self motivation score Year Male Female Level 9 and
10 Level 11 and
12 Level 13 and
14 All
Mean±SD 29.5±2.9 29.1±3.6 29.6±3.2 29.5±2.8 28.8±3.6 29.4±3.1 Median 30.0 29.0 30.0 30.0 29.0 30.0 Mode 31.0 29.0 30.0 30.0 28.0 30.0 Means and medians are not significantly varied between male and female staffs
Means and medians are not significantly varied between different level staffs
The BRAC workers got, on an average, 29.4 score out of 35. The level of motivation was found almost same for both male and female staff (Table 8). The higher the job position the less motivation the workers had. The median was 30 and also mostly the same except in female workers. Finally, means and medians were not significantly varied within groups.
SOCIALLY AWARE
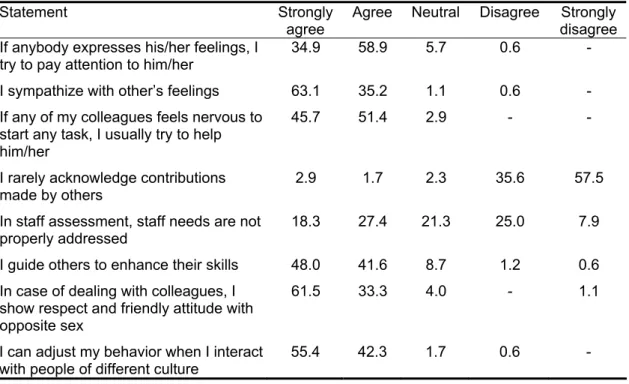
Goleman (1998) divided the social competence model into several segments like empathy, developing others, leveraging diversity and political awareness. Table 9 presents social awareness in workplace measured by using eight statements. Firstly, it appears that over 90% of BRAC employees have the capacity to recognize others’
feelings and try to understand others’ happy or sad incidents in life. Similarly, 97.1% of the employees tried to help others if they needed. Few people (4%) rarely acknowledge and reward people’s strengths and contributions. Perhaps more importantly, approximately 46% employees were found dissatisfied with their staff assessment process. They thought it did not offer useful feedback and did not identify the needs for development properly. Nearly 90% of the employees were found to be open for guiding others. Lastly, more than 90% of the respondents agreed that they showed sensitivity with staff from opposite sex and different culture.
Table 9. Item-wise proportion of opinion on social awareness
Statement Strongly
agree Agree Neutral Disagree Strongly disagree If anybody expresses his/her feelings, I
try to pay attention to him/her 34.9 58.9 5.7 0.6 - I sympathize with other’s feelings 63.1 35.2 1.1 0.6 - If any of my colleagues feels nervous to
start any task, I usually try to help him/her
45.7 51.4 2.9 - -
I rarely acknowledge contributions made by others
2.9 1.7 2.3 35.6 57.5 In staff assessment, staff needs are not
properly addressed 18.3 27.4 21.3 25.0 7.9 I guide others to enhance their skills 48.0 41.6 8.7 1.2 0.6 In case of dealing with colleagues, I
show respect and friendly attitude with opposite sex
61.5 33.3 4.0 - 1.1
I can adjust my behavior when I interact with people of different culture
55.4 42.3 1.7 0.6 -
According to the respondents, social awareness is like being aware of social perspectives and relationship with others. They said that they are aware about others’
feelings and perspectives, and pay attention when colleagues express emotional cues.
They also try to show sensitivity and help others when they struggle with their task.
Again, they also agreed that they got same attention and help from their team mates when they need help and kindness. Moreover, the respondents also agreed that in making sense of a person’s dignity, or adaptation, the common cultural background makes a person culturally aware. Nowadays, BRAC programmes expand in other countries so it is required to understand diverse worldviews and show sensitivity to
On the other hand, a completely opposite scenario was found from the female staff. In group discussion, female employees reported that they got less recognition for their work and their male supervisor is less keen to open up with them. They also added that it creates a distance, so it hampers their learning from supervisor. One female staff member raised a new issue, as she reported that when she was working as a field manager, some of her male subordinates were less keen to accept her as their manager, and openly raised their concern about her proficiency. Furthermore, two female staff discussed the common several problems during pregnancy and lactating period. On that time, they reported, support was required from the supervisor and colleagues, especially in times of sickness. Perceiving others as considerate to their situation can make them more motivated for work. One female staff mentioned,
“When I have joined after maternity leave I was always worried about my baby and could not concentrate in work properly. Observing this, one of my male colleagues told harshly why did I join now? I might take one year leave. BRAC allows us to take one year unpaid leave, but it is also true that I need to get salary otherwise it is difficult to move on”. They said that they did not want any extra facilities except sympathy because on that time women had some physical and mental changes. And it takes time to manage these changes.
The respondents agreed that staff assessment did not offer useful feedback and did not identify people’s needs for development properly. From group discussion, one issue is prominent- staff are not satisfied with the way their needs are identified for training. A staff member mentioned that if he doesn’t agree with his assessment he doesn’t share it with his manager. The reason he cited is that such disagreement “is not welcome in BRAC”. Additionally, workers have reported that their own demands on training are sometimes ignored or they are less interested on their given training.
Moreover, several workers agreed that a reverse appraisal system should be introduced for the supervisors. This appraisal system would rate the supervisors on such attributes as leadership skills, honesty, transparency, accountability, gender sensitivity and sympathy. Should this appraisal system be introduced, the rating would be done by subordinates. The logic behind that is, if subordinates need to show empathy then the supervisor needs to show empathy as well. And maybe they would need training in this regard.
Table 10. Summary of social awareness score Year Male Female Level 9 and
10
Level 11 and 12
Level 13 and 14
All Mean±SD 33.6±3.4 32.9±4.1 33.4±3.3 32.6±3.6 34.0±4.2 33.5±3.6 Median 34.0 33.0 33.0 33.0 34.0 34.0 Mode 34.0 33.0 32.0 31.0 36.0 34.0 Means and medians are not significantly varied between male and female staffs
Means and medians are not significantly varied between different level staffs
Table 10 shows that employees proved their concern and responsibility to others.
On an average they obtained 33.5 score out of 40 which was the highest score among the other five competences. Male staff showed more sensitivity in case of sympathy and care, understanding, acknowledging and guiding others. Moreover, the seniors were found to be more socially alert. But the mean and median were not much different between the groups.
SOCIAL SKILLS
The respondents reported a high degree of confidence in their abilities to communicate their message effectively, to argue their point even if it requires them to disagree with their colleagues, to lead their team if necessary and to face up more difficult challenges. About 63% of the respondents reported that they could influence others, and 87% reported that they could adapt their choice of wording according to their audience. Moreover, about 75% reported that they were always open for debate and nearly 90% reported that they used to listen attentively to their colleagues’ ideas and suggestions (Table 11). This can only mean a fine degree of cooperation among BRAC staff.
Table 11. Item-wise proportion of opinion on social skills
Statement Strongly
agree Agree Neutral Disagree Strongly disagree I can influence others 17.2 46.5 26.8 7.6 1.9 I can fine-tune my words according to my
audience 18.8 68.2 7.6 5.3 -
I can express my feelings easily 24.3 43.4 16.2 14.5 1.7 When I need to do something difficult, I find
it hard to motivate myself to get started 2.3 4.7 17.0 53.8 22.2 I listen attentively to other’s ideas and
suggestions 59.1 39.8 0.6 0.6 -
I can motivate my team mates to meet our
objectives 37.9 54.4 7.1 0.6 -
I can lead my team, if it necessary 50.9 43.9 4.6 0.6 - I let my team mates know what needs to
be done and how it needs to be done
37.8 57.6 4.1 0.6 - When I lead my team mates I prefer to use
examples
38.0 46.6 12.9 2.5 - To update myself, I don’t like to face
challenges
0.6 4.0 4.6 49.1 41.7 I can handle tough people diplomatically 10.2 38.9 36.9 10.8 3.2 I ignore the issues which may bring about
disagreements 0.6 19.9 24.0 40.9 14.6
I am always open for debates 38.1 36.4 13.6 10.2 1.7 I can start conversation smoothly 24.9 50.3 15.6 8.7 0.6 Colleagues are my good friends 43.6 45.3 6.4 4.1 0.6 I am emotionally attached with my
colleagues
28.2 64.4 6.3 1.1 - I always share my plans before starting
work on it
18.7 51.2 20.5 9.6 - In case of group work, I pay attention on
good relationship with my team mates
55.4 42.9 1.7 - -
Within a team, members should respect and help each other
85.2 14.2 0.6 - -
I encourage active participation of my team mates
59.8 39.7 0.6 - -
My team works well because my team
mates work well 51.4 41.0 6.4 1.2 -
However, nearly 20% reported that they tend to ignore issues that may bring disagreement; while it appears that more employees are confident of handling co- workers diplomatically. Almost every staff member agreed that colleagues should respect and help each other and encourage active participation within a team. Finally, around 75% of the respondents indicated that they could easily motivate themselves to carry out a difficult task, whereas the majority would face new challenges to update themselves.
Regarding self-completion, nearly one-fifth of the respondents reported that they were reluctant to bring about issues that might raise disagreement. In the group discussions, several participants agreed that they preferred to stay in comfort zone.
They thought that it would be more effective to discuss such issues later. Both groups needed time to rethink about their logics. Several staff members said that they tend to express their opinion, but then left it with their supervisors to handle. Some employees agreed that there is less scope for discussion in BRAC. Two main reasons have been cited for this: one, they suppose that they are less welcome and two, nobody wants to start clash with others.
In general, workers reported that they are comfortable working as part of a group.
However, some of them raised concern that not everyone shares their ideas with the group. Instead, they are saving it for the presentations. As one employee put it, “Some people don’t share their idea within the group. They would rather express it in a presentation and take the credit individually. In that case our manager gives us feedback to cooperate”. That sort of competitive attitude makes some people difficult to work with.
Furthermore, sometimes they have to deal staff who are negative, oppose their ideas, or simply do not like them. In these crucial moments, it’s quite natural to lose track and difficult to control their responses. Workers express several “techniques” that they apply to cope with this situation. The most widely used method is keeping silence at the time and then shares it with superior or other colleagues. Another one is, trying to take other’s perspective, and considers whether he or she may be on the right track.
And finally, when dealing with tough people, be a bit prepared by keeping a cool-head and trying to keep a milder tone. Hence staff members are aware about raising any dispute.
Table 12. Summary of social skills score Year Male Female Level 9 and
10
Level 11 and 12
Level 13 and 14
All Mean±SD 85.4±10.1 82.3±11.6 82.3±11.6 83.6±11.5 85.4±11.2 84.8±10.5 Median 87.0 84.0 84.0 85.0 88.0 85.0
Mode 90.0 84.0 84.0 80.0 92.0 90.0
For mean and median p<0.1 between male and female staffs
Means and medians are not significantly varied between different level staffs
On an average BRAC employees showed good skill in social reinforcement.
Here, we used 21 items and like other competences the highest score of each items is 5 so that they got 84.8 score out of 105 (Table 12). Male employees established that they had applied more techniques to communicate, relate and socialize with others.
Similarly the higher ranked staff also captured this quality. Moreover, means of different groups were significantly differ with each other. Additionally, the middle value of this score found 85 and it also differ between groups statistically.
JOB SATISFACTION
Job satisfaction (JS) can simply be described as to whether people are happy with his/her job or not. That means an affective response of worker to his/her job.
According to Smith’s (1969) Job Descriptive Index (JDI), JS depends on five different desirable factors like pay, promotion, supervision, co-worker and the work itself. Table 13 represents 10 statements - two for each factor. Just over one-fourth of the staff reported that they got sufficient appreciation of their good work. Additionally, 85.5%
staff agreed that they felt pride for working with BRAC. Likewise, staff appeared dissatisfied in-terms of payment and job security. Regarding supervision, nearly one- fourth of the staff opinioned that they had difficulty in satisfying their supervisors.
Nearly 70% of the staff agreed that their supervisors had the knowledge of how to make their subordinates more efficient. In case of co-worker BRAC personnel seem quite lucky, almost 80% of them reported that they had faith and they got co-operation from their colleagues (Table 13).
Table 13. Item-wise proportion of opinion on job satisfaction
Statement Strongly
agree Agree Neutral Disagree Strongly disagree I have received adequate recognition for
my good performance 10.3 30.9 22.3 26.9 9.7 I feel pride when I say I work for BRAC 51.4 34.1 12.1 1.7 0.6 The remuneration is less than I deserve 35.3 31.2 21.8 9.4 2.4 I feel my position is secure in this office 33.7 33.7 14.0 13.4 5.2 It is very hard to please my supervisor 9.9 14.5 22.1 39.0 14.5 My supervisor lets me know how I can do
well 24.0 45.1 12.6 13.7 4.6
I trust my colleagues 34.3 49.7 12.0 3.4 0.6 It is rare to get support from my colleagues 2.3 5.8 13.9 62.4 15.6 The opportunity of getting a promotion
here is limited 19.5 32.5 16.6 26.0 5.3
This organization has unfair promotion
policy 12.2 21.3 30.5 28.7 7.3
Last but not least, approximately half of the staff thought that there was inadequate promotion in BRAC and more than 30% deemed that BRAC has unfair promotion policy as well. Hence, in BRAC staff felt good in terms of their work type and bonding with co-worker. However, they felt a bit discomfort when they reconcile the way to satisfy their manager, salary and promotion policy.
Table 14. Summary of job satisfaction score Year Male Female Level 9 and
10 Level 11 and
12 Level 13 and
14 All Mean±SD 34.8±6.6 30.9±7.4 30.9±7.4 32.5±7.3 34.5±6.8 33.9±6.9 Median 35.0 30.0 30.0 32.0 34.0 33.0 Mode 34.0 30.0 30.0 29.0 32.0 32.0 For mean p<0.01 between male and female staffs
For median p<0.05 between male and female staffs
Table 14 shows the average JS-score of 33.99 out of 50. Among the staff, females were found less pleased with their job and the mean difference with their counterpart score was found significantly varied. What’s more, the higher levelled workers had higher level of JS compared to the other two groups, but the mean scores were not significantly varied between groups. In case of median score the sex-wise segregation had significant difference while the opposite findings revealed from level- wise segregation group.
COMPARING MEAN SCORES BETWEEN FIVE SUB SCALES
There is a remarkable similarity between male and female workers’ mean scores on SEI aspects. As Figure 1 shows, even though male personnel scored higher in every aspect of SEI (only scores of self-awareness are similar), there is virtual parity on the fluctuation of mean scores.
Figure 1. Sex-wise mean comparison between five sub-scales Percentage of Mean
67 72 77 82 87
Self awareness
Self regulation
Self motivation
Social awareness
Social skills
Male Female Both
That is, wherever men scored highly so did women, and wherever men scored low so did women. Specifically, both male and female workers show the same level of self awareness; they both score remarkably low on self regulation, whereas both men and women score highest on self motivation. And these five means are significantly differ within male and female staff. We can safely conclude that there is gender equality on Social and Emotional Intelligence among BRAC staff.
Thus, the profile of the BRAC worker is someone who knows his emotions, highly motivated in reaching the set goals, cooperates effectively with colleagues, yet felt a bit difficulty to cope with stress and lack of confidence at times.
The findings show level-wise parity regarding the aspects of SEI among BRAC employees; all levels show similar fluctuation in mean scores (Fig. 2), i.e. all scores have high and low at the same segments of SEI. Findings also show that the level 9- 10 has low scores on self regulation. Young workers felt somewhat uneasy in coping with daily stresses and job challenges. The other two groups (Levels 11-12 and 13-14) scored noticeably higher on this aspect. Level 9-10 group has the most self-motivated workers, with workers from Level 13-14 group scoring lower than the rest. Perhaps motivation is decreased when the job level increased. Level 13-14 group scored higher
than the rest on social awareness and social skills, perhaps indicative of their willingness to help their younger colleagues develop and achieve their potential within BRAC.
Figure 2. Job level-wise mean comparison between five subscales Percentage of Mean
67 72 77 82 87
Self awareness Self regulation Self motivation Social awareness
Social skills
Level 9 and 10 Level 11 and 12 Level 13 and 14
Moreover, employees from the level 11-12 group have scored slightly lower in self awareness and much lower in social awareness than the other groups. Finally, it comes as no surprise that the more experienced BRAC staff possess the higher degree of social skills, with the level 9-10 workers still learning their conduct. Overall, these findings may well reflect a positive and cooperative working atmosphere between the more experienced BRAC staff and their younger colleagues.
Figure 3 shows the mean compression of SEI score with respondent’s age. Here, we made three groups - the youngest group comprised of those workers who are less than 35 years of age, middle-aged group comprised of those aged 35-45 years, and the last group comprised of employees aged greater than 45 years. The youngest group was found more aware of their own emotions and able to link it. Regarding controlling emotions, employees were found less capable from each group. Keeping disruptive emotion in control and express appropriate manners are difficult at every age in a BRAC employee’s life. Moreover, employees expressed a good level of motivation in their work, whereas the oldest group was found a bit less motivated than others. However, the oldest group proved that they were more proficient in social competences. Probably awareness of the emotions of others and dealing with them properly can increase with age.
Figure 3. Age-wise mean comparison between five sub-scales Percentage of Mean
67 72 77 82 87
Self awareness
Self regulation Self motivation
Social awareness
Social skills
Less than 35 years 35 to 45 years Above than 45
Therefore, the youngest employees need to be more aware in showing empathy and seniors need to be more conscious about their own emotions and forming a link between them.
Figure 4. Experience-wise mean comparison between five sub-scales Percentage of Mean
67 72 77 82 87
Self awareness Self regulation Self motivation Social awareness
Social skills
0 to 10 years 11 to 20 years Above than 20 years
Figure 4 shows the distinction between means of the five sub-scales of SEI, according to the years of experience of BRAC employees. Based on the years of employment in BRAC the staff were classified into three groups – 0-10 years, 11-20 years, and >20 years. A similarity was found in average self-awareness and regulation score with the previous graph (Fig. 3). Furthermore, in case of self-motivation the middle group showed less commitment on achieving both their personal as well as the organization’s goals. This group also obtained lesser score in sensing other people’s perspectives and showing it. The youngest group appeared to strive to meet professional standards, while they showed less inclination in understanding others’
emotions. However, they can manage to act socially in groups, building bonds,
leadership skills and conflict management just as well as the most senior group. The most senior group possessed a good level of SEI score, except in the awareness of self emotions compared to the other two groups.
OVERALL SEI SCORE
Table 15 depicts the summary of the overall SEI score. Altogether 59 items were used in this survey, and the highest possible score could be 295. The BRAC employees got 230.51 as mean score of overall SEI. From sex segregation it was established that male staff showed more SE sensitivity rather than their female colleagues.
Table 15. Summary of overall SEI score Year Male Female Level 9 and
10
Level 11 and 12
Level 13 and 14
All Mean±SD 231.66±21.32 226.25±23.99 228.14±21.29 228.51±23.06 231.19±23.77 230.51±22.03 Median 233.00 228.00 228.00 230.00 234.00 232.71 Mode 214.00 224.00 233.00 235.00 224.00 224.00 For mean and median p<0.5 between male and female staffs
Means are not significantly varied between different level staffs For median p<0.5 between different level staffs
The mean score of these two groups was found to differ significantly.
Additionally, the higher position holders showed more skill in this regard and their means did not significantly differ to each other. Furthermore, half of the respondents of this survey got 232 score or less. These middle values between groups were found to differ significantly to each other.
Association between SEI and others
Table 16 represents the association between SEI score and the basic information like age, years of experience, job level and sex. It was revealed that, apart from job level, other aspects (such as age, sex and work experience) had negative relationship with SEI score. This means that if one is increased, the other will decrease. Regarding the relationship with age and SEI a very weak (almost uncorrelated) and negative relationship was revealed. Similarly, length of service in BRAC and sex of the staff had weak and negative association with SEI score.
Table 16. Association between SEI score and basic information of staff
Indicators Correlation coefficient
Age and SEI score -0.009
Experience and SEI -0.037
Job level and SEI 0.086
Gender and SEI -0.092
However, the staff’s job level and SEI score has a rather weak, yet positive relationship. Thus, these findings allow us to conclude that parameters such as age, sex, years of employment at BRAC, and job level do not really influence SEI. Hence, individual keenness and willpower essentially come into play: every BRAC worker can enhance his or her SES if they want. Age, sex, job level and experience cannot be
Another relationship also measured between SEI with the component of SEI, JS with SEI and JS with the components with SEI (Table 17). The overall correlation coefficients are positive and statistically significant.
Table 17. Association between SEI score and other score
Indicators Correlation coefficient
Self-awareness and SEI 0.754* Self-regulation and SEI 0.768* Self motivation and SEI 0.756* Social awareness and SEI 0.698* Social skills and SEI 0.914*
JS and SEI 0.401*
JS and Self awareness 0.263* JS and Self regulation 0.347* JS and Self motivation 0.291* JS and Social awareness 0.404* JS and Social skills 0.326*
* Correlation is significant at the 0.01 level
The SEI score is most strongly related with social skills. Social awareness had a moderately good association with SEI but compared to other components of SEI it showed lowest association.
There was a fairly good positive correlation between JS and SEI, which was also highly significant. Apparently employees who are happy with their job are able to show more SES. Further, JS and SEI components (except social awareness) had significant though not too strong association between them. JS and social awareness skills had a fairly good correlation between them. It appears, therefore, that the more social and the self-aware employees are the ones who gain more satisfaction from their job. It is more likely, however, that there is a two-way relationship: maybe job satisfaction also leads people to become more social and form a constructive relationship with their colleagues.
SEI SCORE PREDICTOR
To know which factors can influence the SEI score a multiple regression analysis was done where job level, JS, length of service at BRAC, and age of the respondents were defined as predictors and the SEI score defined as the dependent one.
Table 18. Regression analysis model summary Model Summary
R R Square Adjusted R Square Std. Error of the Estimate
0.431 0.186 0.166 20.72968
Predictors: (Constant) Job level, Job satisfaction, Experience, Age
The regression analysis presents a slightly weak (R2 =0.186) but statistically significant (F=9.569, Sig.=0.00) prediction (Tables 18 and 19). The value of R2
indicates respondents’ age, experience, job level and job satisfaction can explain 18.6% of their SEI. Without any influence of any predictor, staff can get approximately 181 out of 295.
Table 19. Regression analysis ANOVA ANOVAb
Model Sum of Squares df Mean Square F Sig.
Regression 16447.915 4 4111.979 9.569 .000a
Residual 72192.895 168 429.720
1
Total 88640.809 172
a. Predictors: (Constant), Job level, Job satisfaction, Experience, Age b. Dependent Variable: SEI score
The value Variance Inflation Factor (VIF) indicates that the assumption no multi- collinearity was met (Table 20). This analysis reveals that the predictor set significantly predicts the outcomes. Among the set of predictors the age and experience of respondents seem to be weak predictors, whereas job level and its satisfaction are the stronger predictors. Job level, is by far the strongest predictor.
Other two independent variables experience and age (βexperience = -0.595, ns) and (βage = 0.171, ns) are relatively weak predictors. Yet, these values of β indicate that older respondents and those had less experience are somewhat more likely to hold that the level of SEI.
Table 20. Regression coefficients
Coefficientsa Unstandardized
Coefficients Standardized
Coefficients 95.0%
Confidence Interval for B
Collinearity Statistics Model
B Std. Error Beta
T Sig.
Lower Bound
Upper Bound
Tolera nce
VIF (Constant) 180.719 12.879 14.033 .000 155.294 206.143 Job
satisfaction 1.377 .228 .436 6.047 .000 .928 1.827 .932 1.073 Job level 1.609 2.160 .058 .745 .457 -2.655 5.873 .808 1.237 Experience -.595 .388 -.233 -1.535 .127 -1.360 .170 .210 4.759 Age .171 .384 .069 .445 .657 -.588 .930 .201 4.981 a. Dependent Variable: SEI score
Table 20 shows that VIF values for age and job experience are higher than 1.
That means that the regression may be biased. However, that was expected, since the most experienced workers are likely to be the older ones, and the older ones are more likely to have developed their SEI.
IS SEI SCORE CAN EXPLAIN JOB SATISFACTION?
To examine whether JS is influenced by SEI components, another multiple regression was done where the five SEI components were defined as predictors and the JS defined as the dependent variable.
Table 21. Regression analysis model summary Model Summary
Model R R Square Adjusted R Square Std. Error of the Estimate
1 .506a .256 .220 6.34847
Predictors: (Constant), Experience, Job level, Age, Self awareness, Self regulation, Self motivation, Social awareness, Social skills
This regression analysis reveals that the predictor set significantly predicts the outcome (F=7.068, Sig. =0.00) prediction (Tables 21 and 22), and that the SEI components explain 25% of JS (R2 = 0.256). That is, value of R2 explained 25.6% of variability of the JS scores by respondent’s age, experience, job level and SEI components.
Table 22. Regression analysis ANOVA ANOVAb
Model Sum of Squares Df Mean Square F Sig.
Regression 2278.812 8 284.851 7.068 .000a
Residual 6609.709 164 40.303
1
Total 8888.520 172
a. Predictors: (Constant), Experience, Job level, Age, Self awareness, Self regulation, Self motivation, Social awareness, Social skills
b. Dependent Variable: Job satisfaction
The value VIF indicates that the assumption no multi-collinearity is met. Age and job level appear to be the weakest predictors, whereas social awareness and self- regulation the strongest in the set. Social awareness is the most important determinant of job satisfaction.
Table 23. Regression coefficients
Coefficientsa Unstandardized
Coefficients
Standardized Coefficients
95.0%
Confidence Interval for B
Collinearity Statistics Model
B Std.
Error
Beta
t Sig.
Lower Bound
Upper Bound
Tolerance VIF (Constant) -2.099 6.192 -.339 .735 -14.325 10.127
Self-
awareness .090 .132 .062 .686 .494 -.170 .351 .562 1.779 Self-
regulation .201 .129 .146 1.560 .121 -.053 .456 .521 1.918 Self
motivation
.077 .217 .035 .356 .723 -.351 .505 .479 2.088 Social-
awareness .476 .169 .247 2.815 .005 .142 .810 .588 1.700 Social skills .038 .067 .057 .568 .571 -.094 .169 .446 2.240
Age -.035 .120 -.045 -.294 .769 -.272 .202 .193 5.171 Job level .098 .679 .011 .144 .886 -1.242 1.437 .768 1.302
1
Experience .227 .119 .280 1.898 .059 -.009 .462 .208 4.810 a. Dependent Variable: Job satisfaction
Therefore, it can be said that the ability to take into account other people’s feelings and perspectives, paying attention to colleagues’ emotional needs, the ability to form relationships with colleagues and show understanding towards them greatly determines job satisfaction. However, such statement should be treated cautiously. As pointed out earlier, it is likely that there is a two-way relationship between JS and SEI components. Forming constructive relationships with colleagues can definitely enhance job satisfaction. On the other hand though, job satisfaction itself can encourage people to interact with their colleagues in a more friendly and constructive manner: if someone is happy with his job, chances are that he or she would happily interact with colleagues and show understanding towards their needs. Nevertheless, the fact that the SEI set of components explain 25% of JS signifies that social and emotional skills are an important aspect in job satisfaction and, consequently, a more productive working environment.
DISCUSSION AND RECOMMENDATION
Social and emotional competence helps people understand, manage, and express different social and emotional aspects of life. This is required to manage various life tasks like learning, forming relationships, solving everyday problems, and adapting to the complex demands of growth and development. Inevitably, all the above apply to the context of work. In this study, a mixed picture was found after assessing the social and emotional competences of BRAC staff. Positive signs are that BRAC workers are able to understand their own emotion. They are working cooperatively and show care about their peers. They have a sense of self worth which helped them to effectively deal with their responsibilities and challenges.
Emotions can influence employee’s behaviour and actions in office. Hence, the negative emotions affect their beliefs and performances. This study found that staff know their emotion and are able to link between them, but they were found less able to control it. Hence, stress, tension and worry affect employees and it is a potential barrier in providing quality performance.
Furthermore, anger ruins staff’s own image and interpersonal relationship with colleagues. So, regulating emotions in various situations is a must for them. BRAC staff were found less confident in themselves and their ability. They were less aware about their strengths/weaknesses, fear to face new challenge, less able to influence others and express own emotions. These indicate lack of self-assurance. They liked to stay in comfort zone and avoided disagreement. Some of them were found less open for debate and had a tendency to accept all decisions whether right or wrong. They are less motivated in terms of dealing with difficult tasks.
Regarding group work, they were found less sharing and open, and that creates tension among colleagues at times. Relationship with supervisor was frequently hampered due to poor communication and personal bias. The employees realized that the above-mentioned negative emotions might create problems; however, sometimes they did not know how to deal with them. They wanted to know the techniques to deal with stress. Nowadays, many things influence our lives such as our peer, social context, culture and competition, work load and stress, religious views, the lure of risk, complexities of family relationships and so on. In addition, in a workplace people come from different ethnic, economic, social, and geographic regions. They have different