Their ability to produce critical amino acids increases their potential as protein-rich diets (Guil-Guerrero et al., 2004). Scenedesmus quadricauda has high protein content based on proximate analysis of dried microalgae biomass (Nayak et al., 2019). Bold basal medium was shown to be the best for biodiesel production as it has the highest amount of lipids (Sharma et al., 2015).
Due to the lack of iron, the concentration of cellular chlorophyll decreases (Greene et al., 1992). According to Liu et al. 2008), a higher concentration of iron in Chlorella vulgaris cultivation was an important element in increasing lipid content. Microalgae can use a range of nitrogen sources (such as ammonia, nitrite, nitrate and urea), while different nitrogen sources can cause the biochemical composition of microalgae (Angles et al., 2017).
Pigments
A fed-batch cultivation method can help to increase the productivity of biomass. 2013) found that daily addition of a small amount of NaNO3 to the medium promoted algae growth and fat production. In addition, lutein, produced by Scenedesmus obliquus, can be used as a by-product of lipid production, potentially reducing lipid production costs even further. Scenedesmus obliquus, Chlorella vulgaris and Chlorella minutissima produced more biomass and lipids when 0.01 g L-1 nitrate was added to the medium every three days, according to Sonkar and Mallick (2017).
Lower nitrogen concentrations were observed to have a significant impact on microalgal cell growth and photosynthetic activity, as well as affecting cell shape.
Biochemical Properties
Microalgae Collection and Culture
Experimental Design
- Culture Media Preparation
- Determination of Cell Density
- Determination of Optical Density
- Determination of Biomass
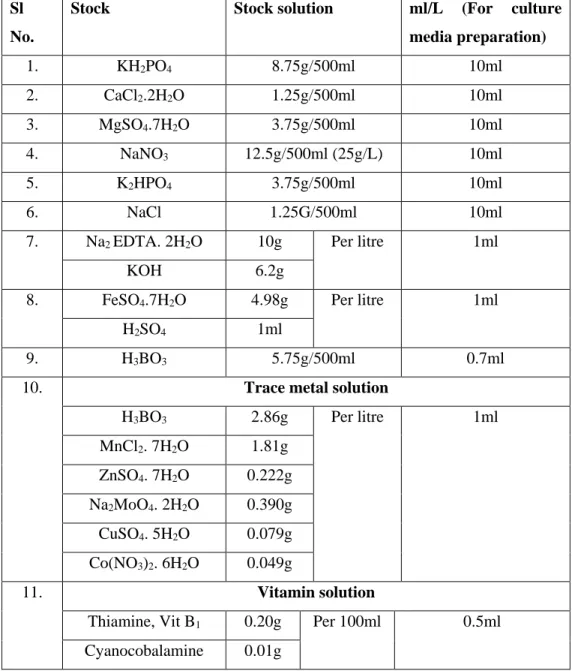
Culture media were prepared along with sterilized distilled water and modified Bold Basal Media (Stein, 1980) according to the following labeled ingredients. Growth curve data were determined prior to the start of mass culture to determine pigment and proximate composition data. The hemacytometer and its coverslip (Brightline enhanced Neubauer hemacytometer, 0.0025 mm2, 0.1 mm deep chambers, Assistent, Germany) were cleaned using Milli-Q water (Millipore Corporation) prior to filling the chambers with culture samples.
Cells were counted for both chambers of the hemacytometer under an electronic microscope at 40x magnification; Lugol's iodine was added to culture aliquots for fixation and staining to facilitate counting. Vacuum filtration was used to filter 1.0 ml of microalgae sample from each culture through pre-weighed filter paper. The dry biomass concentration was then estimated by dividing the difference between the pre- and post-filtration weights of the dried filter paper by the filtered volume.
Specific Growth Rate and Cell Doubling Time Estimation
Volumetric Productivity
Lipid productivity (LP) is the amount of lipids produced by microalgae in one day during stationary phase. Lipid productivity was calculated using lipid content (Folch et al., 1957; Bligh and Dyer, 1959) and volumetric productivity in the stationary phase. Where, VP = Volumetric productivity of the culture, % lipid = Percentage of lipid content on a dry weight basis.
Determination of Pigments
Determination of Chlorophyll a, b
- Microalgae Extraction
- Determination of Chlorophyll a and b (Dichromatic method)
Where Ca and Cb = concentrations of chlorophyll a and b, mg/L, respectively, and OD 664, OD 647, and OD 630 = turbidity-corrected optical densities (with a light path of 1 cm) at the respective wavelengths. In the stationary phase of each culture, 1.0 ml microalgae sample was centrifuged at 1000 x g for 5 minutes to obtain pellets. The pellet containing the solvent was then shaken vigorously and centrifuged again at 1000 x g for 5 minutes.
The hexane layer was thus separated and its absorbance was determined spectrophotometrically at the wavelength of 450 nm. The amount of extracted carotenoids from the samples in micrograms was determined by multiplying the absorbance (A450) by 25.2 (Khatoon et al., 2020).
Determination of Phycobiliproteins
- Phycobiliproteins Extraction
- Spectrophotometric Estimation of Phycobiliproteins
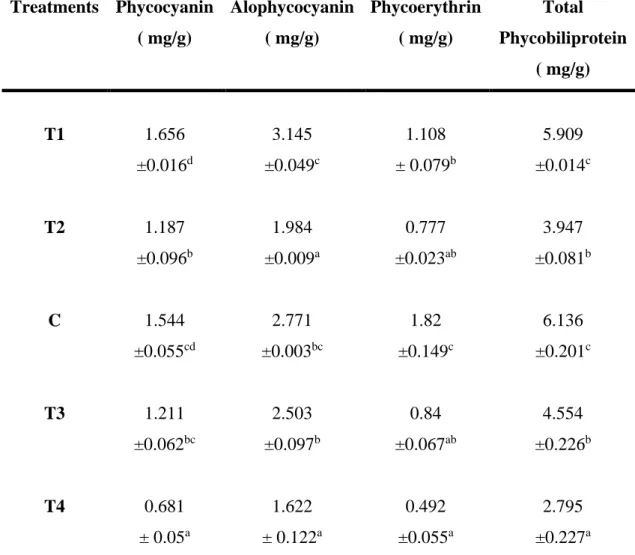
The sum of the content of phycocyanin, phycoerythrin and allophycocyanin in dried microalgae biomass was used to calculate total phycobiliproteins (mg/g).
Determination of Proximate Composition
Protein Determination
Lipid Determination
The tubes were then centrifuged again using the method previously described and the supernatants were transferred to the previous supernatant tubes. Finally, the initial weight was subtracted from the final weight to get the lipid weight in the samples. A 5 mg oven-dried biomass sample was used to make a 25 ml well-mixed (tissue homogenizer) solution with distilled water for each sample.
After that, 1.0 ml of 25 ml solution was taken for each sample, followed by 1 ml of 5% phenol solution and 5.0 ml of sulfuric acid. When the mixture becomes cold, the absorbance of the solution was taken at 488 nm wavelength using NanoDrop spectrophotometer (NanoPlus, WAVE ANALYTICS D-82362 Weilheim, Germany) to estimate carbohydrates. For standard series, the same procedures as for carbohydrate analysis were used; a standard graph was constructed based on the standard absorbance values obtained and the carbohydrate content of each sample was calculated accordingly.
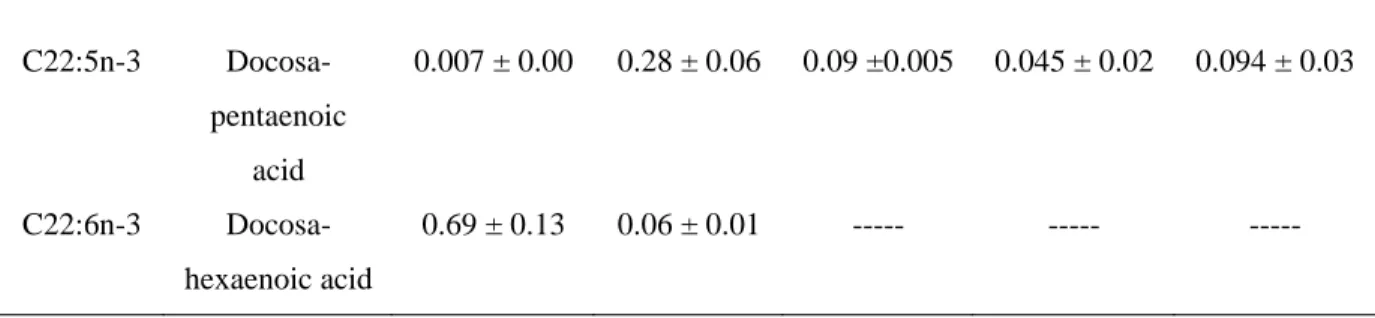
Fatty Acid Analysis
The upper layer of methanol and chloroform was discarded, while the lower layer was transferred to the previously prepared aluminum dish. After the tubes had cooled to room temperature, 1.0 mL of isooctane and 5.0 mL of saturated NaCl were mixed by shaking well. The fatty acid methyl esters (FAMEs) containing the upper organic layer were transferred to a new tube and 1.0 ml sample was taken in the vial for analysis of fatty acid methyl esters by Gas Chromatography Mass Spectrophotometry (GC- 2020plus, SHIMADZU, Japan).
Statistical Analysis
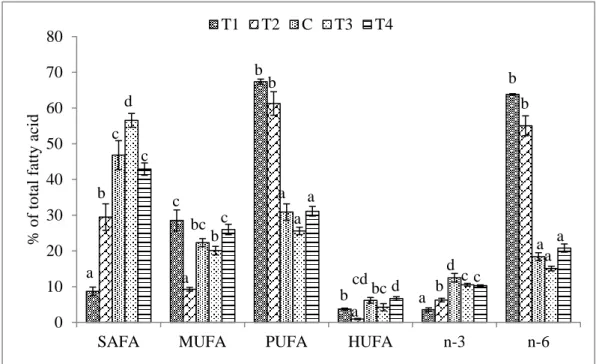
In the case of carotenoid and total phycobiliprotein content, significantly (p<0.05) higher values of 6.43 mg/L and 6.14 mg/g respectively were produced in control (25 g/L NaNO3) compared to other concentrations of NaNO3. Significant (p<0.05) highest value of total saturated fatty acids was found (56.51% of total fatty acids) in 31 g/L concentration of NaNO3.
Growth Curve Analysis
Pigment Analysis
Chlorophyll a, b
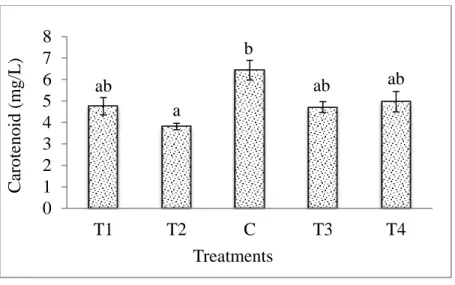
Carotenoid content also varied significantly (p<0.05) where the highest amount of carotenoid (6.43 mg/L) was produced under the control treatment followed by 4.96 mg/L carotenoid produced under T4 (Figure 5). The lowest carotenoid content was obtained 3.81 mg/L under T2, other treatments T1 and T3 produced 4.75 and 4.71 mg/L carotenoid.
Phycobiliprotiens
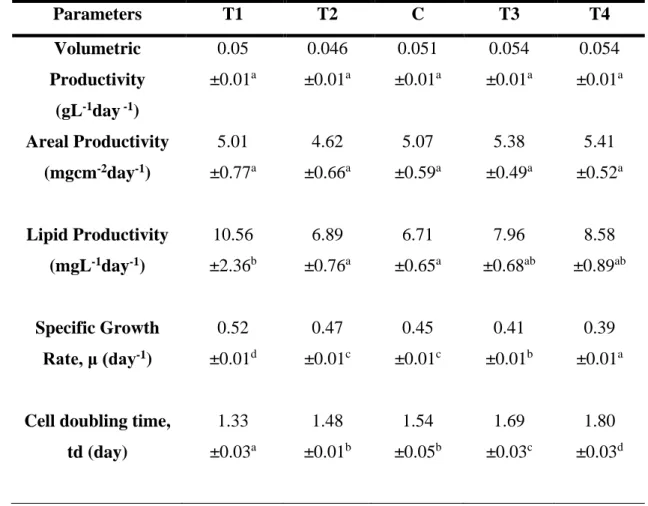
Although total phycobiliprotin is higher in C than T1 and other treatments, only phycoerythrin is higher in C than T1 (1.108 mg/g) and on the other hand phycocyanin (1.54 mg/g) and allophycocyanin (2.77 mg/ g) lower in C than T1. Volumetric and area productivity among the treatments are not significantly different (p>0.05), but the lipid productivity, SGR and cell doubling time are significantly different among the treatments (p<0.05). T3 and T4 resulted in similar and highest volumetric productivity, where the lowest (0.046 gL-1 day -1) volumetric productivity was obtained in T2.
Cell doubling time is higher in T4 (1.8 days) than other treatments; apart from this, there was no significant difference between C and T2 (P>0.05). There was medium negative correlation (R2= 0.12) between SGR and volumetric and area productivity (p> 0.05).
Proximate Composition Analysis
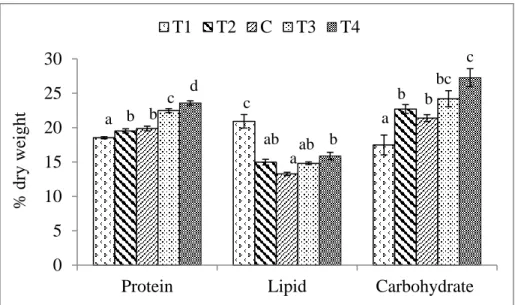
In the case of lipid production, a highly significant difference remains between C and T1, just as there is also a significant difference between C and T4 (p<0.05). There is also a significant difference between T1 and T4 (p<0.05), but no significant difference was found between C and T2 and T3 (p>0.05). The amount of carbohydrate was produced 21.38% dry weight in C; whereas 27.26 and 24.37% dry weight carbohydrate was produced in T4 and T3 where nitrogen concentration was higher in culture media.
Fatty Acid Analysis
The lowest percentage of PUFA and n-6 fatty acids was found under T3, but T4 was relatively higher than C. SAFA- saturated fatty acids, MUFA- monounsaturated fatty acids, PUFA- polyunsaturated fatty acids, HUFA- highly unsaturated fatty acids, n3 - Omega 3 fatty acids, n6- Omega 6 fatty acids.}.
Microalgal Cell Growth
Nitrogen-limited conditions of microalgae culture have led to a significant decrease in cell density, biomass productivity and chlorophyll synthesis (Dean et al., 2010; Nigam et al., 2011).
Pigments
Chlorophyll a, b
Carotenoid
Phycobiliproteins
Like the present result, Kendırlıoglu et al. 2013) stated that the cell growth rate was greater in cultures subjected to the lowest nitrogen concentration.
Proximate Composition
A previous study also found an equivalent result to this study, namely lower carbohydrate utilization in Tetradesmus obliquus was obtained after 14 days under nitrogen stress conditions compared to the control. The nitrogen stress condition resulted in the accumulation of carbohydrates at an early stage, but it started to decrease on day 4, when carbon shifted to lipid production (Nadzir et al. reported that after 2 days of nitrogen stress, the photosynthetically assimilated carbon flux of Pseudochlorococcum sp.
Fatty Acid Composition
Therefore, it can be concluded that this result will enrich the potential of Scenedesmus sp. The aim of this study was to observe the effect of different nitrogen concentrations on cell growth, photosynthetic pigment chlorophyll and phycobilliprotein, carotenoid, proximate composition and fatty acid composition of Scenedesmus sp. Effect of temperature and nitrogen concentration on growth and lipid content of Nannochloropsis oculata and Chlorella vulgaris for biodiesel production.
Antiproliferative and antioxidant properties of lipid extracts of the microalgae Scenedesmus obliquus grown under stressful conditions. Optimization of biomass and fatty acid productivity of Scenedesmus obliquus as a promising microalgae for biodiesel production. Lipid accumulation and response of Chlorella pyrenoidosa oil biosynthesis genes under three nutritional stressors.
Effects of nitrogen source and growth phase on proximate biochemical composition, lipid classes and fatty acid profile of the marine microalga Isochrysis galbana. Growth and proximate composition of Scenedesmus obliquus and Selenastrum bibraianum grown in different media and conditions. Effects of nitrogen availability on the antioxidant activity and carotenoid content of the microalgae Nephroselmis sp.
Use of Scenedesmus obliquus protein as a substitute for commercially available fishmeal under an algal refinery approach. Lipid accumulation and antioxidant activity in the eukaryotic acidophilic microalga Coccomyxa sp. onubensis strain) under nutrient starvation. Effects of light and nitrogen starvation on the carotenoid content and composition of the green microalga Parietochloris incisa.
Effect of nitrogen concentration on the growth rate and biochemical composition of the microalga Isochrysis galbana. Enhanced fatty acid accumulation in Isochrysis galbana by inhibition of the mitochondrial alternative oxidase pathway under nitrogen deficiency. Page | 74 Appendix S: One-way analysis of variance Investigation of Phycobiliprotein, Phycocyanin, Allophycocyanin and Phycoerythrin content of Scenedesmus sp.
Page | 75 Appendix T: One-way analysis of variance relating volumetric, surface and lipid productivity, specific growth rate and cell doubling time of Scenedesmus sp. Appendix U: One-way analysis of variance relating protein, lipid and carbohydrate content of Scenedesmus sp.