Mosfikur Rahman, Akash Ahmed and Mahfuja Ferdousi Mahin in the Department of Computer Science and Engineering, Daffodil International University, has been accepted as satisfactory in partial fulfillment of the requirements for the degree of B.Sc. Department of Computer Science and Engineering Faculty of Information Science and Technology Daffodil International University. We declare that this project was done by us under the supervision of Nazmun Nessa Moon, Associate Professor of the Department of Computer Science and Engineering Daffodil International University.
We are truly grateful and express our sincere gratitude to Nazmun Nessa Moon, Associate Professor, Department of Computer Science and Engineering, Daffodil International University, Dhaka. We would like to express our sincere gratitude to Nazmun Nessa Moon, Amit Chakraborty and Head of CSE Department for his kind help in completing our project and also other faculty members and staff of CSE Department of Daffodil International University.
- Introduction
- Motivation
- Rationale of the Study
- Research Questions
- Expected Outcome
- Report Layout
If Chronic Kidney Disease can be diagnosed and predicted early, it can be cured very quickly with proper treatment. Therefore, a model was proposed and trained by a relevant data set that can predict chronic kidney disease at any stage. A web interface has been developed where patients can provide data and predict chronic kidney disease at home.
Using machine learning approach on medical dataset, Chronic Kidney Disease can be easily predicted. While this research is being conducted, a team can warn communities and river regions about Chronic Kidney Disease while it is still in progress.
- Introduction
- Related Works
- Comparative Analysis
- Scope of the Problem
- Challenges
An evaluation of the correctness of Support Vector Machine (SVM), Convolution Neural Networks (CNN) and Gradient Boosting algorithms validates the generated optimal feature subset from TLBO algorithms and feature subset produced by ITLBO algorithm. The basic logistic regression model was compared with five additional machine learning models: a single hidden layer neural network, a support vector machine, a random forest, a gradient boosting machine, and k-nearest neighbor. On the other hand, machine learning models like Support Vector Machines, Neighbor Nearest Home, Deep Neural Networks, and Naive Mouths also provide predictive analytics.
An algorithm model was constructed using CNN to increase the accuracy of the classification system by reducing the feature dimension. The Medical Things Platform (IoMT) experimental internet process is driving breakthroughs in machine training using predictive analytics to provide a promising framework in which smart solutions can be recognized to demonstrate their predictive potential beyond the field of retinal diseases [13] . An online dataset was collected from UCI Machine Learning Repository and real-time datasets from Khulna City Medical College were used for this study.
The data in this paper was collected from the University of California Irvine (UCI) machine learning repository, which contained a lot of missing values. In this study by the authors, the paper includes UCI data and additional data that were collected from different hospitals in Bangladesh. The primary objective is to determine which of the two algorithms is better at predicting chronic kidney disease (CKD).
Of the 11 machine learning algorithms studied, the additive tree classifier and the random forest classifier are demonstrated to produce the highest accuracy (100.00%). One challenge is to eliminate all null values from the data set that has been collected. For the team, one of the most challenging tasks was to create an intuitive user interface for this system, which enables anyone to input data and predict CKD at any time.
- Introduction
- Research Subject
- Machine Learning Techniques
- Supervised Learning
- Classification Techniques
- Learning
- Classification
- Algorithmic Details
- Logistic Regression
- Support Vector Machine
- K-Nearest Neighbors
- Gaussian Naïve Bayes
- Perceptron
- Linear Support Vector Classifier
- Stochastic Gradient Descent
- Decision Tree
- Random Forest
- Adaptive Boosting (AdaBoost)
- eXtreme Gradient Boosting (XGBoost)
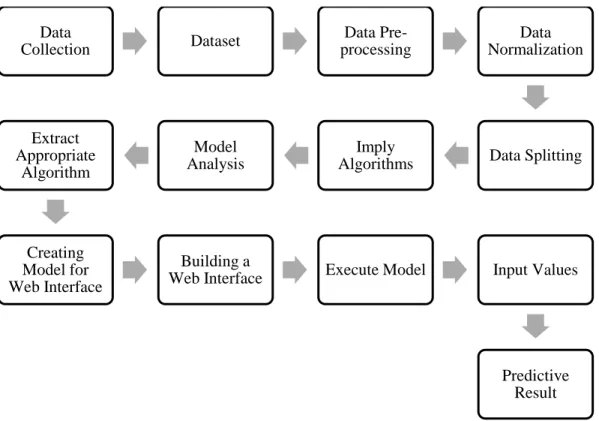
- Proposed System
- Data Collection
- Dataset
- Data Pre-processing
- Data Normalization
- Data Splitting
- Imply Algorithms
- Model Analysis
- Extract Appropriate Algorithm
- Creating Model for Web Interface
- Building a Web Interface
- Execute Model
- Input Values
- Predictive Result
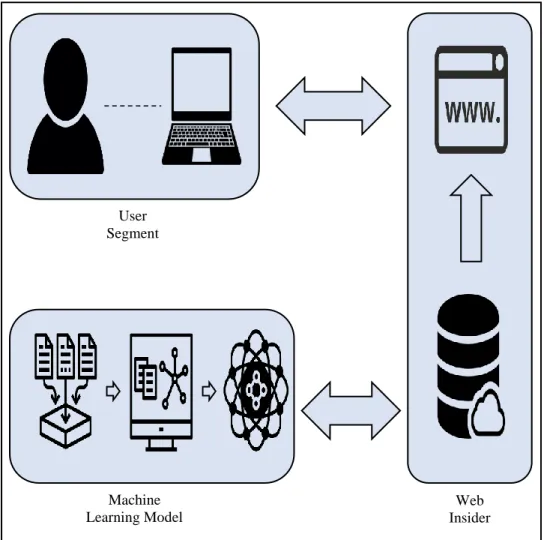
- System Architecture
- User Segment
- Web Insider
- Machine Learning Model
This section makes use of the test data to evaluate whether a model's predictions are true or not. Despite being used in a variety of activities, the majority of the time it is used for categorization. Essentially, it consists of a single node or neuron that receives input from an array of data and predicts the classification of the data into categories.
The binary value of the input x is mapped to the binary value of the output f(x). After the creation of the hyperplane, it may be required to provide specific features in the classifier to get the "predicted" classification result. To do this, the Decision Tree must be used to build a training model that uses basic decision rules to predict the class or value of the input variables based on the training data set.
And the impact of such a classifying α is measured by this total inaccuracy in the classification of the data samples. In the equation (ix), the α is used here to change the weight of the dataset samples so that a new dataset is created. Using the training portion of the dataset, the specific model can be trained to predict something, and the testing portion can be used to see how accurately the data is predicted.
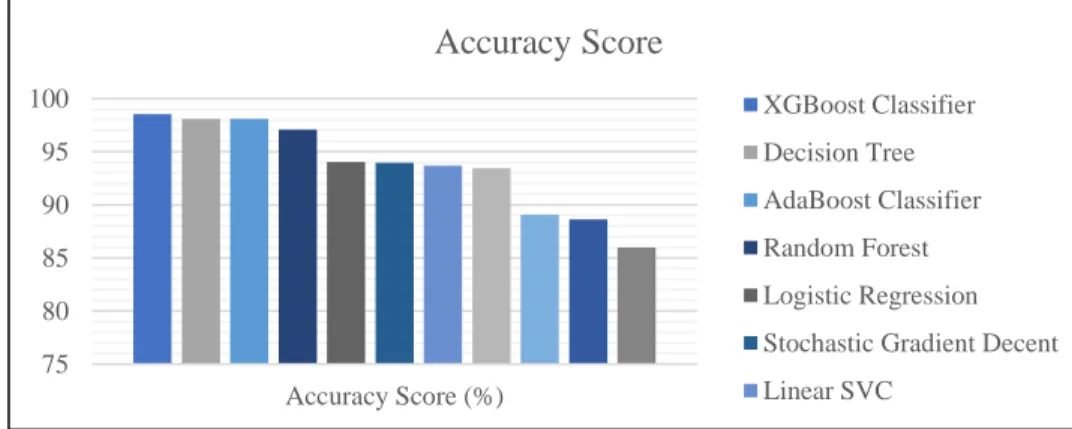
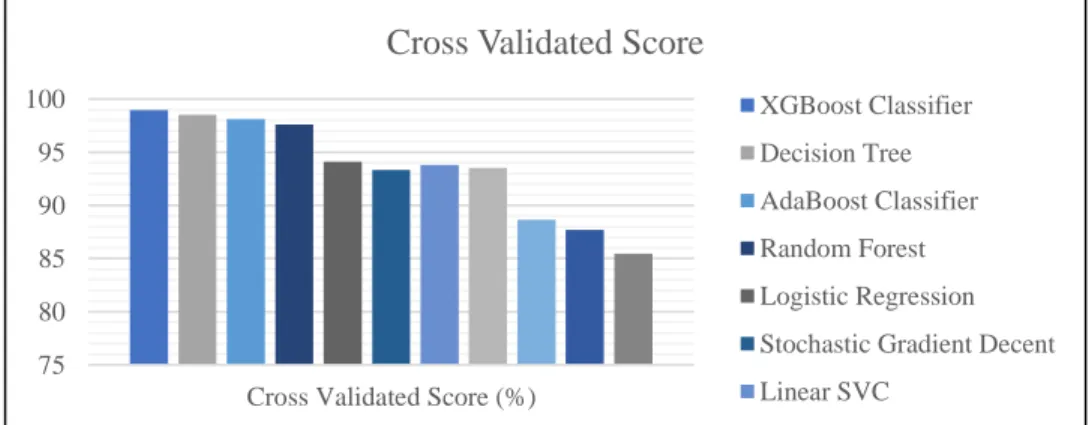
The names of the 11 algorithms are: Support Vector Machine (SVM), Stochastic Gradient Descent (SGD), Decision Tree, Random forests, Adaptive Boosting (AdaBoost), eXtreme Gradient Boosting (XGBoost). The Accuracy Score, Jaccard Score, Cross Validated Score, and AUC Score provide a percentage of the accuracy of the predicted data. Misclassification, Mean Absolute Error and Mean Squared Error provide an error rate of the algorithms.
To use the dataset properly, an appropriate algorithm must first be developed. To build a web interface, the authors took the help of the "jar" module in python.
- Introduction
- Experimental Results
- Data Acquisition
- Data Utilization
- Feature Importance
- Result & Discussion
- Confusion Matrix
- Classification Report
- Result Analysis
- Accuracy
- Jaccard Score
- Cross Validated Score
- AUC Score
- ROC Curve
- Standard Deviation
- Misclassification & Error
- Web Implementation
- Web Interface
- Web Output Analysis
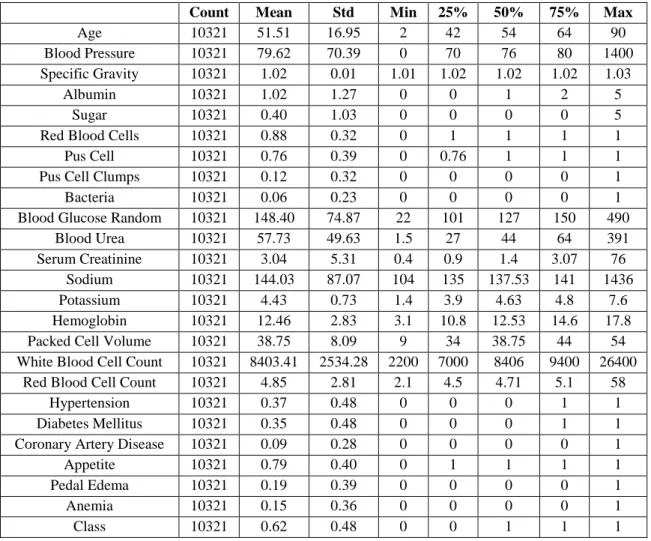
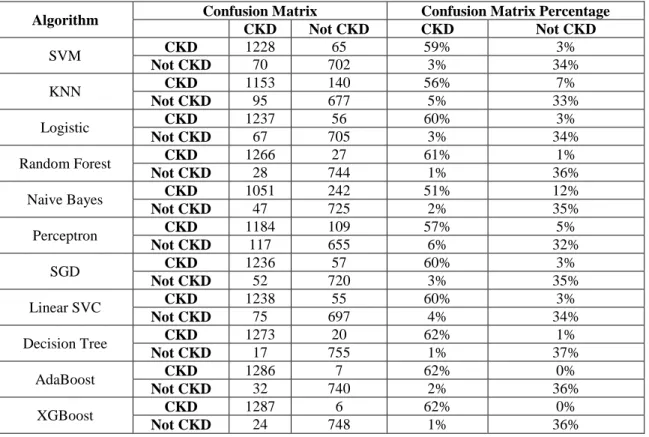
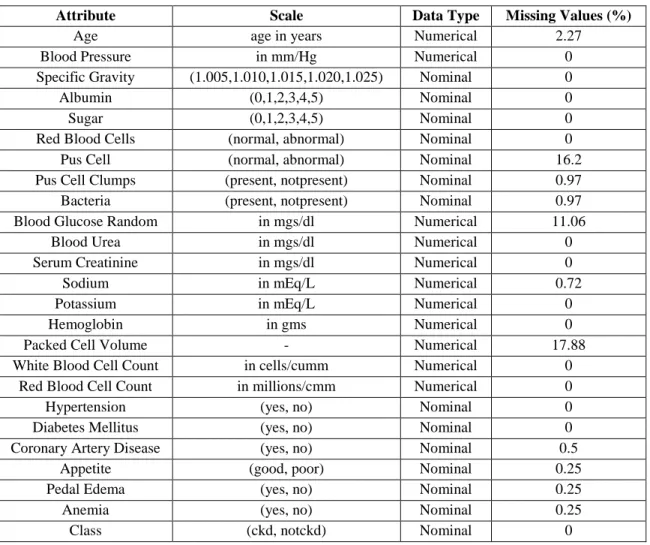
However, it is important to note that although the three variables sg, al, and su were originally described as categorical types, their values were determined by their relationship to numbers. Data description for the 25 attributes were then extracted for a better understanding of the data set. The matrix evaluates the accuracy of the machine learning model by comparing the actual target values with the predicted ones.
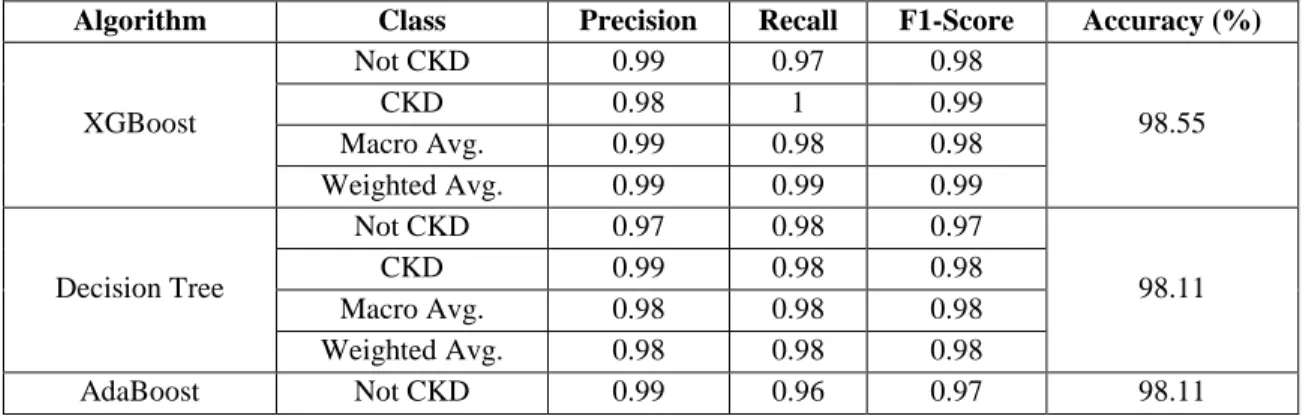
In this way, it is visible how effectively the algorithmic model works and what errors it makes. Furthermore, for multi-class classification it is necessary to go through this average value with micro-average or macro-average. Before we discuss this, it is important to know about four building blocks that are used in the calculation of various evaluation measures.
It was these negatively labeled tuples that were misclassified as positive by the classifier of interest today. Naive Bayes and AdaBoost followed with 2%, and logistic regression produced 3% false positive (FP) values. It is a measure of completeness (how many positive tulips are identified as such) used in machine learning.
It is conceivable that this number has four different values, with the largest potential value being one. As seen in Figure 4.4 and Table 4.7, models that make 100 percent incorrect predictions have an accuracy of zero, while models that make 100 percent accurate predictions have an accuracy of one. After misclassification it means absolute error and the mean square error becomes part of the accuracy of a machine learning model.
The Table 4.9 shows the misclassification, mean absolute error and mean squared error in the algorithms. It is now time to show this model implementation on the web interface, as described in the System Architecture section of the previous chapter.
- Introduction
- Impact on Society
- Ethical Aspects
- Sustainability
People will be able to predict chronic kidney disease at home and then consult their doctor about their status. And if this type of device can be invented that can test blood and urine and is portable, then people will be able to more accurately test for KLB at home. This research is very sustainable because of its unique approach, as you can check your CKD status on the website.
In its current state, the website only uses machine learning techniques to predict kidney disease. But in the future there are many scopes with deep leaning, Artificial Intelligence and Internet of Things that can give this project more precise results. Therefore, in case of sustainability in the future, many works can be done with the help of this project.
But using this machine learning project and online approach, it is possible to predict other diseases of kidney and other organs as well. Also, using a web interface that uploads a skin image, the skin disease can be detected in the future.
- Introduction
- Implication for Further Study
- Recommendations
- Conclusion
If the values change and vary in some cases, this may indicate chronic kidney disease at an early stage. Assuming that chronic kidney disease (CKD) is detected and treated early enough, it has the potential to be treated successfully and efficiently, perhaps curing the patient within a short period of time. There are several laboratory tests that people must undergo to determine whether or not they have chronic kidney disease (CKD).
In practice, these exams may take a significant amount of time. According to the researchers who conducted this study, a model trained on a relevant dataset can predict the development of chronic kidney disease at any stage. To find the best suitable model for the dataset, eleven machine learning algorithms are trained on the dataset and evaluated based on their accuracy, Jaccard score, Cross Validated score and AUC score.
It will be made accessible to any kidney disease hospital after a website for this project is completed. Detection and diagnosis of chronic kidney disease using deep learning-based heterogeneous modified artificial neural network. Ensemble feature ranking for cost-based non-overlapping groups: a case study of chronic kidney disease diagnosis in developing countries.
Prediction of chronic kidney disease using Adaptive Hybridized Deep Convolutional Neural Network on the Internet of Medical Things Platform. Prognostic significance of kidney, heart and interstitial lung diseases (KHI triad) in PH: a machine learning study. A Machine Learning Model for Predicting Chronic Kidney Disease-Based Internet of Things and Cloud Computing in Smart Cities.