Customer Churn Prediction for Telecommunication Operator By
Baiyezid Sarkar ID: 182-15-2161 Rashadul Islam ID: 182-15-2192
&
Md. Sujon Hossain ID: 182-15-2196
Here This Report presented in partial Fulfillment of the Requirement for the Degree of Bachelor of Science in Computer and Engineering.
Supervised By Md. Sabab Zulfiker
Lecturer Department of CSE
Daffodil International University Co-Supervised By
Shahana shultana Lecturer Department of CSE
Daffodil International University
Daffodil International University
Dhaka BangladeshJanuary 2021
©Daffodil International University i
APPROVAL
The title of this project is “CUSTOMER CHURN PREDICTION FOR TELE COMMUNICATION OPERATOR”, submitted byBaiyezid Sarkar, Rashadul Islam and Md. Sujon Hossain at Daffodil International University's to the Department of Computer Science and Engineering work’s been acknowledged satisfactory for partial fulfillment of the requirements for the B.Sc. degree It has been licensed for publication in Computer Science and Engineering, and its style and content have been approved. The event take place on the March 15, 2021.
EXAMINERS' BOARD
Professor Dr. Touhid Bhuiyan Chairman Professor and Director
Department of Computer Science and Engineering Faculty of Science and Information Technology Daffodil International University
Dr. S. M. Aminul Haque Internal Examiner Associate Professor and Director
Department of Computer Science and Engineering Faculty of Science and Information Technology Daffodil International University
Ohidujjaman Internal Examiner Senior Lecturer
Department of Computer Science and Engineering Faculty of Science and Information Technology Daffodil International University
Dr.Mohammad Shorif Uddin External Examiner Professor
Department of Computer Science and Engineering Jahangirnagar University
©Daffodil International University II
ANNOUNCEMENT
We hereby announce that we completed this project under the guidance of Md. Sabab Zulfiker, Lecturer, Daffodil International University's Department of CSE. We also want to make it clear that no part of this initiative, or any part of it, has been applied for a degree or diploma to someone else.
Supervised by:
Md. Sabab Zulfiker Lecturer
Department of Computer Science and Engineering Faculty of Science and Engineering
Daffodil International University Co Supervised by:
Shahana Shultana Lecturer
Department of Computer Science and Engineering Faculty of Science and Engineering
Daffodil International University Submitted by:
Baiyezid Sarkar Rasadul Islam
ID: 182-15-2161 ID: 182-15-2192
Department of CSE Department of CSE
Daffodil International University Daffodil International University
Md. Sujon Hossain ID: 182-15-2196 Department of CSE
Daffodil International University
©Daffodil International University
III
ACKNOWLEDGEMENT
First and foremost, we express our heartfelt gratitude to Almighty Allah for His divine blessings, which have enabled us to successfully complete the final year project/internship pre-defense.
We are extremely grateful and wish to express our deep gratitude to Md. Sabab Zulfiker is a lecturer at Daffodil International University's Department of CSE in Dhaka. Our Supervisor's Extensive knowledge and keen interest in the field of "Customer Churn Prediction For Telecommunication Operator" qualified him to complete this project. His endless patience, scholarly guidance, continual encouragement, constant and energetic supervision, constructive criticism, valuable advice, reading many inferior drafts and correcting them at all stages have made it possible to complete this project.
We would like to express our heartfelt gratitude to Professor Dr. Touhid Bhuiyan, Head, Department of CSE as well as other faculty members and staff from Daffodil International University's CSE department, for their assistance in completing our project.
We would like to express our gratitude to all of our Daffodil International University classmates who participated in this discussion as part of their course work.
Finally, we must appreciate and accept our parents' unwavering love and patience.
©Daffodil International University IV
ABSTRACT
Client turnover is a significant issue and one of the most pressing issues for large businesses. Companies are working to develop methods to predict potential customer churn because it has such a direct impact on their revenues, especially in the telecom industry. As a result, identifying factors that contribute to consumer churn is critical in order to take the appropriate steps to minimize churn. Our work's key contribution is the creation of a Churn Prediction model that helps Telecom operators predict which customers are more likely to churn. The model created in this paper employs machine learning techniques on a big data framework to create a novel approach to feature engineering and selection. The Area under ROC Curve standard measure is used to assess the model's efficiency, and the ROC curve value obtained is 98 percent. The Decision Tree, Random Forest, Bagging and AdaBoosting algorithms were all used in the model.
©Daffodil International University V
CONTENTS
CONTENTS Page No
EXAMINERS' BOARD--- ii
ANNOUNCEMENT--- iii
ACKNOWLEDGEMENT--- iv
Abstract
--- vChapter 1->> INTRODUCTION
1.1 How Customer Churn Prediction works--- 21.1.1 Types of Churn Prediction --- 2
1.1.2 Causes of Churn Prediction --- 3
1.2 Motivation of the Research --- 3
1.3 Research questions --- 3
1.4 Research objectives --- 3
1.5 Research scope --- 3
Chapter 2 ->> Literature Review --- 4,5 Chapter 3 ->> Research Methodology --- 6
3.1 Introduction --- 6 3.2 Data description --- 6,7
©Daffodil International University VI
3.3 Algorithm description --- 7
3.3.1 Adaboost --- 7
3.3.2 Decision Tree --- 7
3.3.4 Bagging --- 8
3.3.5 Random forest --- 8
3.4 Implementation process --- 9
3.4.1 Data Input --- 10
3.4.2 Data Handling --- 10
3.4.3 Split Data --- 10
3.4.4 SMOTE --- 10
3.4.5 Classifier Result --- 10
Chapter 4 ->> Results And Discussion --- 11-19 Chapter 5 ->> Conclusions And Recommendation
--- 205.1
Conclusion
---20REFERENCES ---21
PLAGIARISM REPORT ---22
©Daffodil International University VII
Chapter 1 Introduction
Customer/ Client’s is one of the most widely used Big Data applications in operators, businesses, and other industries. It is the process of identifying customers who are likely to cancel a service subscription. This research aids SaaS companies in determining the root cause of churn and implementing successful churn management strategies. Gain sight recognizes the negative impact that a high churn rate can have on a company's bottom line.
This category includes telecommunications companies, SaaS companies, and any other company that provides a service for a monthly fee. Divide the number of customers lost over a given time span by the number of customers added, then multiply by 100 percent to get a churn rate. For instance, if you added 120 customers last month, your monthly churn rate would be 2.5%. The term "customer churn study" refers to the pace at which a company's customers leave.
A churn model depicting how churn affects the company of the business owner. Churn calculations are based on information gathered previously the number of customers who left your service during a given time period. This data is used by a predictive churn model to estimate future churn rates. The data for the first 12 months were aggregated, with the exception of attribute turnover. Customers' situations at the end of the year are represented by the marks on the churn.
Since machine learning algorithms are based on predictions, we use them for Churn prediction.
Various machine learning and data mining techniques can be used to uncover various types of data, which can then be used to forecast assignment status. The success of this paper will help in the quest for new ways to forecast customer churn and the selection of the best method for prediction. The main aim of this paper is to use machine learning algorithms to forecast Churn, mitigate risk, and balance the consequences of various machine learning algorithms to see which one performs best.
In service industries where services are highly competitive, customer turnover is a major concern. In the other hand Predicting the customers are likely to leave the company, on the other hand, would show potential. If achieved early on, it can bea significant additional revenue source. Many studies have shown that machine learning technology is extremely adept at foreseeing this scenario. Learning from previous data is used to apply this methodology.
Machine learning algorithms are a groundbreaking development in the area of Artificial Intelligence. Technology will change our lives with the help of machine learning techniques.
Algorithms for machine learning are used in a variety of fields and industries. Sampling is used in a number of applications, including medical diagnosis, image processing, marketing, prediction, weather forecasting, socioeconomic behavior analysis, classification, learning relationship regression, and a variety of others. Since machine learning algorithms are based on predictions, we use them for Churn prediction. Various machine learning and data mining techniques can be used to uncover various types of data, which can then be used to forecast
assignment status. The success of this paper will help in the quest for various approaches to predicting Churn and the selection of the best approach.
©Daffodil International University 1
This paper's main aim is to predict consumer behaviour. Reduce churn, reduce risk, and balance the consequences of churn using machine learning algorithms. To decide which machine learning algorithm works the best, a variety of algorithms are used.
1.1.Customer Churn Prediction Work
A churn rate can be calculated by dividing the number of customers lost by the total number of customers. Multiply the number of new customers gained over a given time span by a factor of a hundred. Consider the following scenario: you have 120 clients. The monthly churn rate is 2.5 percent if you lost three customers last month.
Figure: Machine Learning of Customer churn
“Customers of subscription-driven telecommunication companies choose a product or service for a fixed period of time, which may be as short as a month,” says Alex Bekker, head of ScienceSoft's data analytics department. As a result, a customer's eyes are kept open for more appealing or beneficial deals. Customers also have the option to reconsider and decide not to stick with the business when their current commitment expires. Naturally, some normal turnover is unavoidable, and the amount varies by industry. A higher churn rate, on the other hand, indicates that a company is doing something wrong.
1.1.1 Churn Prediction in Three Easy Steps
Collect historical customer information and save it to a CSV register.
Upload the data to a prediction provider, which will generate a "predictive model" for you automatically.
Apply the model to each current customer to see if they're on the verge of leaving.
©Daffodil International University 2
1.1.2 Causes of Customer Churn Prediction:
Use of Customer Churn Prediction
As previously mentioned, churn rate is one of the most important performance metrics for call failure and call history with churned customers. Model for predicting customer churn – [TJ Gerpott, W Rams, A Schindler] Existing Customers, Customer Satisfaction, and Customer Loyalty Model that predicts Customers on the verge of leaving Recognizing patterns Customers who are satisfied In the German mobile cellular telecommunications industry, customer satisfaction is high.. Telecommunication Policy, vol. 25, no. 24969, 2001.
– is widely used by modern service providers. Let's take a look at these Telecom companies for a moment. These businesses can offer a comprehensive range of products and services, including mobile phone and home phone services. Some are experts in the field of mobile telecommunications (China Mobile, iPhone & Samsung etc.) clients use which phone’s.
1.1 Motivation of the research:
To forecast consumer churn, we use machine learning algorithms. There are many explanations for churn estimation. The most important aspect, churn prediction, is driving the current investigation into the operator company's problem. A missed call, a large fees, or bad loans are only a few of the reasons why churn is predicted.
1.2 Research questions:
Will we allow a more specialized perspective to more accurately predict churn in the dataset on the machine learning repertory? Will we develop more accurate predictive machine learning methods for predicting the occurrence of consumer turnover in order to reduce the number of false negatives in statistical experiments?
1.3 Research objectives:
To have a more alleviated property perspective on the dataset used.To develop a more accurate predictive machine-learning algorithm with a lower FN count.
1.4 Research scope:
Customer Churn congeniality can be predicted using classification-based machine learning algorithms. Using machine learning techniques, we are able to achieve higher accuracy. In the future, we will use deep learning to make decisions in the same way as human brains do.
1.5 Research organization:
The rest of the research is organized as follows: The second chapter addresses related work (Literature review).We'll talk about methodology in Chapter 3.The outcome and performance analysis are described in Chapter 4. After all, this article comes to a close in Chapter 5.
©Daffodil International University 3
CHAPTER 2
LITERATURE REVIEW
Keaveney, [1] 1995 Many companies are recognizing the importance of a customer-focused business approach in preserving their competitive edge and sustaining a consistent profit level in today's competitive market. That is to say, companies depend heavily on customer sales.
Customer acquisition and retention, on the other hand, is a difficult and costly marketing job.
The cost of efforts that might allow a firm to retain a customer should be considered because new account setup, credit searches, and marketing and advertising costs can add up to several times the cost of efforts that might allow a firm to retain a customer.
Huang et al. [2] A method based on ordinal regression was proposed in the mobile telecommunications industry to predict market churn and tenure. They created a model with customer tenure as an ordinal outcome variable using ordinal regression. Ordinal regression may be a feasible alternative to survival analysis for estimating the churn time of mobile customers, according to their results. This was the first study to use ordinal regression as a methodology for modeling customer tenure, according to the researchers.
Kim et al. [3] Network analysis was used to investigate the contact habits of subscribers in a mobile telecommunications company. They outperformed the conventional machine learning approach in predicting churn by Consider a network propagation mechanism that moves churning information from churners to non-churners based on call data records.
Hung et al. [4] intended to show how IT technology can be used to help with telecom churn management. Unlike several other churn analysis studies, their main aim was not to forecast consumer churning attitudes in order to determine what retention steps should be taken. To build a churn predictive model, the authors used data mining techniques such as decision trees, neural networks, and K-means cluster.
Huang and Kechad i [5] proposed a hybrid model-based learning method for forecasting consumer actions that combines supervised and unsupervised techniques. A The scheme employs a modified k-means clustering algorithm as well as a classic rule inductive technique (FOIL).
The authors concluded that their hybrid model is very promising and outperforms current models after a comparative review of a series of benchmarks and the use of real telecom datasets.
Kim and Yoon [6] In the Korean flexible contact market, the determinants of supporter turnover and customer loyalty were identified.
Owczarczuk[7] The utility of common data mining models in predicting client churn at a Polish cellular telecommunications company was investigated. Prepaid customers are more likely to churn, are less safe, and have less information about them, according to the author. When it comes to prepaid client mode churn, his findings revealed that linear models, especially logistic regression, are a very sensitive choice.
Idris et al. [8] Using the outfit characterization process, a smart churn forecast system for telecom was proposed. The adequacy of the proposed solution, which relies on RotBoost in combination with least excess and greatest significance highlights, in dealing with the high dimensionality of telecom datasets, is demonstrated using regular telecom datasets.Furthermore, it has a high degree of precision in predicting churners.
©Daffodil International University 4
van Wezel and Potharst [9] To enhance consumer preference forecasts, combine ensemble techniques such as "Bagging," "Boosting," and "MultiBoosting," with base statistical and machine learning approaches such as logistic regression and decision trees.The literature also provides detailed recommendations for feature selection and related strategies to researchers and practitioners.
Keramati et al. [10] Using a heuristic dimension reduction tool, determine that the best churn predictors are frequency of use, grievances, time of use, status, and subscription duration.
Furthermore, the literature shows that combining feature selection, sample selection, and a powerful classifier can significantly improve churn prediction accuracy.
©Daffodil International University 5
CHAPTER 3
RESEARCH METHODOLOGY
3.1 Introduction:
To build a model based on past churn to forecast future churn .This technique is used in the tele-Communication Operator's market. This section is divided into three subsections: results, algorithms, and implementation procedures. This research are customer churn predict how many customer are use this services .So this research are mainly use machine learning language using four machine learning algorithm .The subsections are listed below in alphabetical order.
This Research use future usable customer using tele-communication operator’s predicted. How many customer uses or not uses tele-communication operators. If seen the users churn to the operator then why are the main problem to the cause finally improve the customer churn following. Therefore more useful any operator’s company.
3.2 Data Description:
Customer Churn Predictions is a data collection. This data is gathered from an Iranian tele-communication company(https://archive.ics.uci.edu/ml/datasets/Iranian+Churn+Dataset#), which is a data source for emerging business sectors around the world.
Over the course of a year, this dataset was obtained at random from an Iranian telecom company database. The information for columns is contained in 3150 rows of data, each representing a customer. The characterization case had been identified, which is dependent on the deciding time frame:
Types of predict Values
Y__Train 2520
Y Test 630
Y__Train (No Churn) 2134
Y__Train( Churn) 386
Y__Test(No Churn) 521
Y__Test (Churn) 109
Figure: Values of predict data
©Daffodil International University 6
The first four months' data, which includes call-related divisions from the first month of the gauging time period and a comparison of Customer categories, indicates chapter 5 status for the following twelve months. The data-carrying 3150 mixable, 143 refers to the telecom association 1062 firms that did not go churn during the deciding period.
2nd4 month the data, which includes monetary division, comes from the second phase of the gauging time frame and is used to predict customer behavior. There are 2520 occurrences (churn report) in the data, with 364 relating to the telecom Customer Churn association.
Last 4 months Budgetary every tele customer out of the total last month of the gauging time frame and relating Customer identify that demonstrates status following the last four months. The data includes 3054 events (Customer Summaries), 476 calls to telecom companies, and 2640 businesses that did not churn within the estimated time period.
3.3.1AdaBoost:
AdaBoost is an acronym for Adaptive Boosting Classifier..It can be used to the conjunction with many types of algorithm improved performance .
AdaBoost algorithmic rule :
3.3.2 Decision Tree :
A decision tree is a particular kind of tree. A Decision Tree is a table that depicts the connection between inputs and cases/test conditions. It's a valuable tool for both checking and managing specifications for complex software packages. Multidimensional language helps testers to see all conceivable variations of test conditions and easily spot nonsensical ones.
The situations are represented by True (T) and False (F) values. The following are the algorithm's laws:
©Daffodil International University 7
3.3.3 Bagging:
It's a meta-algorithm that's used in statistical classification and regression to the dataset algorithm to increase stability. In addition to what is considered to be material, the Bootstrap integration may be a machine learning tool that includes a meta-algorithm designed to improve the soundness and accuracy of machine learning algorithms. Adding helps to reduce variability and prevent overdoing it.
Formula:
3.3.4 Random forest :
Random forest predicts using one or more decision trees. The hyper parameters of a random forest are virtually identical to those of a call tree or a textile classifier. This algorithmic program will then build a wire tree for each sample in the next step. The prediction effect will then be applied to each call tree.
Formula:
©Daffodil International University 8
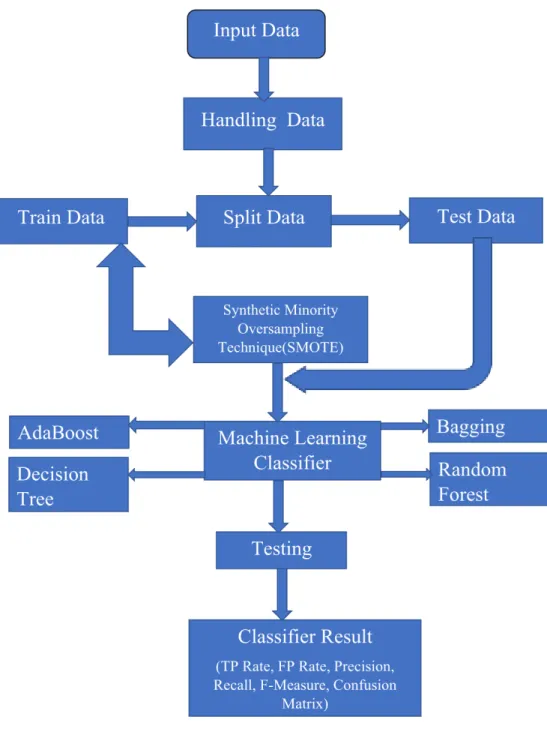
3.4 Implementation process:
The implementation procedures are illustrated in this part.
Fig. 1:The system for projecting consumer churn prediction of telecommunication's various algorithms in a graphical representation.
©Daffodil International University 9
3.4.1 DATA INPUTS:
This move involves implementing the data in the proposed method after collecting it for a period of 12 months. We have 12 attributes and one class as input data for this study.
3.4.2 DATA HANDLING:
The process of planning for social events, collecting and displaying data in a way that is useful to others, such as in diagrams or graphs, is referred to as data handling. In this portion of data handling, we gathered data from the previous 12 months as well as all missing values in that data table. We collect data from various types of attributes and enter it into our data table with accuracy and precision so that the data can be analyzed.
3.4.3 Split Data:
Splitting a data collection for training or research purposes. The technique for training or research is divided in this article.
3.4.5 SMOTE:
SMOTE is a technique for creating synthetic minority class samples by oversampling. It's used to make a synthetic training set that's class-balanced or nearly class-balanced, which is then used to train the classifier.
3.4.5 Classifier Result:
The classification method is used to predict the class of given data points. In the flowchart, look for the FP / FN Rate, TP / TN Rate, F-Measures, Precision, Recall, ROC Curve and uncertainty Matrix. The class of supervised learning was correlated with classification, and the destination changed with the input data. It is the most important aspect of appreciating the classifier and seeing its usefulness after training the methods.
Precision and recall are based on the quantity of topicality. True positive recall is a term used to describe when a person remembers something. The quantity of accuracy is used to measure false positives. F-Measure contains (2* precision * recall) / (precision + recall) to test the information recovery mechanism. The True Positive Rate with False-positive Rate section of the Recover Operating Characteristic Curve. True Positive, True Negative, False Positive, False Negative are all concepts that Precision-Recall Curves are aware of.
This execution of classification confusion matrix, which is a table used to determine the execution of a classification, is evaluated.
©Daffodil International University 10
CHAPTER 4
RESULTS AND DISCUSSION
Predict the operator’s company The output values of all classification techniques calculated on the basis of various measurements are reflected in the result section. More algorithm techniques were used to determine the output of the respective. To assess our accuracy, we used k fold cross-validation in our analysis.
4.1 Adaboost
What we can take away from this matrix is the following:
“YES” and “NO” are the two possible prediction groups. If we were forecasting the existence of a disease, "yes" would indicate that they have the disease, while "no" would indicate that they do not..
The uncertainty matrix of a binary classifier is commonly used to generate this list of rates.
Accuracy: How much does the classifier get it right?
▪ Total (TP+TN)/Total
▪ (0.90) (617+95)/788
Misclassification Rate: What percentage of the time is it incorrect?
▪ ( FP + FN ) / Total = (61+19)/788=0.10
▪ Approximately 1 less than precision
▪ It’s also referred to as the 'Error Rate'.
©Daffodil International University 11
True Possitive Rate: How much does it predict yes when it is actually yes?
▪ ( TP / Actual) Yes=95/110=0.86
▪ Also known as 'Recall' or 'Sensitivity'
False Positive Rate: How often does it correctly predict no?
▪ FP/Actual no=61/678=0.09
True Negative Rate: How much does it predict no when it's actually no?
▪ TN/Actual No=617/678=0.91
▪ Also known as ‘Specificity’.
False Negative Rate: No, it's not true. What percentage of the time does it predict yes?
●
15/110=0.13 • FN/Actual
Accuracy: When it correctly predicts yes.
▪ How much does it get it right?
▪ yes=91/110=0..82 TP / predicted
Prevalence: What percentage of the time Is there a yes condition in our sample?
▪ True yes / total = 110/788= 0.13
Figure: ROC Curve of Adaboost
©Daffodil International University 12
The AdaBoost Curve is a commonly used graph that summarizes the performance of a classifier over all possible thresholds. The true positive rate (y-axis) is plotted against the false positive rate (x-axis) as the class assignment threshold increases. In Iranian statistics, the conditional probabilities are sensitivity and precision, the prior is prevalence, and the posterior probabilities are positive/negative predicted values.
4.2 Decision Tree:
What we can take away from this matrix is the following:
“YES” and “NO” are the two possible prediction groups. If we were forecasting the existence of a disease, "yes" would indicate that they have the disease, while "no" would indicate that they do not..
This is a list of rates that is often derived from a binary classifier's confusion matrix.
Accuracy: How much does the classifier get it right?
▪ ( TP + TN ) / Total
▪ ( 653 + 91 ) / 788= 0.94
Misclassification Rate: What percentage of the time is it incorrect?
▪ ( FP + FN ) / Total = ( 25 + 19 ) / 788= 0.06
▪ It’s also known as ‘Error Rate'.
True Possitive Rate: How much does it predict yes when it is actually yes?
▪ TP/Actual Yes=91/110=0.83
▪ Also known as 'Recall' or 'Sensitivity'
False Positive Rate: How much does it correctly predict no?
▪
FP/Actual no=25/678=0.03
©Daffodil International University 13
True Negative Rate: How much does it predict no when it's actually no?
▪ TN/Actual No=653/678=0.96
▪ TN/Actual No=65
▪ Also known as ‘Specificity’.
▪ it is equal to 1 minus Accuracy.
False Negative Rate: how much does it actually predict yes?
▪ FN/Actual=19/110=0.17 FN/Actual=19/110=0.17 Accuracy: When it correctly predicts yes.
▪ How much does it get it right?
▪ Yes= TP / Predicted
▪ yes= 94 / 110= 0..85
Prevalence: What percentage of the time does the yes condition arise in our sample?
▪ True yes/total=110/788=0.13
Figure: ROC Curve of Decision Tree
This is a typical graph that summarizes a classifier's output across all possible thresholds. It's made by plotting the true positive rate (yaxis) against the false positive rate (x-axis) when you change the threshold for categorizing observations.
The conditional probabilities are the sensitivity and precision in Bayesian statistics. The prior is the prevalence, and the posterior probabilities are the positive/negative expected values.
©Daffodil International University 14
4. 3 Bagging:
“YES” and “NO” are the two possible prediction groups. If we were forecasting the existence of a disease, "yes" would indicate that they have the disease, while "no" would indicate that they do not..
The uncertainty matrix of a binary classifier is commonly used to generate this list of rates.
Accuracy: How much does the classifier get it right?
▪ ( TP + TN ) / Total
▪ ( 664 + 110 ) / 788= 0.98
Misclassification Rate: What percentage of the time is it incorrect?
▪ ( FP + FN ) / Total
▪ ( 25 + 19 ) / 788= 0.06
▪ Also known as ‘Error Rate,'
▪ it is equal to 1 minus Accuracy.
True Possitive Rate: How much does it predict yes when it is actually yes?
▪ TP/Actual Yes=91/110=0.83 TP/Actual No=91/110=0.83 TP/Actual No=91
▪ Also known as 'Recall' or 'Sensitivity'
▪ False Positive Rate:
▪ How much does it correctly predict no?
▪ FP/Actual No = 25 / 678 = 0.03
True Negative Rate: How much does it predict no when it's actually no?
▪ TN / Actual No= 653 / 678= 0.96
▪ TN/Actual No=65
▪ Also known as ‘Specificity'.
▪ it is equal to 1 minus Accuracy.
False Negative Rate: how much does it actually predict yes?
▪ FN / Actual
▪ 19 / 110= 0.17
▪ Accuracy: When it correctly predicts yes.
How much does it get it right?
▪ TP/predicted Yes=107/110=0..97
Prevalence: What percentage of the time does the yes condition arise in our sample?
▪ True yes/total=110/788=0.13
©Daffodil International University 15
Figure: ROC Curve of Bagging
This is a standard graph that shows the performance of a classifier at all possible thresholds. When you change the threshold for categorizing observations, you plot the true positive rate (Y-axis) against the false positive rate (X-axis).
The conditional probabilities are the sensitivity and precision in Bayesian statistics.
The prior is the prevalence, and the posterior probabilities are the positive/negative expected values.
4.4 Random forest:
©Daffodil International University 16
What we can take away from this matrix is the following:
“YES” and “NO” are the two possible prediction groups. If we were forecasting the existence of a disease, "yes" would indicate that they have the disease, while "no" would indicate that they do not..
This is a list of rates that is often derived from a binary classifier's confusion matrix.
Accuracy: How much does the classifier get it right?
▪ (652+94)/788=0.94 (TP+TN)/Total
Misclassification Rate: What percentage of the time is it incorrect?
▪ ( FP + FN ) / Total
▪ ( 26 + 16 ) / 788 = 0.05
▪ Also known as ‘Error Rate'.
The classifier correctly predicted ‘yes' 120 times and ‘no' 668 times out of 788 instances.
True Possitive Rate: How much does it predict yes when it is actually yes?
▪ TP/Actual Yes=94/110=0.85
▪ TP/Actual No=94/110=0.85
▪ Also known as 'Recall' or 'Sensitivity'
False Positive Rate: How much does it correctly predict no?
▪ FP/Actual no=26/678=0.03
True Negative Rate: How much does it predict no when it's actually no?
▪ TN/Actual No=652/678 =0.96
▪ Also known as ‘Specificity’.
False Negative Rate: how much does it actually predict yes?
▪ FN/Actual=16/110=0.14
Accuracy: When it correctly predicts yes.
▪ Yes=94/110=0..85
©Daffodil International University 17
Figure: ROC Curve of Random Forest
Random Forest is a graph that summarizes a classifier's output over all possible thresholds. It's made by plotting the true positive rate (Y-axis) against the false positive rate (X-axis) as the threshold for class assignment changes.
Data Rate of Algorithm
The result section reflects the various performance values of all classification techniques determined on the basis of different measurements. More algorithm techniques were used to
determine the output of the respective. In our study, we used k fold cross-validation to determine our accuracy.
©Daffodil International University 18
Model Label TP FP
Precision Recall F-Measure Accuracy
Name Rate Rate
Adaboost
No Churn 0.89 0.08 0.98 0.92 0.95
Churn 0.91 0.11 0.69 0.89 0.78 97%
Decision
No Churn 0.80 0 .0.04 0.96 0.95 0. 0.96
Tree
Churn
0.95 0.19 0.79 0.81 0.80
90%
Bagging
No Churn 0.85 0.02 0.97 0.98 0.97
Churn 0.97 0.14 0.89 0.85 0.87
98%
Random
No Churn 0.88 0.05 0.97 0.97 0.97
Forest
Churn
0.94 0.17 0.86 0.88 0.86
98%
Figure: Data Rate & Accuracy of the Algorithm
Shows the confusion matrix for forecasting Customer Churn over a One year period using Four machine learning algorithms are Adaboost, Decision Tree, Bagging, and Random Forest.
Indicates that a variety of existing methods for estimating Predicted by Machine Learning classifiers and other methods have been used. So, here are some province methods and how accurate they are. They are compared to our proposed model, and it is found that the proposed study has a 98 percent accuracy .Bagging uses Mis-classified samples higher preference. This accuracy are effective performance of the tele-com operator’s company dataset.
©Daffodil International University 19
CHAPTER 5
CONCLUSIONS AND RECOMMENDATIONS
5.1 Conclusion:The aim of this form of research in the telecom market is to assist companies in increasing their profits. It's become common knowledge that forecasting churn is one of the most lucrative revenue streams for telecom companies. As a result, the aim of this study was to develop a framework that could predict customer churn in the Iranian telecom sector. High AUC values are needed for these prediction models. The sample data is divided into 70 percent for training and 30 percent for testing to evaluate and prepare the model. For validation and hyperparameter optimization, we decided to use cross validation with 10-folds.To make the features ready for machine learning algorithms, we used feature engineering, efficient feature transformation, and a selection approach. We also ran into a problem with the results, which was unbalanced. Customers' turnover accounts for just about 5% of the entries. Under sampling or tree algorithms that were not affected by the problem were used to solve this problem. Because of their versatility and applicability in this form of prediction, four tree-based algorithms were selected. Decision Tree, Random Forest, Bagging and AdaBoost Algorithm are some of the algorithms available. Since the ROC value of
Iranian reached 98 percent, the method of preparing and selecting features, as well as entering the mobile social network features, had the greatest effect on the model's performance. In all of the tests, the Bagging model came out on top. Random Forest algorithm is ranked second, while the AdaBoost and Decision Tree algorithms are ranked third and fourth, respectively. The decrease in result may be attributed to the non-stationary data model phenomenon, which necessitates model training at regular intervals. The use of Social Network Analysis features improves the results of telecom churn prediction.
©Daffodil International University 20
REFERENCES
V. Umayaparvathi and K. Iyakutti. A study on consumer churn prediction in the telecommunications industry: datasets, processes, and metrics. 2016;3(4):1065–70 in International Research Journal of Engineering Technology.
Customer retention, loyalty, and satisfaction in the German mobile cellular telecommunications industry, Gerpott TJ, Rams W, Schindler A. Telecommunication Policy, vol. 25, no. 24969, 2001.
T. Vafeiadis, K.I. Diamantaras, G. Sarigiannidis, and K. Chatzisavvas, “Customer churn estimation in telecommunications,” Simulation Modelling: Practice and Theory 55 (2015) 1-9.
L. Ning, L. Hua, L. Jie, and Z. Guangquan, “A market churn prediction model in the telecom industry using boosting,” IEEE Transactions on Industrial Informatics, vol. 10, no.
10, pp. 1659–1665.
A near-neighbor-based approach to time-series classification," Decision Support Systems, Volume 53, Issue 1, 2013, pp. 207–217; Yen-Hsien Lee, Chih-Ping Wei, Tsang-Hsiang Cheng, and Ching-Ting Yang, "A near-neighbor-based approach to time-series classification," Decision Support Systems, Volume 53, Issue 1, 2013, pp. 207–217.
Tomasz S. Za˛bkowski, Wiesław Szczesny, "Insolvency modeling in the cellular telecommunication industry", Expert Systems with Applications, 39, 2012, 6879–6886
Saravanan M.1 and Vijay Raajaa G.S., "A Graph-Based Churn Prediction Model for Mobile Telecom Networks", ADMA, LNAI , 7713, 2012, pp. 367–382.
Abbas Keramati, Seyed M.S.Ardabili, "Churn analysis for an Iranian mobile operator", Telecommunications Policy, 35 , 2011, pp. 344–356.
M.A.H. Farquad, V. Ravi, and S.B. Raju: Churn prediction using comprehensible help.
Vector machine is a CRM program that analyzes data. Soft Comput. Appl. 19, 31–40 (2014) Telecommunications Policy 35, 344–356. Abbas Keramati a,n, SeyedM.S.Ardabili (2011),
“Churn study for an Iranian mobile operator,” Telecommunications Policy 35, 344–356. [11]
Freddie Mathews Kau, Hlaudi Daniel Masethe and Craven Klaas Lepota, Member, IAENG, (2017)
©Daffodil International University 21