A DECISION MAKING APPROACH FOR SELECTING AN EVENT MANAGEMENT COMPANY
BY FARIA AFRIN ID: 171-15-9230 NISAR AHMED
ID: 171-15-9325 AND
MD. MAHMUDUL HASAN ID: 171-15-9309
This Report Presented in Partial Fulfillment of the Requirements for the Degree of Bachelor of Science in Computer Science and Engineering
Supervised By
Md. Zahid Hasan
Assistant Professor Department of CSEDaffodil International University Co-Supervised By
Md. Tarek Habib
Assistant Professor Department of CSEDaffodil International University
DAFFODIL INTERNATIONAL UNIVERSITY DHAKA, BANGLADESH
JANUARY 2021
APPROVAL
This Project titled “A Decision Making Approach For Selecting An Event Management Company”, submitted by Faria Afrin, ID No: 171-15-9230, Nisar Ahmed, ID No: 171-15-9325 and Md. Mahmudul Hasan ID No: 171-15-9309 to the Department of Computer Science and Engineering, Daffodil International University, has been accepted as satisfactory for the partial fulfillment of the requirements for the Degree of B.Sc. in Computer Science and Engineering and approved as to its style and contents. The presentation has been held on 28-01-2021.
BOARD OF EXAMINERS
Dr. Touhid Bhuiyan Chairman
Professor and Head
Department of Computer Science and Engineering Faculty of Science & Information Technology Daffodil International University
Md. Tarek Habib Internal Examiner Assistant Professor
Department of Computer Science and Engineering Faculty of Science & Information Technology Daffodil International University
Saiful Islam Internal Examiner
Senior Lecturer
Department of Computer Science and Engineering Faculty of Science & Information Technology Daffodil International University
Dr. Md Arshad Ali External Examiner
Associate professor
Department of Computer Science and Engineering
©Daffodil International University ii
DECLARATION
We hereby declare that, this project has been done by us under the supervision of Md.
Zahid Hasan, Assistant Professor and Co-supervision of Md. Tarek Habib, Assistant Professor, Department of CSE Daffodil International University. We also declare that neither this project nor any part of this project has been submitted elsewhere for award of any degree or diploma.
Supervised by:
Md. Zahid Hasan Assistant Professor
Department of Computer Science and Engineering Daffodil International University
Co-Supervised by:
Md. Tarek Habib Assistant Professor
Department of Computer Science and Engineering Daffodil International University
Submitted by:
Faria Afrin ID: -171-15-9230
Department of Computer Science and Engineering Daffodil International University
Nisar Ahmed ID: -171-15-9325
Department of Computer Science and Engineering Daffodil International University
Md. Mahmudul Hasan ID: - 171-15-9309
Department of Computer Science and Engineering Daffodil International University
©Daffodil International University iv
ACKNOWLEDGEMENT
First we express our heartiest thanks and gratefulness to almighty God for His divine blessing makes us possible to complete the final year project successfully.
We really grateful and wish our profound our indebtedness to our Supervisor Md.
Zahid Hasan, Assistant Professor and Co-supervisor Md. Tarek Habib, Department of CSE Daffodil International University, Dhaka. Deep Knowledge & keen interest of our Supervisor and Co-supervisor in the field of “Decision Science” helped us to carry out this project. The entire time they have upheld and enlivened us and demonstrated the correct way. Their endless patience, scholarly guidance ,continual encouragement , constant and energetic supervision, constructive criticism , valuable advice ,reading many inferior draft and correcting them at all stage have made it possible to complete this project.
We would like to express our heartiest gratitude to Prof. Dr. Touhid Bhuiyan, Professor and Head, Department of CSE, for his kind help to finish our project and also to other faculty member and the staff of CSE department of Daffodil International University.
We would like to thank our entire course mate in Daffodil International University, who took part in this discuss while completing the course work.
Finally, we must acknowledge with due respect the constant support and patients of our parents.
ABSTRACT
Understanding the goals with planning, designing, conceptualization and co-ordination an event management company plays a vital role and ends this process with proper execution. But nowadays many clients are facing more and more demanding and competitive market where taking decisions are completely tough. For this reason it is much more difficult for a client to find the best company when we have so many alternatives. For that purpose, available decision making methods are studied which may aid the decision makers to set the priorities and help them to make the best decision. The decision-making process involves a choice from a number of alternatives.
This process is usually a complex process, which involves resources and time consumption. In this paper, we have considered five important attributes among three different companies as alternatives which is regarded as a multi criteria decision making problem for selecting an Event Management Company. In this study, a decision support framework is proposed for the selection of Event Management Company and ranking them using the Analytic Hierarchy Process (AHP) method and Generic Feature Extraction Method. This paper provides all the detailed information about the decision making process to aid the decision makers. Here all the relative importance of alternatives has been calculated by using AHP. The ultimate decision is prepared based on the arithmetical scores seized by the alternatives and to demonstrate all the things is presented on the proposed methodology.
©Daffodil International University vi
TABLE OF CONTENTS
CONTENT PAGE NO
Board of examiners i
Declaration ii Acknowledgements iv
Abstract v
CHAPTER PAGE NO CHAPTER 01: INTRODUCTION 1-3
1.1 Introduction 011.2 Motivation 01
1.3 Rationale of the Study 02
1.4 Research Questions 02
1.5 Expected Output 03
1.6 Report Layout 03
CHAPTER 02: BACKGROUND 4-6
2.1 Introduction 042.2 Related Works 04
2.3 Comparative Analysis and Summary 2.4 Scope of the Problem 06
2.5 Challenges 06
CHAPTER 03: RESEARCH METHODOLOGY 07-14
3.1 Introduction 073.2 Data Collection Procedure 07
3.3 Statistical Analysis 3.4 Proposed Methodology 08
CHAPTER 04:
IMPLEMENTATION AND RESULT ANALYSIS 15-25
4.1 Introduction 15 4.2 Experimental Results & Analysis 154.3 Discussion 25
CHAPTER 05: CONCLUSION & FUTURE WORK 26
5.1 Conclusions 26
5.2 Further Work 26
REFERENCES
27©Daffodil International University viii
LIST OF FIGURES
FIGURES PAGE NO
Figure 3.3.1: Proposed Methodology 09
Figure 3.3.1.1: Architectural Theory Diagram selecting an event management company.
10
Figure 4.2.2.1: Selection Performance Evaluation 24
Figure 4.2.2.2: Graphical representation of cross-validation between experimental results and benchmark results
25
LIST OF TABLES
TABLES
PAGE NOTable 3.2.1: All Criteria and Sub-criteria for Analytical Hierarchy Process 07 Table 4.2.1.1: Data of Providing Services of the Companies 15
Table 4.2.1.2: Using Five Point Scale 16
Table 4.2.1.3: Data of Providing Services of the Companies 16
Table 4.2.1.4: AHP Measurement Scale 16
Table 4.2.1.5: Pairwise Comparison Matrix With Respect to the Goal 17
Table 4.2.1.6: Pairwise Comparison Matrix 17
Table 4.2.1.7: Normalized Pairwise Comparison Matrix 17 Table 4.2.1.8: Eigenvector on Individual Criteria. 18
Table 4.2.1.9: Calculating the Consistency 19
Table 4.2.1.10: Ratio Index 19
Table 4.2.2.1: Customer Getting Services from C1 (6380 Customers in 2018)
20
Table 4.2.2.2: Customer Getting Services from C2 (8320 Customers in 2018)
20
Table 4.2.2.3: Customer Getting Services from C3(5040 Customers in2018) 20 Table 4.2.2.4: Root-Level Attributes‟ Weight Calculation 21 Table 4.2.2.5: Table 7: Dataset for Different Companies Providing Services to the Customers (Year 2019)
21
Table 4.2.2.6: Transformation of Evaluation Grades into Numerical Values 21
Table 4.2.2.7: System input acquisition 21
Table 4.2.2.8: Rules set up for knowledgebase Construction 22 Table 4.2.2.9: Initial Input transformation with incomplete information 22
Table 4.2.2.10: Final Input transformation 22
Table 4.2.2.11: Attributes’ minimum value calculation 23
Table 4.2.2.12: Attributes’ Feature Extraction 23
Table 4.2.2.13: Alternatives' Utility Calculation 23 Table 4.2.2.14: A cross-validation between experimental results and
benchmark results
24
©Daffodil International University 1
CHAPTER 1
Introduction
1.1 IntroductionEvent management is the coordination of planning, executing and organizing the different features and tasks where they go through some processes and facilitate the every aspect of event. To smoothen up his process there are loads of event management companies offer their proposal to do the task by charging money. If we say more explicitly they offer their services are given below:
I. Budget Planning II. Event Communication
III. Site Selection and Negotiation IV. Arranging Lighting
V. Housing Management VI. Exhibit Coordination etc.
Apart from that there are loads of tasks to do and can be many elements to involve.
From small-scale events to large-scale events they provide more or less same things.
But it is much tougher than saying when we need to choose a best event management company according to our own accord and convenience among many companies.
Therefore, choosing the best company effectively we can take a help from Decision Support System. This system will help us to take a best decision among many decisions.
Basically, Decision Support System is a decision-making process where it involves a choice from various number of alternatives and these essential component will help decision makers to receive and analysis information in an effective manner.
Even though, this process is a complex process which needs resources and time.
1.2 Motivation
When it is time to choose a best event management company sometimes it is hard to choose the best option from different possible options. That time client face difficulties because he has to contact with different event companies and usually have to consult with an event manager and have to discuss their requirements, suggestions and different options for event purpose such as themes, venues, budget and so on. During this period
client could be confused seeing so many options and it is a very lengthy task as well as so much time consuming to go every event management company individually and discuss the thing.
To make this thing convenient and more effortless we came up with a plan to build a decision support framework which can provide the best solution to select an event management company.
1.3 Rationale of the Study
As Decision Support System helps decision-makers to take decision in an effective manner and will build a framework using AHP (Analytical Hierarchy Process) and Generic Feature Extraction Algorithm. Here in this paper we will try to keep focus on specific problem to solve.
1.3.1 Saving Time, Money and Effort: When time to choose right decision it is tough to do all the things at once. To consult event manager we need to go their office to office and have to ask details what they will provide which is very much time consuming and it takes much effort. A decision Support System will provide the best solution of this problem and allows client to get the best deal in less time.
1.3.2 Improving Efficiency and the Speed of Taking Decision: A client can take decision easily among many resources effectively. That s/he does not need to think twice before taking decision because in the meantime, s/he will get the effective result using decision support system.
1.4 Research Questions
Here are some questions which we have tried to solve in this paper.
I. Is there any decision support system which it will select the best event management company?
II. Is there any event management company selection process with alternative company name with multi attributes in decision support system?
©Daffodil International University 3 1.5 Expected Output
I. Time saving II. Cost Efficient
III. Helping to make the best decision efficiently
IV. Getting the information to select a high rank event management company V. Client can reanalyze the decision on own accord
1.6 Report Layout
The report is divided into five chapters. Each chapter deals with the different aspects of
"Event management Company Selection Using Decision Making Approach". Each chapter has various explaining parts in detail.
Chapter 1: Introduction
This chapter discusses the important theoretical concepts behind our project.
Here also discusses motivation, rational of study, research question and expected output.
Chapter 2: Background
This chapter discusses about related works, research summary, scope of the problem and challenges.
Chapter 3: Research Methodology
This chapter discusses about research subject & instrumentation, procedure of data collection, statistical analysis implementation requirements.
Chapter 4: Experimental Results and Discussion
This chapter discusses about experimental results, descriptive analysis.
Chapter 5: Summary, Conclusion, Recommendation and Implication for Future Research
This chapter discusses about summary, conclusions recommendations, further study.
CHAPTER 2 Background
2.1 IntroductionEveryday a lot of event occurs in cities. To select an event management company is very complex and difficult job. Event management is a process that coordinate every aspect of an event. Here we will try to figure out the best event management company basis on criteria.
In this chapter, we will discuss about other research papers which are related to our work, research summery, scope of the problem and challenges about this research.
2.2 Related Work
In this time, selection process is grown up. For selection, using AHP there are several works done. The appropriate machine tools selection is an important part of Product Company. Inappropriate selection waste money, time, workforce etc. They developed a selection method using AHP [1]. A similar solution method (TOPSIS) was proposed by Rubayet to eligible alternatives rank [2]. On the other hand, AHP-TOPSIS_QFD method proposed by Dipika Pramanik select a resilient supplier [3]. In addition, Jasmin J. Lim proposed DEA approach for select supplier [4]. For the post graduate students, Neset tried to solve the selection problem of courses. Using AHP and PROMETHEE methods determines which course will be chosen on master course selection [5]. The selection of CMS (Content Management System) among attainable alternatives is regarded as a multi criteria decision making problem. This paper consists of four alternatives and seven criteria is built they are proposed AHP (Analytic Hierarchy Process) integrated Grey-TOPSIS method, and they applied this in a Turkish foreign trade company. AHP is applied to determine the weights from the seven criteria and from the four alternatives TOPSIS is applied to rank [6]. There is a paper which is reports the final results and process of a hospital site selection among the Region 5 of Metropolitan Shiraz. This paper used integrated fuzzy ANP (Analytical Network Process) systems with GIS. This study used two-step decision-making approach for
©Daffodil International University 5 selecting the site of hospital in the Region 5 of Shiraz Metropolitan Area. First of all they used FAHP and GIS for selection and the screening of three congenial options out of all developable parcels. Second of all the final evaluation result was performed with the help of FANP which is interactions with the all criteria [7]. There is one more paper, which is presented a study and that is comparison of AHP and FEAHP methods with relation to sustainable dimensions and also criteria. Those dimensions and criteria are exceptionally relevant to the problem of sustainable end-of-life vehicles (ELVs) management. This paper also reported the application of the AHP and the FEAHP methods. When others company wants to make decisions which is based on evaluation of the sustainable alternatives then the proposed system might be helpful for the other companies. Although this proposed system is too much simple for managers and engineers because this implementation of the technique is very convenient [8]. In 2016, Vipul Jain, Arun Kumar Sangaiah, Sumit Sakhuja, Nittin Thoduka, Rahul Aggarwal proposed a case study for supplier selection. This study selected supplier in an Indian automobile companyusing analytical hierarchy process (AHP) and TOPSIS. Firstly, this process deals with identifying the qualitative and quantitative criteria and interviewing of the industry experts. Finally, using AHP and TOPSIS the suppliers are ranked [9]. In 2020, Rohit Singh,Shwetank Avikal, Rashmi Rashmi, Mangey Ram proposed a Kano model for selecting best mobile phone which is used analytical hierarchy process (AHP) and TOPSIS. In this paper Kano model describes and also divides mobile phones specification in various categories. Fuzzy AHP model is applied to calculate weight from various mobile phone features. Finally, TOPSIS is also applied for ranking of available substitutes. [10]
2.3 Scope of the Problem
As the research data is related to the business, so we faced many problems to collect data.
There was no previous research paper, so the previous data was empty.
The DSS (Decision Support System) was pretty difficult for implementation.
Data implementation and calculations are lengthy process.
2.4 Challenges
We went many companies to collect data. Data collection is the biggest challenge.
Many companies didn't want to share their data.
Some data are changed day by day for event purpose.
We didn't get perfect data. Some were missing.
Some companies need to permission to collect data. So we contact with our supervisor then he contact and get permission for us.
Select attribute was a big problem.
Use different algorithm was a challenge.
Select and implementation of framework was a challenge.
To the working procedure there were several challenge.
©Daffodil International University 7
CHAPTER 3 Research Methodology
3.1 IntroductionThere are many algorithms in computer science for decision making. In this paper, we will use Analytic Hierarchy Process (AHP). The Analytic Hierarchy Process (AHP) is one of the staple mathematical methods for decision making from different criteria.
3.2 Data Collection Procedure
In our works, we need some data about some Event Management Companies. All the data are collected from different Event Management Company from Dhaka city. We have find out some criteria, Depend on those criteria we have also selected some sub- criteria. We need all the information about those criteria and sub-criteria of three Event Management Company. All the criteria and sub criteria of Event Management Company are shown in figure 3.1 which is given below.
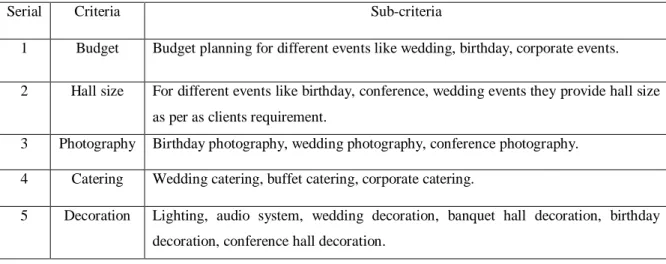
Table 3.2.1: All Criteria and Sub-criteria for Analytical Hierarchy Process
Serial Criteria Sub-criteria
1 Budget Budget planning for different events like wedding, birthday, corporate events.
2 Hall size For different events like birthday, conference, wedding events they provide hall size as per as clients requirement.
3 Photography Birthday photography, wedding photography, conference photography.
4 Catering Wedding catering, buffet catering, corporate catering.
5 Decoration Lighting, audio system, wedding decoration, banquet hall decoration, birthday decoration, conference hall decoration.
3.2.1 Budget:
Budget means the total cost of the ceremony like wedding and Birthday. This Budget also contains the cost for decoration and catering. This Budget is calculated in US Dollar. It’s an important parameter for decision making.
3.2.2 Hall Size:
Hall size means the size of the place where the event will take place. This size is calculated in Square feet.
3.2.3 Photography:
All type of photography such as birthday photography, wedding photography, and conference photography will be consider as “Photography” in this section.
3.2.4 Catering:
All type of catering such as Wedding catering, Birthday catering, Buffet catering, sit down catering will be consider as “Catering” in this section.
3.2.5 Decoration:
All type of Decoration such as Lighting, Wedding decoration, Banquet hall decoration, Birthday decoration, and Conference hall decoration will be counted as “Decoration”.
3.3 Proposed Methodology
AHP is very effective, extraordinary and very much time-utilized strategy of solving the complex problem and making the best decision. It is a very popular method for group decision making and helps to handle the problems arising from choosing alternatives. Apart from that, we will use Feature Extraction Method to select the best event management company for customers.
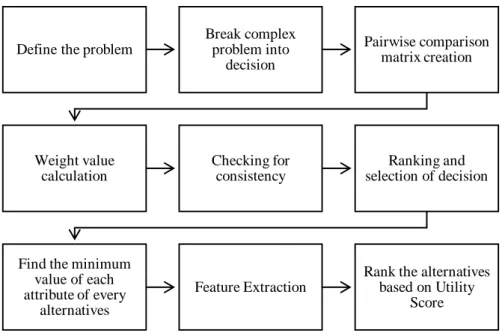
For this reason, we have proposed a methodology which follow the following steps to select the best event management company.
Defining the unstructured problem and specifying the solution we desire.
Breaking the complex problem and organizing the problem as a hierarchy to increase the understanding of the problem.
Constructing a pairwise comparison to form the comparison matrices with respect to relevant criteria.
Calculating the decision elements with relative weights, eigenvalue method will be used.
After computing the matrices, consistency properties will be tested that the decision-makers are consistent or not.
©Daffodil International University 9
For attaining the general scores of the substitutes we will group the elements in the basis of weighted decision.
Finding the minimum value of each attribute of every alternative will try to calculate the distance from the minimum value.
Calculating the utility of an alternative we will rank the alternatives and find the desired result.
This proposed methodology is illustrated in the figure 1 below:
Figure 3.3.1: Proposed Methodology
3.3.1 AHP Methodology
For implementing AHP method we will consider the following few steps.
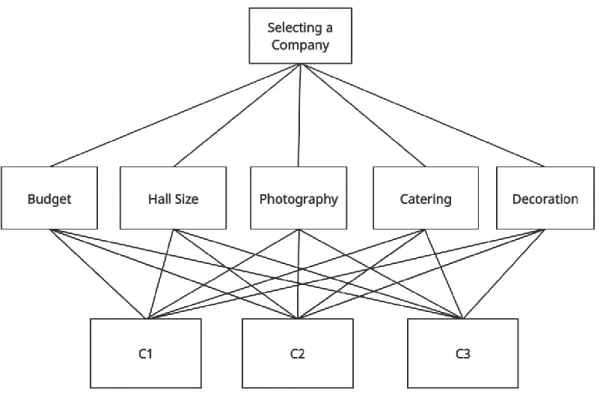
1. Construction of Structural Hierarchy: Here we will decomposed the complex problem into a structural hierarchy where the goal will be highlighted and criteria and alternatives will be identified. This is illustrated in figure 1 below:
Define the problem
Break complex problem into
decision
Pairwise comparison matrix creation
Weight value calculation
Checking for consistency
Ranking and selection of decision
Find the minimum value of each attribute of every
alternatives
Feature Extraction
Rank the alternatives based on Utility
Score
Figure 3.3.1.1: Architectural Theory Diagram selecting an event management company.
2. Construction of Comparative Judgments (Pair-wise Comparison Matrix): We will construct the pairwise comparison matrix for all the criteria and alternatives we have. This pair-wise comparison matrix demonstrate that how much a variable ‘A’ variable is important than ‘B’ variable. This logical things are measured using this pair-wise comparison matrix. Now the pair-wise comparison matrix is presented in the following equation :
𝑎𝑚𝑛 = 𝑤𝑚
𝑤𝑛 𝑚, 𝑛 = 1,2,3 … . . 𝑛 (1)
Here 𝑛 stands for criteria compared number. 𝑤𝑚 and 𝑎𝑚𝑛 are weights for the 𝑚 criterion and the ratio of the weight of the 𝑚 and 𝑛 criterion respectively.
3. Weight Determination through Normalization Procedure: From the pairwise comparison matrix we will determine the weights of the criteria and local weight of the alternatives from the following equation:
𝑎𝑖𝑗 = 𝑎𝑖𝑗
𝑚𝑎𝑥𝑖𝑗 , ∀𝑖 (2)
©Daffodil International University 11 4. Synthesis of Weight and Consistency Test: To calculate the eigenvector this
equation:
𝑤𝑚 =𝑎𝑚
𝑛 , ∀𝑚 (3)
The number of times multiplying the number of columns with the main eigenvector is the largest eigenvalue. Eq. 5 from which it can be gained is given below:
𝜆𝑚𝑎𝑥 = (∑ 𝐺𝑀11−𝑛1 ∗ 𝑋̅̅̅̅̅̅̅̅̅1̅̅̅) +… (∑ 𝐺𝑀1𝑛−𝑛𝑚 ∗ 𝑋𝑛̅̅̅̅̅̅̅̅̅̅̅̅) (4) After that, to calculate the Consistency Index (CI) and Consistency Ratio (CR) will follow the following equation:
CI =𝜆𝑚𝑎𝑥 − 𝑛
𝑛 − 1 (5)
CR =𝐶𝐼
𝑅𝐼 (6)
3.3.2 Generic Feature Extraction Approach Methodology
For implementing Feature Extraction we will consider the following few steps.
1. Weight Generation for Root-layer Attributes
Loads for the essential properties of a choice issue can be produced by investigating the chronicled information. Here, term frequency (TF) indicates the significance of a definite term within the overall document. Term frequency of a term ‘t’ can scientifically depict to as
Term Frequency, TF = 𝑓𝑡,𝑑
∑𝑡′∊𝑑𝑓𝑡′,𝑑 (7)
Whatever, each alternative has some multiple attributes. For this reason, average estimation is computed of the Term frequencies. The normal term recurrence of a property can be depicting to as:
AvgTFa = ∑𝑖=1
𝑁 𝑇𝐹𝑎
𝐿 (8)
Here, a= {a1, a2, a3… an} along these lines, the normal TF will be considered as the last loads of the root-level properties.
2. Weight generation for Intermediate-Layer Attributes
Most of the time, intermediate level attributes are needed to consider a definite attribute so that the decision attributes can be ranked. Attributes at the intermediate level are not generally appeared to be available straightforwardly in the datasets. Be that as it may, their subsidiaries for the most part decide their importance in decision-making tasks. Weight generation for the properties of the intermediate of the road level can be computed by utilizing Cosine Similarity. Cosine similarity is a measure of similarity between two non-zero vectors of an inner product space that measures the cosine of the angle between them [1]. Assume, α and β are two non-zero vectors in a vector space model. In this way, cosines likeness between α and β can be exhibited as,
Cosine Similarity = α . β
‖α ‖ ‖β‖ (9)
To propagate loads for the transitional level qualities, one of the non-zero vectors, α is built with the numeric qualities estimated from the essential properties of the choice issues which is constantly 1. The other vector, β is developed with the Term Frequency of the characteristics.
Weight of Attribute Aj= ∑𝑖=1
𝑁 𝛼𝑖𝛽𝑖 √∑𝑖=1𝑁 𝛼𝑖2√∑𝑖=1𝑁 𝛽𝑖2
(10)
3. Handling Uncertainty due to incomplete information.
Highlight extraction approach investigates the properties of all the gave choices to pick the most ideal option for an activity. Assume there are N an diverse options Aj
(j=1… N )for a specific activity. In this way, the choices can be characterized to as, A = {𝐴1, 𝐴2 , …, 𝐴𝑗 , …, 𝐴𝑁} (11)
Assume, there are L elementary attributes 𝑦𝑧 (z=1,…..,L) linked with every simple substitute. The elementary attributes can be expressed as follows:
Y = {𝑦1, 𝑦2 ,…, 𝑦𝑧 ,…, 𝑦𝐿} (12)
In this way, the fundamental properties for yz (z=1… L) Of an option can be scientifically articulated to as yjz; where, j (j=1,…, N) is the number of alternatives and
©Daffodil International University 13 z (z=1,… .,L) is the quantity of attributes .yz denotes the zth characteristic (yz) of jth elective (Aj).
Once more, the qualities of an option can be articulated to utilizing some conviction degrees against a predefined assessment grade.
4. Ranking and Selection of Decision
The fundamental principles can be spoken to as follows:
𝐶𝐺𝐹 ∶ 𝑖𝑓 {(I1, J1) ˄{(I2, J2)˄ … … (In, JT) }
then {(L1, J̅1), (L2, J̅2), … … , (Ln, J̅n)} (13)
Where𝐶𝐺𝐹, {(G= (1,2,… ,N) is the quantity of rules and F= (1,2,… ,N) expresses to the quantity of attributes} expresses to the standard for the information base.
Ii={I1,I2,...,IT}presents properties' assessment evaluation and Ji{i∈(1,...,N)} is the level of confidence as far as Ii. Li (i =1,2,… ,N) is the standard result and J̅ik {(i=1,2,…,N), (k=1,2,….,N)} is the level of Belief as far as Lk.Here, ∑ Jik ≤ 1and ∑ J̅̅̅ ≤ 1. ik
Level of conviction Bik can be spoken to by a fluffy enrollment work. All things considered, eq (7) can be composed as
𝐶𝐺𝐹 ∶ 𝑖𝑓{(I1k, J1kn to J1km ) ∧ (I2k, J2kn to J2km ) ∧ … … ⋀(ITk, JPkn to JPkm )}
then {(L1, J̅1k), (L2, J̅2k), … , (Ln, J̅nk)} (14)
The minimum value of the attribute j for the represented alternatives is known plane value and that could be exhibited as,
𝛼𝑗 = min (𝑒𝑖,𝑗) (15)
Here, i is the number of alternatives and j is the number of attributes. And 𝛼𝑗 is the minimum value of jth attribute.
Feature extraction is the simplest way to elucidate the attributes,
β𝑖,𝑗 = 𝑒𝑖,𝑗 - 𝛼𝑗 (16)
Arithmetic difference between the minimum value of a certain attribute and similar attribute of all the alternatives is performed by computing. Where, β𝑖,𝑗 determines the feature of jth attribute of ith alternatives with respect to jth minimum value (𝛼𝑗).
By using the following formula, the probability of mass of an attribute can be computed.
m𝑖,𝑗 = ∏𝑖=𝑁,𝑗=𝐿𝑖=1,𝑗=1(β𝑖,𝑗, 𝑤𝑗 ) (17)
Where, weights are represented as w, j( j= 1…….L) is the number of attributes states the weight of jth attribute (𝑒𝑗) with 0 <𝑤𝑗 ≤1.
The fundamental arithmetic summation formula is used to aggregate the probability masses.
C𝑖= ∑𝑖=𝑁,𝑗=𝐿𝑖=0,𝑗=0 m𝑖,𝑗 (18)
Where, C𝑖 (i=0,….,N) is the utility of ith alternative.
To make the final decision the best alternative can be approved as,
𝐶 = { max (C𝑖), 𝑓𝑜𝑟 𝑏𝑒𝑛𝑒𝑓𝑖𝑡 𝑎𝑡𝑡𝑟𝑖𝑏𝑢𝑡𝑒
min (C𝑖), 𝑓𝑜𝑟 𝑐𝑜𝑠𝑡 𝑎𝑡𝑡𝑟𝑖𝑏𝑢𝑡𝑒 (19) Here, i (i=1,2,…..N) is the number of alternatives.
©Daffodil International University 15
CHAPTER 4
Implementation and Result Analysis
4.1 IntroductionWe will get the best Event Management Company for the client using Analytic Analytical Hierarchy Process (AHP). We apply Analytical Hierarchy Process (AHP) method for decision making and after that to rank the best companies we use Generic Feature Extraction Approach. Finally this methods will give the best Event Management Company among three companies.
4.2 Experimental Result and Analysis
Here we have discussed all the experimental things which used in this paper.
4.2.1 Analytical Hierarchy Process (AHP) Implementation Here, we have implement the Analytical Hierarchy Process (AHP).
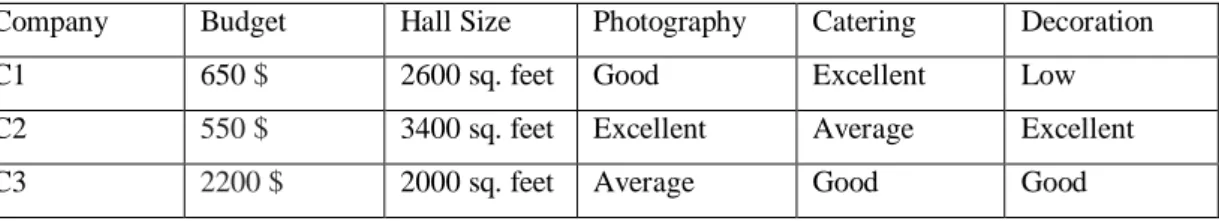
At first, we have taken five criteria to define the unstructured problem along with three alternatives for selecting an event management company (see Table 4.2.1.1).
Here, we have defined three companies such as Company 1 (C1), Company 2 (C2) and Company 3 (C3) are evaluated as alternatives.
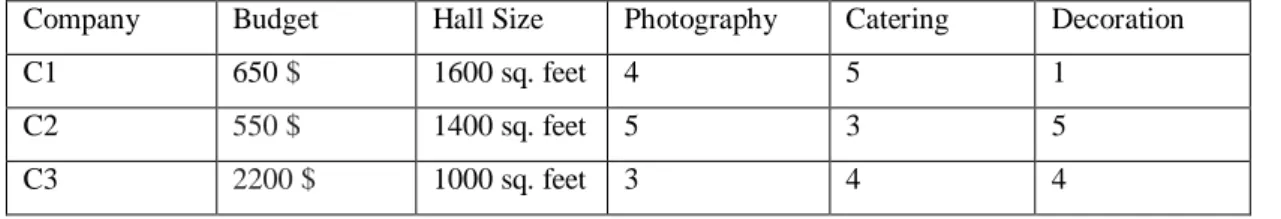
Table 4.2.1.1: Data of Providing Services of the Companies
Company Budget Hall Size Photography Catering Decoration
C1 650 $ 2600 sq. feet Good Excellent Low
C2 550 $ 3400 sq. feet Excellent Average Excellent
C3 2200 $ 2000 sq. feet Average Good Good
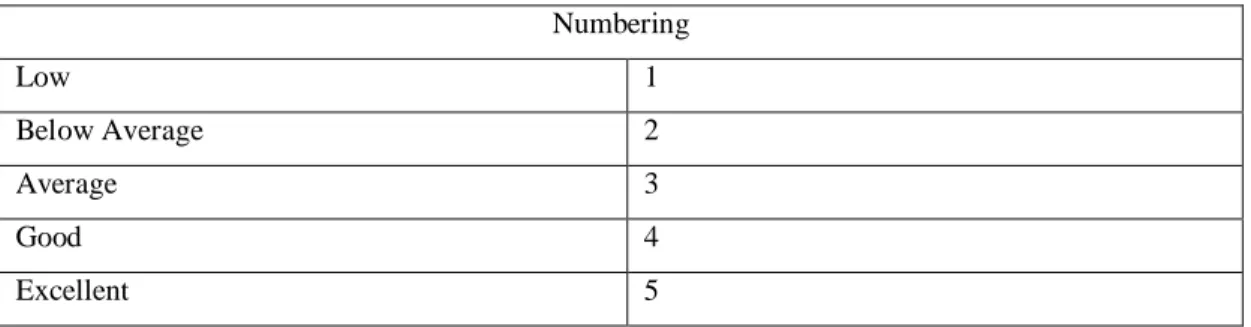
To express the satisfaction of customers we have used five point scale which define the customers individual opinion about the service of each company (see Table 4.2.1.2).
Table 4.2.1.2: Using Five Point Scale Numbering
Low 1
Below Average 2
Average 3
Good 4
Excellent 5
Table 4.2.1.3: Data of Providing Services of the Companies
Company Budget Hall Size Photography Catering Decoration
C1 650 $ 1600 sq. feet 4 5 1
C2 550 $ 1400 sq. feet 5 3 5
C3 2200 $ 1000 sq. feet 3 4 4
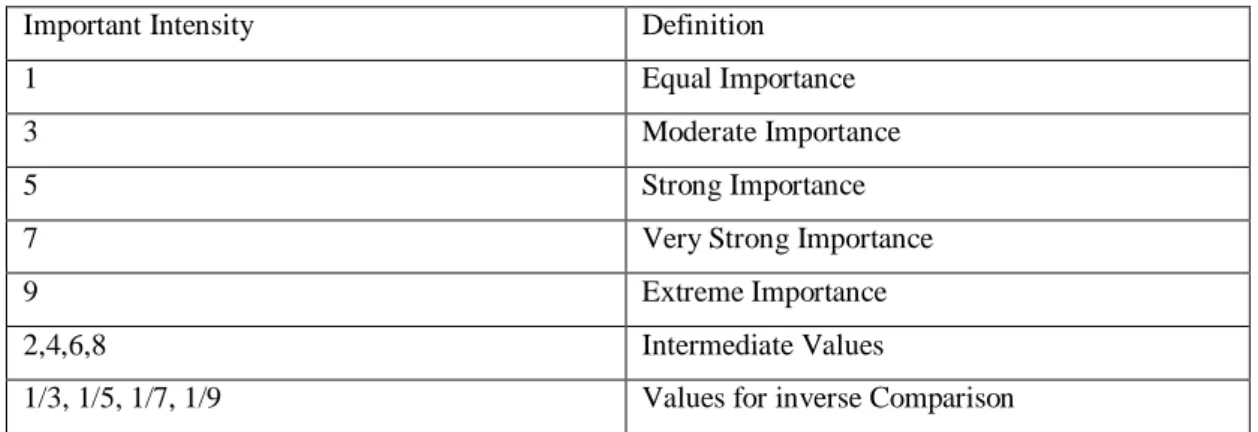
To make a comparison among all the criteria we have use the following Satty Scale (see Table 4.2.1.4).
Table 4.2.1.4: AHP Measurement Scale
Important Intensity Definition
1 Equal Importance
3 Moderate Importance
5 Strong Importance
7 Very Strong Importance
9 Extreme Importance
2,4,6,8 Intermediate Values
1/3, 1/5, 1/7, 1/9 Values for inverse Comparison
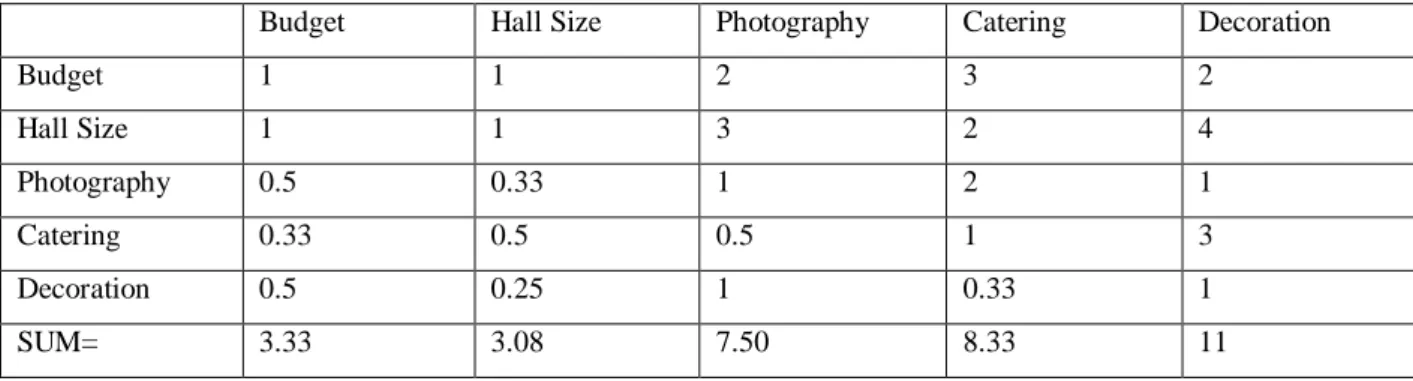
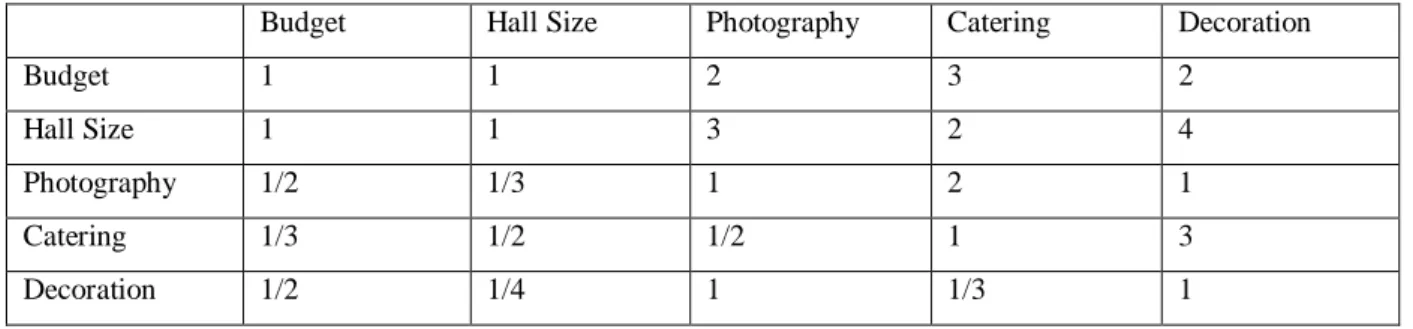
After that, a pairwise comparison matrix is created which is shown in below (see Table 4.2.1.5 and Table 4.2.1.6) using Eq. (1).
©Daffodil International University 17 Table 4.2.1.5: Pairwise Comparison Matrix With Respect to the Goal
Budget Hall Size Photography Catering Decoration
Budget 1 1 2 3 2
Hall Size 1 1 3 2 4
Photography 1/2 1/3 1 2 1
Catering 1/3 1/2 1/2 1 3
Decoration 1/2 1/4 1 1/3 1
Table 4.2.1.6: Pairwise Comparison Matrix
Budget Hall Size Photography Catering Decoration
Budget 1 1 2 3 2
Hall Size 1 1 3 2 4
Photography 0.5 0.33 1 2 1
Catering 0.33 0.5 0.5 1 3
Decoration 0.5 0.25 1 0.33 1
SUM= 3.33 3.08 7.50 8.33 11
Getting the normalized pair-wise comparison matrix through Weight determination (see Table 4.2.1.7) using Eq. (2).
Table 4.2.1.7: Normalized Pairwise Comparison Matrix
Budget Hall Size Photography Catering Decoration Criteria Weights
Budget 1/3.33
=0.30
1/3.08
=0.324
2/7.50
=0.266
3/8.33
=0.360
2/11
=0.181
1.431/5
=0.286 Hall Size 1/3.33
=0.30
1/3.08
=0.324
3/7.50
=0.40
2/8.33
=0.240
4/11
=0.363
1.627/5
=0.325 Photography 0.5/3.33
=0.15
0.33/3.08
=0.107
1/7.50
=0.133
2/8.33
=0.240
1/11
=0.090
0.72/5
=0.144 Catering 0.33/3.33
=0.099
0.5/3.08
=0.162
0.5/7.50
=0.066
1/8.33
=0.120
3/11
=0.272
0.719/5
=0.143 Decoration 0.5/3.33
=0.15
0.25/3.08
=0.08
1/7.50
=0.133
0.33/8.33
=0.039
1/11
=0.090
0.492/5
=0.098
The obtained normalized matrix from Table 4.2.1.7 are represented in Eq. 20:
[
0.30 0.324 0.266 0.360 0.181 0.30 0.324 0.40 0.240 0.363 0.15 0.107 0.133 0.240 0.090 0.099 0.162 0.066 0.120 0.272 0.15 0.08 0.133 0.039 0.090]
………..(20)
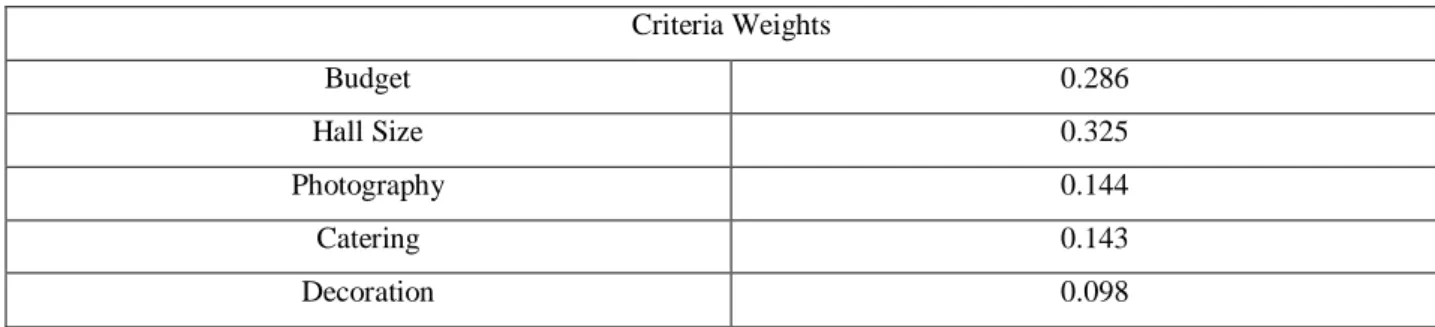
The eigenvector is needed for representing the priorities which is shown in Table 4.2.1.8 and calculating eigenvector using Eq. (3).
Table 4.2.1.8: Eigenvector on Individual Criteria.
Criteria Weights
Budget 0.286
Hall Size 0.325
Photography 0.144
Catering 0.143
Decoration 0.098
In Table 4.2.1.9 we have the calculation to determine the consistency where λmax is the eigenvalue of the pair-wise comparison matrix. After that we will calculate the Consistency Index (CI) and Consistency Random Index (RI) is shown in Table 4.2.1.10.
Then Consistency Ratio (CR) will be checked in order to check the consistency.
Consistency Ratio (CR) must be less than or equal to 0.10 which indicates that the degree of consistency is satisfactory.
©Daffodil International University 19 Table 4.2.1.9: Calculating the Consistency
Budget Hall Size
Photography Catering Decoration Weighted Sum Value….(1)
Criteria Weights
……(2)
(1)/(2)
Budget 0.286 0.
325
0. 288 0.429 0.196 1.524 0.286 5.328
Hall Size 0.286 0.
325
0. 432 0.286 0.392 1.721 0.325 5.295
Photography 0.143 0.
107
0.144 0.286 0.098 0.778 0.144 5.402
Catering 0.094 0.
162
0.072 0.143 0.294 0.765 0.143 5.349
Decoration 0. 143 0.
081
0.144 0.047 0.098 0.513 0.098 5.234
Eq. (4-6) are used for the following calculation:
λmax =5.328 + 5.295 + 5.402 + 5.349 + 5.234 5
=5.321 Consistency Index (CI) = λ max − 𝑛
n−1 = 5.321−5
5−1 = 0.08025 Consistency ratio (CR) =CI
𝑅𝐼 =0.08025
1.12 = 0.07165 CR= 0.071 < 0.10
Table 4.2.1.10: Ratio Index
n 1 2 3 4 5 6 7 8 9 10
RI 0.00 0.00 0.58 0.90 1.12 1.24 1.32 1.41 1.45 1.49
4.2.2 Generic Feature Extraction Approach
Here, we have taken a dataset which is shown in Table 4.2.2.1 where the value of Photography Service is calculated as 500/6380 where 6380 is the total number of
customers and 500 is the total number of customers who have taken the Photography Service from C1. The average Term Frequency (TF) of Photography Service is 0.107 shown in Table 4.2.2.4 which provides its actual weight.
Table 4.2.2.1: Customer Getting Services from C1 (6380 Customers in 2018) Attributes Budget
Planning Service
Hall size Service
Photography Service
Catering Service
Decoration Service Attribute’s
Density
900 450 500 500 538
Term Frequency
0.141 0.071 0.0783 0.0783 0.084
Table 4.2.2.2: Customer Getting Services from C2 (8320 Customers in 2018) Attributes Budget
Planning Service
Hall size Service
Photography Service
Catering Service
Decoration Service Attribute’s
Density
768 230 700 768 780
Term Frequency 0.092 0.028 0.084 0.092 0.094
Table 4.2.2.3: Customer Getting Services from C3 (5040 Customers in 2018) Attributes Budget
Planning Service
Hall size Service
Photography Service
Catering Service
Decoration Service Attribute’s
Density
200 600 800 800 920
Term Frequency 0.040 0.119 0.159 0.159 0.182
©Daffodil International University 21 Table 4.2.2.4: Root-Level Attributes‟ Weight Calculation
Attributes Budget
Planning Service
Hall size Service
Photography Service
Catering Service
Decoration Service Attribute’s
weights
0.091 0.073 0.107 0.109 0.120
Table 4.2.2.5:Table 7: Dataset for Different Companies Providing Services to the Customers (Year 2019)
Company Budget
Planning Service
Hall size Service
Photography Service
Catering Service
Decoration Service
C1 750 1600 400 500 100
C2 350 1400 500 300 500
C3 1200 1000 300 400 400
Table 4.2.2.6:Transformation of Evaluation Grades into Numerical Values
E1 E2 E3 E4 E5 E6 E7 E8 E9 E10 E11 E12 E13 E14 E15 E16 E17 E18 E19 E20
0.05 0.1 0.15 0.2 0.25 0.3 0.35 0.4 0.45 0.5 0.55 0.6 0.65 0.7 0.75 0.8 0.85 0.9 0.95 1.0
Table 4.2.2.7: System input acquisition
Company Budget
Planning Service
Hall size Service
Photography Service
Catering Service
Decoration Service
C1 E12 , 1 E20 , 1 E16 , 1 E20 , 1 E4 , 0.2 C2 E5 , 0.25 E17 , 1 E20 , 1 E12 , 0.6 E20 , 1 C3 E20 , 1 E12 , 1 E12 , 0.6 E16 , 1 E16 , 1
Table 4.2.2.8:Rules set up for knowledgebase Construction
Rule No. Antecedent Consequence
1. if (E5,0.25) then (E5, 0.1), (E4 ,0.75), (E3, 0.15) 2. if (E12,0.6) then (E16, 0.15), (E12 ,0.8), (E15 ,0.05) 3 if (E4,0.2) then (E5, 0.7), (E4 ,0.2), (E3 ,0.1) 4. if (E12,0.6) then (E11, 0.25), (E12 ,0.5), (E10 ,0.25) 5. if (E17,0.3) then (E16, 0.3), (E17 ,0.5), (E13 ,0.2) 6. if (E16,0.7) then (E17, 0.2), (E16 ,0.7), (E18 , 0.1) 7. if (E12,0.9) then (E10, 0.1), (E12 ,0.8), (E18 ,0.1) 8. if (E16,0.75) then (E19, 0.15), (E16 ,0.6), (E15 ,0.25)
E12, 0.6= (E16, 0.15), (E12, 0.8), (E15, 0.05)
= (0.8*0.15) + (0.6*0.8) + (0.75*0.05) = 0.638
Table 4.2.2.9: Initial Input transformation with incomplete information
Company Budget
Planning Service
Hall size Service
Photography Service
Catering Service
Decoration Service
C1 0.6 1 0.8 1 0.2
C2 0.25 0.85 1 0.6 1
C3 1 0.6 0.6 0.8 0.8
Table 4.2.2.10:Final Input transformation
Company Budget
Planning Service
Hall size Service
Photography Service
Catering Service
Decoration Service
C1 0.6 1 0.8 1 0.23
C2 0.2 0.85 1 0.638 1
C3 1 0.6 0.638 0.8 0.8
©Daffodil International University 23 Attributes’ minimum value is representing in the Table 4.2.2.11 using Eq. (15).
Table 4.2.2.11:Attributes’ minimum value calculation
Company Budget
Planning Service
Hall size Service
Photography Service
Catering Service
Decoration Service
C1 0.6 1 0.8 1 0.23
C2 0.2 0.85 1 0.638 1
C3 1 0.6 0.638 0.8 0.8
Min 0.2 0.6 0.638 0.638 0.23
Attributes’ Feature Extraction is representing in the Table 4.2.2.12 using Eq. (16).
Table 4.2.2.12: Attributes’ Feature Extraction
Company Budget
Planning Service
Hall size Service
Photography Service
Catering Service
Decoration Service
C1 0.4 0.4 0.162 0.362 0
C2 0 0.25 0.362 0 0.77
C3 0.8 0 0 0.162 0.57
Attributes’ Utility Calculation is representing in the Table 4.2.2.12 using Eq. (18).
Table 4.2.2.13:Alternatives' Utility Calculation
Company Budget
Planning Service
Hall size Service
Photography Service
Catering Service
Decoration Service
Utility
C1 0.0364 0.0292 0.0173 0.0476 0 0.1305
C2 0 0.01825 0.0387 0 0.0924 0.14935
C3 0.0728 0 0 0.0258 0.0684 0.167
To select the best event management company, we have found the maximum utility shown in Table 4.2.2.13 which is C3=0.167 is considered as the maximum utility in this experiment states that C3 is the best event management company.
Figure 4.2.2.1: Selection Performance Evaluation
From the above graph Figure 4.2.2.1, it becomes clear that C3 utility is higher than all the rest alternatives. That’s why, C3 is selected as the best event management company.
To visualize the exactness of our proposed methodology, a comparative evaluation between the systems obtained result and established benchmark result is presented in the Table 4.2.2.14 and Figure 4.2.2.2.
Table 4.2.2.14:A cross-validation between experimental results and benchmark results
Company System
Obtained Results
Benchmark Results System Inference
HR at Company Inference
C1 0.1305 0.1402
C3 C3
C2 0.14935 0.16453
C3 0.167 0.1802
0.1305 0.14935 0.167
0 0.05 0.1 0.15 0.2
C1 C2 C3
Performance Scores
Candidates
©Daffodil International University 25 Figure 4.2.2.2:Graphical representation of cross-validation between experimental results and
benchmark results
4.3 Discussion
In this paper, we have proposed a framework using AHP and Generic Feature Extraction Approach which is the most suitable method when analyzing the complex problem and take a convenient decision. For this reason, we have used these methods to evaluate and rank the event management companies.
0.1305 0.14935 0.167
0.1402 0.16453 0.1802
System Obtained Results Benchmark Results
CHAPTER 5
Conclusion and Future Work
5.1 ConclusionIn this paper we have used AHP and Generic Feature Extraction Method to organize and analyze the complex decision and find the best possible options for selecting the best event management company and help customers find the suitable event management company according to their own criteria in a ranking basis. Here for making the decision, we need features which fetch from the inputs given by the decision makers. Using AHP method we get the consistency ratio which is the most important measurement of the results from pairwise comparison and after checking consistency ratio is 0.071 which is less than 0.10 which proves that the whole hierarchical construction of our proposed problem has full acceptable consistency at all levels and the decision of the decision-makers are consistent. To get the optimal result under the risk and uncertainty we use Feature Extraction Approach which is competent enough to make decisions. From doing the numerical experiment of using the feature extracting method we get the utility of an alternative is calculated and rank the alternatives and all the related things of this experiment are collected from the domain expert.
5.2 Future Work
In this paper, we have proposed a mathematical framework but in future, we will try to implement it programmatically. But all of the underlying methodological and experimental analysis aside, our long-term motive is to design an online system which will provide the customers best possible solutions and rank them according to their own requirements.
©Daffodil International University 27
References
[1] M. S. U. S. H. M. S. I. Md Zahid Hasan, "A Generic Feature Extraction Approach for Dealing,"
Engineering, Technology & Applied Science Research , vol. 10, no. 3, pp. 5775-5783, 2020.
[2] a. C. L. K. Rubayet Karim, "Machine Selection by AHP and TOPSIS Methods," American Journal of Industrial Engineering, vol. 4, no. 1, pp. 7-13, 2016.
[3] A. H. S. C. M. S. K. Dipika Pramanik, "Resilient supplier selection using AHP-TOPSIS-QFD under a fuzzy," International Journal of Management Science and Engineering Management, vol.
12, no. 1, pp. 45-54 , 2016.
[4] A. N. Z. Jasmine J. Lim*, "A DEA approach for Supplier Selection with AHP and Risk Consideration," IEEE International Conference on Big Data (Big Data), pp. 3749-3758, 2016.
[5] E. H. Ö. a. T. E. Neşet Bedir1, "Course Selection with AHP & PROMETHEE Methods for Post Graduate," International Conference on Industrial Engineering and Applications (ICIEA 2016), vol. 68, p. 7, 2016.
[6] B. Oztaysi, "A decision model for information technology selection using AHP," Knowledge- Based Systems, vol. 70, pp. 44-54, 2014.
[7] A. Soltani and E. Zargari Marandi, "HOSPITAL SITE SELECTION USING TWO-STAGE FUZZY MULTI-CRITERIA DECISION MAKING," Journal of Urban and Environmental, vol.
5, no. 1, pp. 32-43, 2011.
[8] S. A. M. R. H. S. E. F. a. M. A. Q. Shameem Ahmed*, "A comparative decision-making model for sustainable end-of-life vehicle management alternative," International Journal of Sustainable Development & World Ecology, 2015.
[9] V. J. •. A. K. S. •. S. S. •. N. T. •, "Supplier selection using fuzzy AHP and TOPSIS: a case study,"
Neural Comput & Applic, 2016.
[10] S. A. a. R. R. M. R. Rohit Singh, "A Kano model, AHP and TOPSIS," International Journal of Quality &, vol. 37, no. 6/7, pp. 837-851., 2020.
A-DECISION-MAKING-APPROACH-FOR- SELECTING-AN-EVENT-MANAGEMENT- COMPANY
ORIGINALITY REPORT
20 % 12 % 16 % 7 %
SIMILARITY INDEX INTERNET SOURCES PUBLICATIONS STUDENT PAPERS
PRIMARY SOURCES
"Multi-attribute Decision Making Approach for
6 %
1
Waste Bin Site Selection Problem: A case study
in Dhaka City", 2020 11th International
Conference on Computing, Communication and
Networking Technologies (ICCCNT), 2020
Publication
Submitted to Daffodil International University
2 %
2
Student Paper