August, 2023
Digital Literacy and Access to Public Services in Rural
Households of Bangladesh
Findings from the 2021 Cross-Sectional Household Survey of Rural Bangladesh
Yasin Shafi
i Summary
BRAC Institute of Governance and Development (BIGD) developed a cross-sectional household survey of rural households in Bangladesh titled “Digital Literacy and Access to Public Services”.
The survey collected data on digital access, digital skills, and use of digital public services of households in rural Bangladesh. The first round of the survey was conducted in 2019 and the second round was conducted in 2021. In the first round, 6493 households were surveyed across eight divisions. In the second round, 5944 of the same sample were interviewed. This report presents the findings based on the second round of the survey. It also contains highlights of the 2019 survey and some sections that present a comparative discussion based on the findings of the two rounds.
In the 2021 survey, from every household, we interviewed at least one most digitally able person (MDAP1). The MDAP 1 n was nominated by the household members. We collected data on this person’s digital access and digital skills along with information on the household. We also collected household-level data on the use of 31 digital services—majority of which are provided by the government.
We found that a very high share of the households’ MDAP1s had access to a mobile phone;
however, access to internet-enabled phones and internet in general is still low. A moderate share of the MDAP1s have lower order digital skills like reading or sending a message, but a small share of them have relatively higher order digital skills needed to use internet-based applications and find specific information from the internet.
From the analysis of the data from two rounds, we see that the MDAPs present in both rounds were more likely to gain more access and skills over time. Among the MDAPs who were present in both rounds of the survey, access to smartphone and internet and the ability to send emails and find information from the internet increased from 2019 to 2021.
If the service requires an intermediary, regardless of the level of digital literacy, MDAP1s or the household members go to formal intermediaries like UDC (Union Digital Centre) or Union Parishad. But if the service offered does not involve an intermediary by design, MDAP1s with higher order digital literacy are likely to use the service by themselves, and those with lower levels of digital literacy are likely to go to informal intermediaries like local computer or mobile shops.
2 Contents
Summary ... i
1 Introduction ... 5
1.1 Research Objectives ... 5
1.2 Method ... 5
1.3 Sampling ... 7
2 Reviewing Key Findings from the 2019 Survey ... 8
3 Findings from the 2021 Survey ... 10
3.1 Insights on Households ... 10
3.2 Most Digitally Able Person (MDAP): Who are they? ... 11
3.2.1 Gender ... 11
3.2.2 Age ... 12
3.2.3 Education ... 13
3.2.4 Literacy Status ... 13
3.3 Digital Literacy ... 14
3.3.1 Digital Access... 14
3.3.2 Digital Skills ... 15
3.3.3 Examining Digital Divide ... 17
3.4 Digital Services ... 19
3.4.1 Does Digital Access Predict Self-use of Digital Services? ... 23
3.4.2 Do Digital Skills Predict Self-use of Digital Services?... 24
3.4.3 The relation between digital literacy and self-use of selected services ... 25
3.5 Most Used Modes of Accessing the Service ... 26
4 Comparison between 2019 and 2021 ... 29
4.1 Digital Literacy Comparison ... 29
4.2 Panel Regression of Selected Services: Does Digital Literacy Predict Self-use of Digital Services Across Two Rounds? ... 30
5 Discussion on the Findings ... 34
5.1 What do the findings mean for Government Digital Services in general? ... 35
6 Conclusion ... 38
References ... 39
3 Tables
Table 1: Two Rounds of Digital Literacy and Access to Public Services ... 6
Table 2: Availability of the 2019 MDAP ... 11
Table 3: New MDAP 1s ... 12
Table 4: Literacy Status of MDAP 1s ... 13
Table 5: Communication Skills of MDAP 1s ... 16
Table 6: Types of Services that have been selected for this report ... 20
Table 7: Data on Selected Services ... 22
Table 8: Mode of Accessing Birth Registration ... 23
Table 9: LPM with Birth Registration, National ID, Social Safety Net, and Old Age Allowance as Dependent Variables with Digital Access Independent Variables ... Error! Bookmark not defined. Table 10: LPM with Exam Registration Online, Checking Exam Results Online, Electricity Bill, Mobile Banking, and COVID-19 Vaccine Registration as Dependent Variables with Digital Access Independent Variables Error! Bookmark not defined. Table 11: Contingency Table of Computer Use and Old Age Allowance ... Error! Bookmark not defined. Table 12: LPM with Birth Registration, National ID, Social Safety Net, and Old Age Allowance as Dependent Variables with Digital Skills Independent Variables ... Error! Bookmark not defined. Table 13: LPM with Exam Registration Online, Checking Exam Results Online, Electricity Bill, Mobile Banking, and COVID-19 Vaccine Registration as Dependent Variables with Digital Skills Independent Variables ... Error! Bookmark not defined. Table 14: Contingency Table of Making Calls Using Apps and National ID Registration Error! Bookmark not defined. Table 15: Contingency Table of Sending Messages with Checking Result Online and Mobile Banking ... 25
Table 16: Contingency Table with Checking Exam Result Online, COVID-19 Vaccine Registration, and Social Safety Net Related Services with Digital Literacy Variables ... Error! Bookmark not defined. Table 17: Contingency Table with COVID-19 Vaccine Registration with Other ServicesError! Bookmark not defined. Table 18: Most Popular Modes of Accessing the Services... 27
Table 19: Households that used the services in both 2019 and 2021 ... 30
Table 20: Panel Regression with Mobile Banking, Electricity Bill Payment, Birth Registration, and Checking Exam Result Online as Dependent Variables ... 32
Table 21:MDAP 1 Action as a Result of the Requirement of Intermediary and Digital Literacy of MDAP 1 ... 35
Figures Figure 1: Percentage of MDAPs with Access to Digital Devices and Internet Connectivity in 2019 ... 8
Figure 2: Communication Skills of MDAPs in 2019 ... 9
Figure 3: Information Skills in 2019 ... 9
Figure 4: Distribution of Household Size ... 10
Figure 5: Distribution of Household Income ... 10
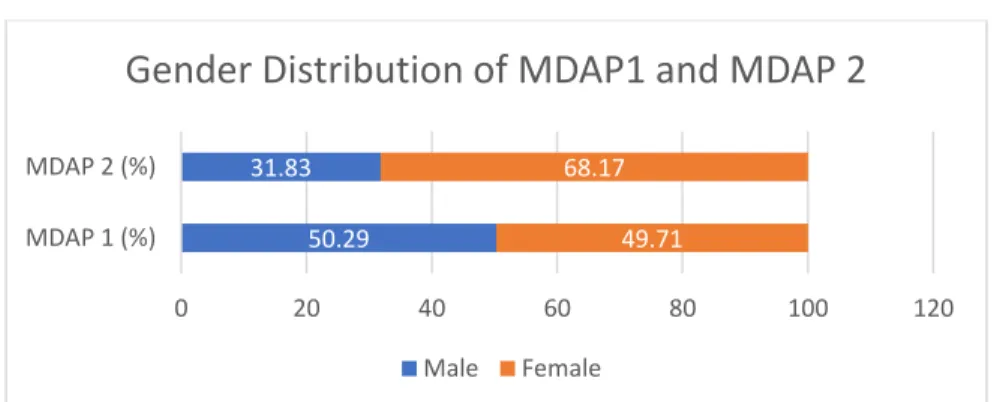
Figure 6: Gender Distribution of MDAP 1s and MDAP 2s ... 12
Figure 7: Age Distribution of MDAP 1s ... 12
Figure 8: Education Status of MDAP 1s ... 13
Figure 9: Mobile Phone Use and Ownership and Smart/Touchphone Use of MDAP 1s ... 14
Figure 10: Internet Use of MDAP 1s ... 15
Figure 11: Computer Use of MDAP 1s ... 15
Figure 12: Percentage of MDAP 1s who can find specific information related to passport from internet ... 16
Figure 13: Internet Use Across Range of Household Income ... 18
Figure 14: Whether MDAP 1 can Send Messages across Ranges of Household Income ... 18
Figure 15: Information Skills across Ranges of Household Income ... 19
Figure 16: Awareness of Government Digital Services ... 20
Figure 17: Comparison of Digital Access in 2019 and 2021 ... 29
4
Figure 18: Comparison of Digital Skills in 2019 and 2021 ... 30
5 1 Introduction
The government is responsible for providing important services to people that private sector usually does not. The traditional service delivery would consist of an individuals completing the processes in-person to avail a service. With the advent of digital technology, governments are transitioning to providing many of these services digitally. As states try to modernize their administration and service delivery, the concept of e-governance and digital services are becoming more popular. Digital services are expected to reduce corruption and lead the services directly to their beneficiaries more effectively.
The Government of Bangladesh transitioned 761 services to a digital modality.1 In this report, we will refer to these government services and selected non-government services that are provided online, fully or partially, as “digital services”. Like any other service, the efficacy of digital service delivery depend on both demand and supply sides—on the supply side, the quality of service delivery and on the demand side, whether the potential users subscribe to and use the services digitally.
This study focuses on the demand side of digital services. In 2019, BRAC Institute of Governance and Development (BIGD) conducted a nationwide household-level survey in rural Bangladesh titled “Digital Literacy and Access to Public Services in Bangladesh”. In 2021, BIGD conducted another round of the survey with the same sample. Both these surveys aimed to assess how accessible digital devices are, what degree of digital literacy the most digitally able person (MDAP) of the households has, and whether these households are accessing the services
digitally. The findings from the 2019 survey were published in the BIGD Working Paper No. 63 in December 2020. This report mainly shares the findings of the survey conducted in 2021.
1.1 Research Objectives
The core objective of this research is to investigate relationship between digital literacy and the use of public services digitally. To study this relation, we address the following research
questions:
- How much access do people have to digital devices and internet connectivity?
- What is the level of digital literacy of people who have access to necessary devices and connection?
- How are people accessing the government services? If accessing digitally, are they accessing the services by themselves or with the help of intermediaries?
- Are people with access to digital device and connectivity and digital skills more likely to access the services digitally by themselves?
1.2 Method
1 The Daily Star. (2022, July 14). Many digital services exist just in name: Finds a govt study. Retrieved from The Daily Star: https://www.thedailystar.net/news/bangladesh/news/many-digital-services-exist-just-name-3069566
6
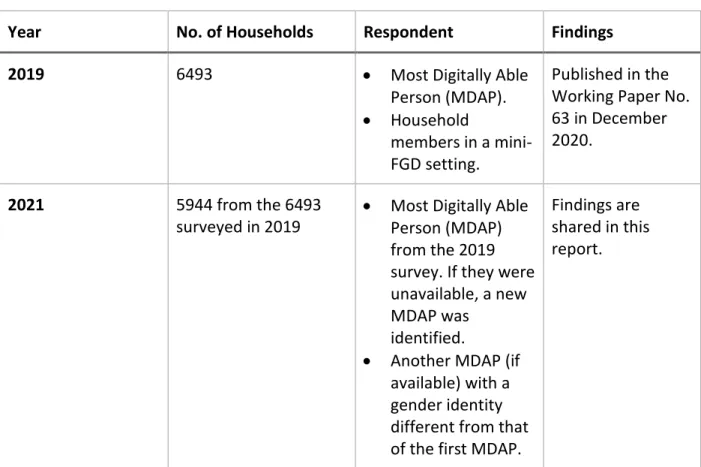
Survey Design: “Digital Literacy and Access to Public Services” is a cross-sectional household survey of rural households in Bangladesh. In 2019, the survey was administered in a mini focus group discussion (FGD) in each household to measure the digital literacy and access to public services at the household level. The team conducted mini FGDs instead of collecting responses of one respondent to collect data on different services different household members need. The household members identified the individual who is the most adept at using digital devices.
This person was recorded as the most digitally able person (MDAP). Data on the digital literacy of the MDAP of each household was collected since this person possessed the highest level of digital literacy in the household. The household members, along with the MDAP, responded about the services accessed by the household.
In 2021, the same sample was surveyed. Like 2019, responses were collected through mini focus group discussion with the household members. However, there was an attrition - the research team did not find some households, and some households did not consent to take part in the second round of the survey. In the households that participated in the second round, the MDAP identified in the 2019 survey was interviewed. If they were not available, a new MDAP was identified. This MDAP is referred to as MDAP 1 in this report. Additionally, a second MDAP was interviewed who identified themselves with a gender different from that of the 2019 MDAP in the same household. This MDAP is referred to as the MDAP 2 in this report.
Table 1: Two Rounds of Digital Literacy and Access to Public Services
Year No. of Households Respondent Findings
2019 6493 Most Digitally Able
Person (MDAP).
Household
members in a mini- FGD setting.
Published in the Working Paper No.
63 in December 2020.
2021 5944 from the 6493
surveyed in 2019
Most Digitally Able Person (MDAP) from the 2019 survey. If they were unavailable, a new MDAP was
identified.
Another MDAP (if available) with a gender identity different from that of the first MDAP.
Findings are shared in this report.
7 1.3 Sampling
The sampling was done for the survey in 2019. In 2021, the same sample was resurveyed. The sampling technique of the 2019 survey is described below.
Site Selection: The survey sampling was designed to be nationally representative of rural Bangladesh as well as rural areas of each of the eight administrative divisions of the country:
Barisal, Chattogram, Dhaka, Khulna, Mymensingh, Rajshahi, Rangpur, and Sylhet. Each division represented one stratum.
Sample Size: In 2019, the sample size for each division or stratum was estimated to be 806.4 households, i.e., 6,451 households across the eight divisions. The research team used the Integrated Multi-Purpose Sample (IMPS) designed by the Bangladesh Bureau of Statistics (BBS) to select the list of Primary Sampling Units (PSUs). Using stratified random sampling, the research team selected 325 PSUs out of the 1077 PSUs in rural areas of Bangladesh, based on population proportional to size using Population and Housing Census 2011. Then they used systematic random sampling to select 20 households within each PSU. Thus the sample size ended up to be 6500 households (325 PSUs x 20 Households).
In 2019, researchers were able to collect data from 6493 households. In 2021, we approached these 6,493 households and found 5,944 households who consented to participate in the survey.
Selection of Services: The e-portal of the Government of Bangladesh
(https://services.portal.gov.bd/) lists more than 600 digital services of various government organizations. After a consultation with Access to Information (a2i) in 2019, we decided to exclude services related to information provision and internal administration, which narrowed the list down to 44 digital services. Based on our experience in 2019, we saw that some of these services had little uptake. Hence, for the 2021 round, we curtailed the list further to survey on 31 services related to eight categories: identification, social safety net program, basic utility, education, financial transaction, business, health, and non-essential services.
8 2 Reviewing Key Findings From the 2019 Survey
Before presenting the findings from the 2021 survey, we highlight some of the key findings from the 2019 survey in this section. We select the findings that are interesting in the context of 2021 survey.
We start with access to digital devices and internet connectivity. In 2019, almost all of the MDAPs (95.84%) had access to mobile phones. However, the use of internet enabled phones (smart/touch phones) and use of internet were low (41.09% and 37.01% respectively). The use of computer among the MDAPs was very low (8.35%).
Figure 1: Percentage of MDAPs With Access to Digital Devices and Internet Connectivity in 2019
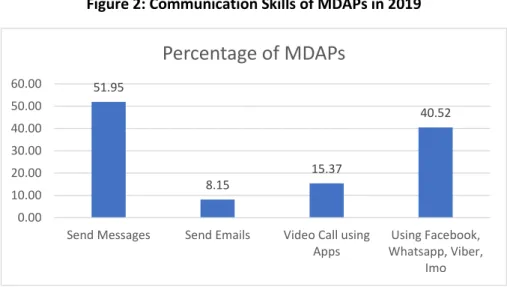
To explore the digital skills of the MDAPs, we focus on two sets of skills. Communication skills denote the ability to communicate using digital means, and information skills refer to the ability to find specific information using digital devices and the internet. In 2019, a little more than half of the MDAPs (51.95%) reported that they could send messages using a mobile phone. Almost 40% reported using media like Facebook, WhatsApp, Viber, or Imo. Low to very low share of MDAPs indicated that they could make video calls using apps or send emails (15.37% and 8.15% respectively).
95.84
41.09
37.01
8.35 0.0
20.0 40.0 60.0 80.0 100.0 120.0
Mobile Use Smartphone Use Internet Use Computer Use
Percentage of MDAPs
9
Figure 2: Communication Skills of MDAPs in 2019
Very low percentage of MDAPs were able to use the internet to find information related to passport forms (11.58%), passport fee (12.35%), and the passport office hotline (12.55%). Those who could do either of the tasks were more likely to be able to do the other two a well.
Figure 3: Information Skills in 2019
51.95
8.15
15.37
40.52
0.00 10.00 20.00 30.00 40.00 50.00 60.00
Send Messages Send Emails Video Call using Apps
Using Facebook, Whatsapp, Viber,
Imo
Percentage of MDAPs
11.58
12.35
12.55
11.00 11.20 11.40 11.60 11.80 12.00 12.20 12.40 12.60 12.80
Can access passport forms Can find information on passport fee
Can find passport office hotline
Percentage of MDAPs
10 3 Findings From the 2021 Survey
3.1 Insights on Households
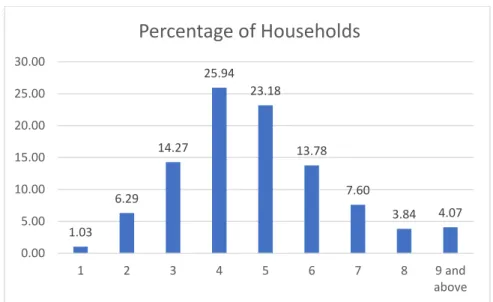
Since the survey is at the household-level, we start with some basic information of the households. In the 2021 survey, the household size ranged from 1 to 17 members.
Figure 4: Distribution of Household Size
The average household size is 4.84. If we arrange the households according to their size, the middle 50% of the households have 4-6 members; this indicates that typically we will see 4-6 members in the households of this survey.
Figure 5: Distribution of Household Income
Looking at the monthly income, we can see that 60.55% of the households, on average, earn 15000 BDT or less per month. According to the Household Income and Expenditure Survey
1.03 6.29
14.27 25.94
23.18
13.78 7.60
3.84 4.07 0.00
5.00 10.00 15.00 20.00 25.00 30.00
1 2 3 4 5 6 7 8 9 and
above
Percentage of Households
7.74
28.65
24.87
16.24
8.24
5.34
2.37
6.55
0.00 5.00 10.00 15.00 20.00 25.00 30.00 35.00
Percentage of Household Income
11
(HIES) 2016, the average national monthly household income is 15988 BDT. This means that at least 60.55% of the households in the sample earn less than the national average of
Bangladeshi household income according to the HIES 2016.2 The median income fall in the interval of 10001 to 15000. 16.05% earn between 15000 and 20000 BDT and 8.14% earn between 20000 and 25000 BDT.
3.2 Most Digitally Able Person (MDAP): Who are they?
Of the 6493 households, which were interviewed in 2019, 5944 could be traced that also consented to take part in the 2021 survey. In 2019, the household members in the mini-FGD style interview setting identified the most digitally able person (MDAP) of the household. This person was supposed to be the most skilled user of digital devices and services. In 4196 of these 5944 households, the MDAP from the 2019 round was available, and in 1914 households, they were not available. In the households that consented but did not have the 2019 MDAP, a new MDAP was identified. Hence, the overall demographic traits of the MDAPs may vary from those of 2019 MDAPs.
Table 2: Availability of the 2019 MDAP
2019 MDAP was available
Consented to Participate
Percentage 69.77
Number 4147
3.2.1 Gender
In 2019, 63.09% MDAPs were male and the rest were female. Because almost two-thirds were male, in this round, we asked the households to identify one more MDAP who did not identify with the gender of the first MDAP, if available. If the first MDAP (referred to as MDAP1
hereafter) was male, the second MDAP (referred to as MDAP2 hereafter) was female, and vice- versa . We did it with the hope that it would help us gain more insights into the female MDAPs of the households. Of the 5944 households that we found and consented to participate, 3179 identified a second MDAP. Both MDAP1 and 2 were interviewed on the same modules.
However, since 1797 of the consenting households did not have 2019 MDAP available, we had to identify a new MDAP 1. Of the 1797 new MDAP1s, 33% were male and 67% were female. As a result, in 2021, we have 50.29% male and 49.71% female MDAP1s overall.
2Bangladesh Bureau of Statistics (BBS). (2017). Household Income and Expenditure Survey 2016. Government of the People's Republic of Bangladesh.
12
Table 3: New MDAP 1s Female Percentage 67.00 Number 1204
Of MDAP 2s, 68.17% were female. This indicates that in the households where MDAP 1 was a male, it was more likely that a female MDAP 2 was identified; however in households where a female MDAP 1 was identified, it was less likely to identify a male MDAP 2.
Figure 6: Gender Distribution of MDAP 1s and MDAP 2s
Since the 2021 edition has an almost equal distribution of male and female in the MDAP1s, we focused on using the MDAP1 responses only. Although we collected data from MDAP2s when they were available, we used data from MDAP1s in this report to keep the discussion relatively more simple.
3.2.2 Age
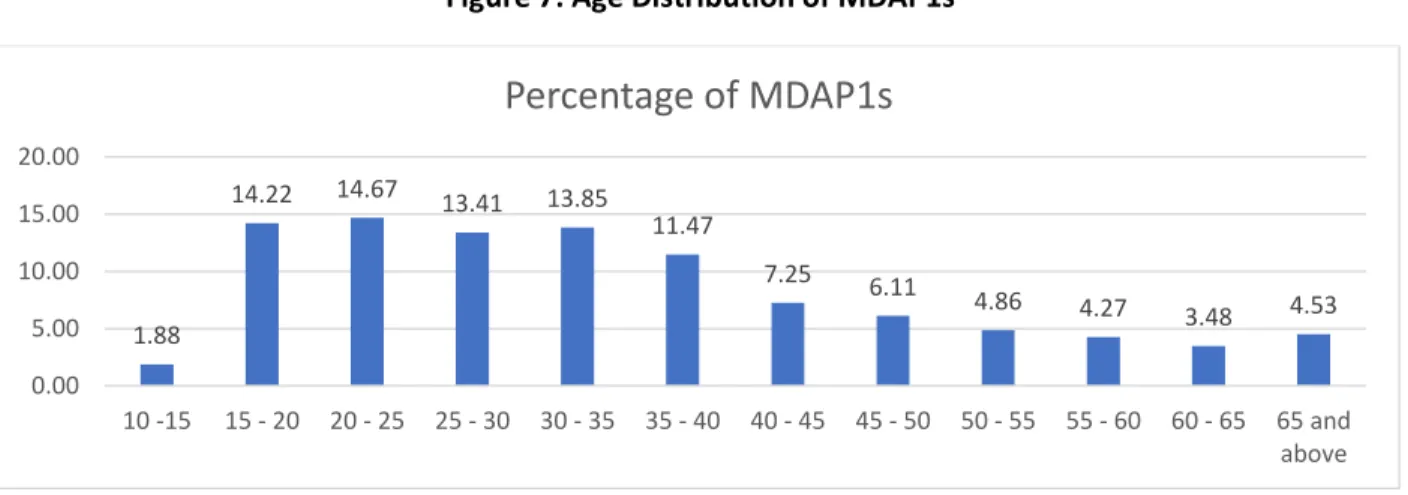
Figure 7: Age Distribution of MDAP1s
The average age of the MDAP1s is 35.83 years. The age of the MDAP1s range from 12 to 90 years. The interquartile range extends from 24 to 45, which means that the middle 50% of the
50.29 31.83
49.71 68.17
0 20 40 60 80 100 120
MDAP 1 (%) MDAP 2 (%)
Gender Distribution of MDAP1 and MDAP 2
Male Female
1.88
14.22 14.67 13.41 13.85
11.47
7.25 6.11 4.86 4.27 3.48 4.53
0.00 5.00 10.00 15.00 20.00
10 -15 15 - 20 20 - 25 25 - 30 30 - 35 35 - 40 40 - 45 45 - 50 50 - 55 55 - 60 60 - 65 65 and above
Percentage of MDAP1s
13
MDAP 1s are in this age range. The median age is 33, which indicates that 50% of MDAP 1s are aged 33 years or younger.
3.2.3 Education
One-fifth (19.97%) of the MDAP1s never went to school or did not complete the primary-level education; 23.40% had primary level and 18.44% had junior level of education. Another 21.43%
had secondary level of education or passed SSC or equivalent exam, and 11.47% had higher secondary level of education or passed HSC or equivalent exam. Very few MDAP1s (4.71) had undergraduate level education or higher. A very small share (0.57%) received non-formal religious education that is represented by the ‘other’ category. Median MDAP1 has Junior level (grade 6 to grade 8 equivalent) education. The middle 50% of the MDAP1 ranged from primary to the secondary level.
Figure 8: Education Status of MDAP 1s
3.2.4 Literacy Status
Table 4: Literacy Status of MDAP 1s Literacy Status MDAP 1
Percentage
Can read and write 73.70
Neither 20.54
Can read only 0.98
Knows numbers only
4.78
19.97
23.40
18.44
21.43
11.47
4.71
0.57 0.00
5.00 10.00 15.00 20.00 25.00
Less than Primary
Primary Junior Secondary Higher
Secondary
Bachelor's and above
Others
Percentage of MDAP 1s
14
Almost three-quarters (73.70%) of the MDAP1s can read and write, similar to the rate in 2019.
This is also very close to the literacy rate (74.66%) found in the “Population and Housing Census 2022”.3
3.3 Digital Literacy
To investigate the nature of digital literacy of the MDAP1s, data were collected on two dimensions: (a) digital access—access to mobile phone, computer, and the internet, and (b) digital skills. For the purpose of this report, we assess two types of digital skills :
communications skills and information skills. We present the findings on digital access and digital skills of MDAP1s below:
3.3.1 Digital Access
Overall, mobile phone usage is very high among the MDAP1s. However, women are less likely to own a mobile phone than men. While the mobile phone use is high, the use of internet enabled phones (smartphones or touchphones) and use of internet are low. Use of computers, either at home or somewhere else, is very low.
3.3.1.1 Use of Mobile Phone
Figure 9: Mobile Phone Use and Ownership and Smart/Touchphone Use of MDAP1s
Overall, 97.12% of the MDAP1s are mobile phone users, but 84.12% own a mobile phone. While almost 98% male and 97% female MDAP 1s use mobile phone, when it comes to ownership, male MDAP 1s are more likely (93.28%) to own a mobile phone than the females (74.86%).
Overall, the smartphone ownership is low (almost 42%). Male MDAP 1s are more likely (43.73%) to own a smartphone than females (40.17%).
3.3.1.2 Use of Internet
3 The Daily Star. (2022, July 27). Bangladesh’s literacy rate now 74.66%. Retrieved from The Daily Star:
https://www.thedailystar.net/youth/education/news/bangladeshs-literacy-rate-now-7466-3080701 97.12
84.12
41.96
97.69 93.28
43.73 96.55
74.86
40.17
0 20 40 60 80 100 120
Mobile Phone Use Mobile Phone Ownership Smart/Touch Phone Use
Percentage
Overall Male Female
15
Similarly, internet use is also very low (38%) among the MDAP 1s and male MDAP 1s are more likely (42.49%) to use internet than female MDAP 1s (33.50%).
Figure 10: Internet Use of MDAP 1s
3.3.1.3 Use of Computers
Only 2.64% MDAP 1s have a computer at home. 4.29% use computers at the local store or of someone else. In both these cases, male MDAP 1s are more likely to own or use a computer.
Figure 11: Computer Use of MDAP 1s
3.3.2 Digital Skills
We collected data on different aspects of digital skills of MDAP 1s. For the purpose of the report, we categorize the skills into two types. One is communication skills- this denotes the skills required for MDAP 1s to communicate with others using ICT tools; and the other is information skills – it is the set of skills that we use to find specific information using ICT tools.
The findings are presented here. Overall, a low to moderate percentage of MDAP 1s have digital skills. They are more likely to be able to communicate than to find specific information using ICT.
38.02 42.49
33.50
0.00 10.00 20.00 30.00 40.00 50.00
Overall Male Female
Percentage
2.64 4.29
15.38
77.69
4.28 7.16
16.06
72.50
0.98 1.39
14.69
82.94
0.00 10.00 20.00 30.00 40.00 50.00 60.00 70.00 80.00 90.00
Has a Computer at Home Uses Computer at the local store/of someone else
Doesn’t need it Doesn’t know how to use
Percentage
Overall Male Female
16 3.3.2.1 Communication Skills
The communication skills of MDAP1s extend from moderate to low. MDAP1s are more likely to be able to read messages (67.16%) than to send messages (45.66%) using a mobile phone and are more likely to be able to check emails (17.13%) than send (14.87%). Less than half of the MDAP1s can make a call using internet-based apps (42.26%), and a little over one-fourth are on Facebook (26.41%).
Table 5: Communication Skills of MDAP1s
Percentage Frequency MDAP 1 Can Send Messages 45.66 2714 MDAP 1 Can Read Messages 67.16 3992
MDAP 1 Can Check Emails 17.13 1018
MDAP 1 Can Send Emails 14.87 884
MDAP 1 Can Call Using Apps 42.26 2512 MDAP 1 has Facebook
Account
26.41 1570
3.3.2.2 Information Skills
To assess whether the MDAP1s can find specific information using ICT, we asked the MDAP1s to access the passport website of Bangladesh and find some information. Low number of MDAP1s were able to open the passport website and find the information. This indicates that a low percentage of MDAP 1s can use the internet to find information for a specific purpose.
Figure 12: Percentage of MDAP 1s Who Can Find Specific Information Related to Passport From the Internet
18.61 18.66
19.16
18.20 18.40 18.60 18.80 19.00 19.20 19.40
Can access Passport Forms Can find information on Passport Fee
Can find Passport Office Hotline
Percentage
17
Less than one-fifth of the MDAP1s were able to find the passport forms (18.61%), information related to passport fee (18.66%), or the passport office hotline number (19.16%) using the internet.
3.3.3 Examining the Digital Divide
We want to know whether household income has a relation with digital access or digital skills.
To examine this, we choose the use of the internet from the components of digital access, the ability to send messages from the communication skills, and a binary variable for information skills. Information skills here have two values: low and high. If MDAP1 could not complete any of the tasks related to finding information about passport or could complete up to two tasks, we categorized that as low level of information skills. If the MDAP1 could complete three tasks, we categorized that as high level of information skills.
18
Figure 13: Internet Use Across Different Levels of Household Income
Figure 14: Whether MDAP 1 Can Send Messages Across Different Levels of Household Income
From the data, we find evidence of digital divide across intervals of household income. Richer households are more likely to have access to the internet and have MDAP1s who can send messages.
14.73 23.23
33.74
47.80 49.17
61.15 67.63
77.66
0.00 10.00 20.00 30.00 40.00 50.00 60.00 70.00 80.00 90.00
Less than 5000
5000-10000 10001-15000 15001-20000 20001-25000 25001-30000 30001-35000 35001 and above
Percentage
20.44
33.81
44.08
53.98 55.99
65.61 69.06 75.06
0.00 10.00 20.00 30.00 40.00 50.00 60.00 70.00 80.00
Less than 5000
5000-10000 10001-15000 15001-20000 20001-25000 25001-30000 30001-35000 35001 and above
Percentage
19
Figure 15: % of MDAPs with High Information Skills Across Different Levels of Household Income
Richer households are also more likely to have an MDAP1 who has high information skills, but overall the share of MDAP1s with high information skills is low in almost all the intervals.
3.4 Digital Services
As mentioned earlier, the success of the government digital services can depend on both—the demand side and the supply side. This survey largely focuses on the demand side—whether the clients have the necessary skills to access the services. The other side is the supply side. It concerns questions including: what is the quality of the services provided and whether the service provider (in this case, it is the government) has done adequate outreach? Assessing the quality of services is beyond the scope of this study but the survey has data on MDAP1s’
awareness of government digital services.
Of all the MDAP1s, irrespective of the level of digital literacy, a high percentage are aware of government digital services; males are a little more likely (96.29%) to be aware than females (92.72%). This indicates that the outreach has been effective in creating awareness among the citizens about the government digital services.
9.01 12.83 16.43 20.34 19.63 21.66
28.78
36.88
0.00 10.00 20.00 30.00 40.00
Less than 5000
5000-10000 10001-15000 15001-20000 20001-25000 25001-30000 30001-35000 35001 and above
Percentage
20
Figure 16: Awareness of Government Digital Services
Since we know that a high percentage of the MDAP1s are aware that the government services are provided digitally, we are interested to know what percentage of them are actually using these services digitally when needed? To find the answer we collected data on the services and their use. In the 2019 survey round, we collected data on 44 services. Some of the services did not have significant uptake or were not adequately digitalized. Hence, in 2021, we collected data on 31 services. Because we were collecting data during the COVID-19 pandemic, we included COVID-19 vaccine registration as a service in this survey round. We divided the services related to eight categories: identification, social safety net program, basic utility, education, financial transaction, business, health, and non-essential services.
For the purpose of this report, we have selected the digital services that had an uptake of at least 5% of the sample. The selected services according to their types are:
Table 6: Types of Services that have been selected for this report Type of the Service Name of the Service
Identification Birth Certificate Citizenship Certificate National ID
Social Safety Net Related Social Safety Net Allowance Old Age Allowance
96.29
92.72
90.00 91.00 92.00 93.00 94.00 95.00 96.00 97.00
Male Female
Percentage
21
Basic Utility Electricity Bill
Education Related Exam Registration Online Checking Results Online Financial Transaction Mobile Banking
Health Related COVID-19 Vaccine Registration Business Related N/A
Non-essential N/A
First, we look at the share of households who use these services irrespective of the mode, digitally or in-person. No business-related or non-essential service had more than 5% uptake. Of the identification services, birth certificate had the highest uptake (24.83%). This is likely
because birth registration is essential for many other government services. 18.03% of the households had social safety set allowance recipients and 8.09% of the households had old age allowance recipients. Of all the services, electricity bill payment had the highest uptake
(90.39%), followed by COVID-19 vaccine registration (87.30%).
COVID-19 vaccine registration had a higher share of digital users. We included mobile banking as high percentage (73.69%) of the households use this service, although it is not a government service.
The uptake of services, by definition, is determined by the necessity. For example, if a
household does not need a passport, they are not going to avail the relevant service. Similarly, if the parents of a child need a birth registration certificate to enroll the child in a school, they are going to apply for it. Hence, we are not interested in what explains the differences in the uptake of services. We are rather interested in how the households availed the services when they needed them.
Of all the services, high shares of those who availed birth certificate registration, national ID registration, checking exam result online, registering for exam online, and COVID-19 vaccine registration services used the digital mode. This indicates that the services have been digitalized completely or significantly to the extent that most of the users are using them digitally. Mobile banking is a completely digital service. For citizenship certificate, social safety net allowance, old age allowance, electricity bill payment - smaller shares of users indicated that they used them digitally. This indicates that either the services have not been adequately digitalized or they offer both digital and manual use of the service.
The services that had an uptake of more than 5% of the respondents are:
22
Table 7: Data on Selected Services Name of the Service Service
Users (N)
Service Users as percentage of Sample (%)
Users of Digital Service (N)
Users of Digital Service (%)
Used Digital Service by Themselves (N)
Used Digital Service by Themselves (%)
Birth Certificate 1476 24.83 1434 97.15 8 0.54
Citizenship Certificate 412 6.93 214 51.94 0 0
National ID 628 10.57 561 89.33 8 1.27
Social Safety Net Allowance
1072 18.03 695 64.83 47 4.38
Old Age Allowance 481 8.09 314 65.28 3 0.62
Checking Online Exam Result
790 13.29 785 99.37 520 65.82
Online Exam Registration
341 5.74 329 96.48 106 31.09
Electricity Bill 5373 90.39 2391 44.5 298 5.55
COVID-19 Vaccine Registration
5189 87.30 5126 98.77 506 9.75
Mobile Banking 4380 73.69 N/A N/A 451 10.3
But what does accessing a service digitally look like? A noteworthy finding is that when we asked the participants how they availed the service, many said that they availed the service digitally but not by themselves. They sought help from an intermediary, for a fee or free. Upon deeper enquiry, we see that even though many use identification or social safety net related services digitally, very few mentioned using it by themselves. For these services, people sought help from intermediaries. In comparison, the other services had higher shares of digital users who used the service by themselves.
For example, 99.51% of the MDAP1s who said that they did the birth registration digitally went to an intermediary. Only 0.49% responded that they did it digitally themselves. This shows that when the respondents say that they availed a service digitally, it does not necessarily imply that
23
they did it using their own digital literacy or device. In most cases, because they know that the process has been digitalized, they responded that they availed the service digitally.
Table 8: Mode of Accessing Birth Registration Intermediary Respondents
Themselves
Manual 97.30 2.70
Digital 99.51 0.49
Don't Know 1.00 0.00
We find it reasonable to assume that it is possible to seek help from an intermediary without any digital literacy as intermediaries generally complete the process from start to the end. Since we are interested in the relationship between digital literacy and access to digital services, we want to see whether having digital literacy results in respondents availing the services digitally by themselves. In order to investigate the relation, we run two sets of regression models. In the first set we include components of digital access as independent variables, and we use the components of digital skills in the second.
We do not run regression for identification and social safety related services since they have very few users who had availed them digitally without an intermediary. Regression models for these services would not give us meaningful results. We run regression for digital services that had at least 5% users who availed them by themselves. By this criteria, the eligible services are:
Checking Exam Results Online, Online Exam Registration, Electricity Bill, Covid-19 Vaccine Registration, and Mobile Banking.
3.4.1 Does Digital Access Predict Self-Use of Digital Services?
The dependent variable is binary: the value is 1 if the respondent accessed the service digitally themselves and 0 if they went to an intermediary. Thus we run a linear probability model for each regression. The independent variables are demographic dimensions including age, gender, and education of the MDAP1 and digital access dimensions including digital literacy, ownership of smart phone, access to computer, and the internet. We control for household income.
The equation for the regression is:
𝐷𝑖𝑔𝑖𝑡𝑎𝑙𝑙𝑦𝐴𝑐𝑐𝑒𝑠𝑠𝑖𝑛𝑔𝑆𝑒𝑟𝑣𝑖𝑐𝑒𝑠𝑏𝑦𝑇ℎ𝑒𝑚𝑠𝑒𝑙𝑣𝑒𝑠 = 𝛽0+ 𝛽1∗ 𝑀𝐷𝐴𝑃1𝑎𝑔𝑒 + 𝛽2∗
𝑀𝐷𝐴𝑃1𝑔𝑒𝑛𝑑𝑒𝑟 + 𝛽3∗ 𝑀𝐷𝐴𝑃1𝑒𝑑𝑢𝑐𝑎𝑡𝑖𝑜𝑛 + 𝛽4∗ 𝑆𝑚𝑎𝑟𝑡𝑃ℎ𝑜𝑛𝑒𝑈𝑠𝑒 + 𝛽5 ∗ 𝐼𝑛𝑡𝑒𝑟𝑛𝑒𝑡𝑈𝑠𝑒 + 𝛽6∗ 𝐶𝑜𝑚𝑝𝑢𝑡𝑒𝑟𝑈𝑠𝑒 + 𝜖
24
The linear probability models are presented in the Annex A 1. We present the models with and without fixed effects next to each other. Originally, when the sampling was done, 20
households were selected from each of the 325 Mauzas. Hence, we cluster the standard error at the Mauza level. We also assume that there might be differences between the districts which might affect the self-use of digital services. In order to account for these differences, we use districts as the fixed effects variable.
In Annex A 1, we can see that using a smartphone was significant at 10% level (without fixed effects) in predicting higher likelihood of digital payment of electricity bill by self and was significant at 5% level (with fixed effects) in predicting higher likelihood for checking exam results online by self, holding other variables constant. For other services, using a
smartphone/touchphone does not necessarily indicate that the user is accessing those services digitally by themselves. Internet-use was a better predictor of higher likelihood of self-using exam registration online (significant at 1% level with or without fixed effects), mobile banking (significant at 5% level with fixed effects, at 1% without fixed effects) and COVID-19 vaccine registration (significant at 1% level with or without fixed effects). Computer-use was a good predictor of higher likelihood of digital self-use of electricity bill payment (significant at 1% level with or without fixed effects), mobile banking (significant at 1% level with or without fixed effects), and COVID-19 vaccine registration (significant at 1% level with or without fixed effects). Computer-use was also significant for self-registration of exams online (significant at 10% level with fixed effects, at 5% without fixed effects).
3.4.2 Do Digital Skills Predict Self-use of Digital Services?
For the next set of regression models, we have the same dependent variable—self-use of the government digital service. We run a linear probability model. In this set of regression models, instead of smartphone use, internet use, and computer use, we include sending messages, sending emails, calling using apps, using Facebook as independent variables. All of these are binary variables. We also include a variable named ‘Information Skills’ – a variable that has discrete values ranging from 0 to 4. We asked the respondents to find the passport website, the form, and passport-related information to assess their information skills. The ‘Information Skills’ variable in the model takes the number of tasks successfully completed by the
respondent. For example, if a respondent successfully completed one task, the value for this variable will be 1, and if they successfully completed 4 tasks, the value for the variable will be 4.
We present the results of the regression both with and without the fixed effects. We include district as the fixed effects variable. We also cluster the standard errors at the Mauza level.
The equation for the regression is:
𝐷𝑖𝑔𝑖𝑡𝑎𝑙𝑙𝑦𝐴𝑐𝑐𝑒𝑠𝑠𝑖𝑛𝑔𝑆𝑒𝑟𝑣𝑖𝑐𝑒𝑠𝑏𝑦𝑇ℎ𝑒𝑚𝑠𝑒𝑙𝑣𝑒𝑠 = 𝛽0+ 𝛽1∗ 𝑀𝐷𝐴𝑃1𝑎𝑔𝑒 + 𝛽2∗ 𝑀𝐷𝐴𝑃1𝑔𝑒𝑛𝑑𝑒𝑟 + 𝛽3∗ 𝑀𝐷𝐴𝑃1𝑒𝑑𝑢𝑐𝑎𝑡𝑖𝑜𝑛 + 𝛽4∗ 𝑆𝑒𝑛𝑑𝑖𝑛𝑔𝑀𝑒𝑠𝑠𝑎𝑔𝑒𝑠 + 𝛽5∗
𝑆𝑒𝑛𝑑𝑖𝑛𝑔𝐸𝑚𝑎𝑖𝑙𝑠 + 𝛽6∗ 𝐶𝑎𝑙𝑙𝑠𝑈𝑠𝑖𝑛𝑔𝐴𝑝𝑝𝑠 + 𝛽7∗ 𝐹𝑎𝑐𝑒𝑏𝑜𝑜𝑘𝑈𝑠𝑒 + 𝛽8∗ 𝐼𝑛𝑓𝑜𝑟𝑚𝑎𝑡𝑖𝑜𝑛𝑆𝑘𝑖𝑙𝑙𝑠 + 𝜖
25
In Annex A 2, communication skills and information skills could predict the self-use. Keeping everything else constant, MDAP1 who can send email is also more likely to use online services for checking exam results (significant at 5% level in models with or without fixed effects), paying electricity bill, using mobile banking, and registering for COVID-19 vaccine (significant at 1% level in models with or without fixed effects) by themselves. The ability to make calls using apps is positively associated with checking exam results online by themselves (significant at 1%
level in both models). Facebook use is associated with higher likelihood of using digital services for checking exam results online, paying electricity bill, and registering for COVID-19 vaccine and using mobile banking by themselves. In case of information skills, MDAP1 who was able to complete more tasks successfully was more likely to use education related services and mobile banking and COVID-19 vaccine registration online by themselves. In case of electricity bill payment, it was associated with a higher likelihood of self-use significantly with the fixed effects but was not significant anymore without the fixed effects.
Only the ability to send messages was negatively associated with the likelihood of checking exam results online and using mobile banking by themselves, holding everything else constant.
Hence, we make contingency tables to further investigate. In case of both these services, we see that despite having a negative sign in the regression results, those who can send messages are more likely to check results online by themselves. It is possible that coefficients are picking up negative signs because of bias in the models.
Table 9: Contingency Table of Sending Messages with Checking Result Online and Mobile Banking Check Result Online
Intermediary Self- Use
Send Messages No 89 92
Yes 181 428
Mobile Banking
Intermediary Self- Use
Send Messages No 2017 82
Yes 1912 369
3.4.3 The relation between digital literacy and self-use of selected services
Overall, for the identification and social safety related services, the number of users who availed the services without an intermediary is so small that we could run regression for these
26
services. It does not matter whether they have digital access and digital skills. Regardless of the MDAP 1’s digital access and digital skills, most of the households use an intermediary to avail the services.
Name of the Service Service Users (N)
Used Digital Service by Themselves (N)
Used Digital Service by Themselves (%)
Birth Certificate 1476 8 0.54
Nationality Certificate 412 0 0
National ID 628 8 1.27
Social Safety Net Allowance
1072 47 4.38
Old Age Allowance 481 3 0.62
Of the services that higher self-users, the education related services had a higher share in comparison to other services. While many respondents took help from the intermediaries for electricity bill payment, mobile banking, and COVID-19 vaccine registration; high number of respondents used the services by themselves as well. Different components of digital access and digital skills had positive correlations with self-use of these services. This shows that some dimensions of digital access and digital skills can predict the self-use of such services.
To further investigate the relation between digital literacy and self-using the digital services, we create some contingency tables (Annex A 3 and Annex A 4). In Annex A 3, we can see that the MDAP1s with digital access and more digital skills are more likely to use the services like
checking exam results online or COVID-19 vaccine registration by themselves; but digital access or more digital skills do not make a meaningful difference in the self-use of social safety net registration. In Annex A 4, we can see that those who could register for COVID-19 vaccine digitally were also more likely to be able to self-use education related services, bill pay, and mobile banking. Very low share of people who registered for COVID-19 vaccines by themselves self-used the identification or social safety related services. All these lead us to the question- are there differences in the nature of digital services for identification or social safety net related services and services like checking exam results online or COVID-19 vaccine
registration? It is plausible that the latter are more user friendly or easier to administer by self in comparison to the former – which is leading to the citizens leaning towards intermediaries for help.
3.5 Most Used Modes of Accessing the Service
27
In the following table, we list the modes of accessing the service used by most respondents. We intentionally do not include the modes with low frequencies. We find a clear distinction in the modes between identification and social safety net related services and the rest of the service.
For the identification and social safety net related services, most respondents go to the Union Digital Center (UDC) or Union Parishad (UP). For the education related services, high shares of respondents did it by themselves or asked for help from a neighbour or relative; the rest went to the local computer or mobile shop. For paying the electricity bill, most respondents went to the bank, and most of the rest went to a shop in the local marketplace that offers this service. It makes sense since the service is offered both manually and digitally. For mobile banking and COVID-19 vaccine registration, most people went to shops in the market that offered the service including local computer or mobile shops. For both these services, a notable share of the respondents also were also self-user or took help from a neighbour or a relative.
Table 10: Most Popular Modes of Accessing the Services
Name of the Service Mode of Accessing the Service Percentage of
Respondents Birth Certificate
Union Digital Center/Computer operator at Chairman's office
59.01
Union Parishad 34.76
Citizenship Certificate
Union Digital Center/Computer operator at Chairman's office
25.49
Union Parishad 71.36
National ID
Union Digital Center/Computer operator at Chairman's office
38.06
Union Parishad 29.62
Others 14.65
Individual who provides the service for free 9.87 Social Safety Net
Allowance
Union Digital Center/Computer operator at Chairman's office
6.81
Union Parishad 40.02
Others 18.38
28
Individual who provides the service for free 16.04
Old-Age Allowance
Union Digital Center/Computer operator at Chairman's office
17.67
Union Parishad 65.07
Checking online exam result
Self-Use of the Service 65.82
Relative or Neighbour did it digitally 12.28
Local computer/mobile shop 14.56
Online Exam Registration
Self-Use of the Service 31.09
Local computer/mobile shop 38.12
Others 20.23
Electricity Bill
Bank 39.79
Shop in the local marketplace 26.09
Others 11.91
Mobile Banking
Shop in the local marketplace 59.91
Local computer/mobile shop 16.48
Self-Use of the Service 10.30
COVID-19 Vaccine Registration
Local computer/mobile shop 56.02
Shop in the local marketplace 9.81
Self-Use of the Service 9.75
Relative or Neighbour did it digitally 9.44
29 4 Comparison between 2019 and 2021
4.1 Digital Literacy Comparison
In this section, we are presenting a comparison of digital access and digital skills of the MDAP1s between 2019 and 2021. Since all MDAPs from 2019 were not available in the 2021 survey, we filtered the 4147 MDAPs who were present in both rounds. We tried to see whether there was any change in their access and skills over time.
We present the comparison for the use of smartphone, internet, and computer to show the changes in access to digital devices and internet connectivity. We also include the ability to send messages and emails to capture the changes in communication skills. We also present the comparison of high information skills (whether the MDAP can perform all three tasks related to finding information about passport).
However, we do not include the ability to call using apps and use of Facebook as these variables do not exist in both rounds. In 2019, the MDAPs were asked if they could make video calls using apps like facetime or skype, and in 2021, they were asked if they could make calls using apps like WhatsApp. Similarly, in 2019, the survey asked if the MDAPs use social media like
Facebook, WhatsApp, Viber, or Imo; and in 2021, the survey asked if they used Facebook. These variables seem similar but they both do not measure the same thing. Since we do not include these variables.
Figure 17: Comparison of Digital Access in 2019 and 2021
38.27 33.59 7.55
43.55 40.25 7.86
0 5 10 15 20 25 30 35 40 45 50
Smartphone Use Internet Use Computer Use
Percentage of MDAPs
2021 2019
30
From the comparison, we can see that the use of smartphone and internet increased considerably from 2019 to 2021. The use of computer remained almost the same.
Figure 18: Comparison of Digital Skills in 2019 and 2021
The ability to send emails and find information from the passport website also increased notably. The only decrease was in the ability in sending messages. It is not clear why some MDAPs reported that they could send messages in 2019 but reported that the couldn’t in 2021.
The question to determine whether the MDAP can send messages was phrased and
operationalized differently in 2019 and 2021. That may have contributed to such an outcome.
4.2 Panel Regression of Selected Services: Does Digital Literacy Predict Self-Use of Digital Services Across Two Rounds?
We want to run a panel regression with self-use of digital services as the dependent variable and components of digital access and skills as independent variables. In order to do that we need to find out how many households required a service in both 2019 and 2021. Since we already selected 10 services from the 2021 survey for the linear probability model, we checked how many of the households required those services in 2019 as well. We dropped COVID-19 vaccine registration as this was not relevant in 2019. Of the other 9 services, four had at least 300 users: birth registration, checking exam result online, mobile banking, and electricity bill payment.
Table 11: Households that used the services in both 2019 and 2021 Required the Service
in both 2019 and 2021
48.88 6.92
10.08
47.53 16.49
18.86
0 10 20 30 40 50 60
Send Messages Send Emails High Information Skills
Percentage of MDAPs
2021 2019
31
Birth Registration 334
National ID 13
Citizenship Certificate 79
Social Safety Net 105
Old Age Allowance 79
Electricity Bill 3993
Exam Result Online 307
Exam Registration Online 44
Mobile Banking 1700
The equation for the regression is:
𝐷𝑖𝑔𝑖𝑡𝑎𝑙𝑙𝑦𝐴𝑐𝑐𝑒𝑠𝑠𝑖𝑛𝑔𝑆𝑒𝑟𝑣𝑖𝑐𝑒𝑠𝑏𝑦𝑇ℎ𝑒𝑚𝑠𝑒𝑙𝑣𝑒𝑠𝑖𝑡 = 𝛽0+ 𝛽1∗ 𝑆𝑚𝑎𝑟𝑡𝑝ℎ𝑜𝑛𝑒𝑈𝑠𝑒𝑖𝑡+ 𝛽2∗ 𝐼𝑛𝑡𝑒𝑟𝑛𝑒𝑡𝑈𝑠𝑒𝑖𝑡+ 𝛽3∗ 𝐶𝑜𝑚𝑝𝑢𝑡𝑒𝑟𝑈𝑠𝑒𝑖𝑡+ 𝛽4∗ 𝑆𝑒𝑛𝑑𝑖𝑛𝑔𝑀𝑒𝑠𝑠𝑎𝑔𝑒𝑠𝑖𝑡+ 𝛽5∗
𝑆𝑒𝑛𝑑𝑖𝑛𝑔𝐸𝑚𝑎𝑖𝑙𝑠𝑖𝑡+ 𝛽6∗ 𝐼𝑛𝑓𝑜𝑟𝑚𝑎𝑡𝑖𝑜𝑛𝑆𝑘𝑖𝑙𝑙𝑠𝑖𝑡+ 𝜖𝑖𝑡
We form the panel data frame using the 4147 households in which the same MDAP was
present in both the 2019 and 2021 rounds of the survey. In the model, 𝑖 = 1, 2, 3 … , 4147 and 𝑡 refers to the two time periods of 2019 and 2021. We use fixed effects to capture the variance between the households. The regression allows the independent variables to explain the variance within households over time.
32
Table 12: Panel Regression with Self-Use of Mobile Banking, Electricity Bill Payment, Birth Registration, and Checking Exam Result Online as Dependent Variables
Mobile Banking
Electricity Bill Payment
Checking Exam
Result Online Birth Registration
Smartphone Use -0.045 -0.008 0.121 0.003
0.034 0.014 0.099 0.019
Internet Use 0.032 -0.002 0.395 *** -0.003
0.035 0.015 0.113 0.020
Computer Use -0.057 * 0.064 *** -0.149 ** 0.003
0.034 0.018 0.062 0.021
Sending Messages -0.031 -0.006 -0.052 0.031
0.033 0.013 0.179 0.019
Sending Emails 0.173 *** 0.075 *** 0.156 *** -0.020
0.029 0.014 0.058 0.018
Information Skills 0.011 0.009 ** 0.020 -0.003
0.009 0.004 0.021 0.005
Fixed Effects Household Household Household Household Number of
Observations 4526 6701 1167 1785
Note: *,**,*** indicate significance at the 10%, 5%, and 1% level respectively.
33
We found using a computer negatively correlated with mobile banking and checking exam results online and positively correlated with electricity bill payment across two rounds. The overall number of computer users is very low in the sample and hence it is difficult to draw serious conclusion from the coefficients.
The variance in mobile banking uses over time is explained by the ability to send emails (significant at 1% level). The variance within electricity bill payment is associated with sending emails (significant at 1% level) and information skills (significant at 5% level). The variance in checking exam result online is positively associated with internet use (significant at 1% level) and sending emails (significant at 1% level).
The variance in availing birth registration is not significantly correlated with any variable.
From the analysis, we can see that sending email consistently predicts more digital self-use of online services over time. This makes sense as we can reasonably assume that sending email requires a higher order skill than that is needed to send messages. What this means is that households in which MDAPs picked up the skill of sending an email were more likely to transition into self-use of the online services.