Experimental Investigation On Sandwich Composite Made of Expanded Perlite/Epoxy Based Core And JFRP & CF As Skin
Submitted By
Md. Moshiur Rahman Sikder BME-1903019278 Md. Mahedi Hasan Kishor BME-1903019105 Abu Rushd Md. Moydul Kadir BME-1903019058 Khairul Islam BME-1903019123
Supervised By G.M Ismail Hossain
Lecturer
Department of Mechanical Engineering Sonargaon University (SU)
Dhaka-1215, Bangladesh
Experimental Investigation On Sandwich Composite Made of Expanded Perlite/Epoxy Based Core And JFRP & CF As Skin
Submitted By
A Graduation Exercise Submitted to the Department of Mechanical Engineering in Partial Fulfillment of the Requirements for the Degree of Bachelor of Science in Mechanical Engineering
DEPARTMENT OF MECHANICAL ENGINEERING SONARGAON UNIVERSITY
DHAKA, BANGLADESH May , 2023
ⅱ
ID: BME 1903019278 Md. Moshiur Rahman Sikder
ID: BME 1903019105 Md.Mahedi Hasan Kishor
ID: BME 1903019058 Abu Rushd Md. Moydul Kadir
ID: BME 1903019123 Khairul Islam
DECLARATION
We hereby declare that this thesis is our own work and to the best of our knowledge it contains no materials previously published or written by another person, or have been accepted for the award of any other degree or diploma at Sonargaon University or any other educational institution. We also declare that the intellectual content of this thesis is the product of our own work and any contribution made to the research by others, with whom I have worked at Sonargaon University or elsewhere, is explicitly acknowledged.
Md.Moshiur Rahman Sikder
̅̅̅̅̅̅̅̅̅̅̅̅̅̅̅̅̅̅̅̅̅̅̅̅̅̅̅̅̅̅̅̅̅̅̅̅̅̅̅̅̅̅̅̅̅̅̅
Md Mahedi Hasan kishor
̅̅̅̅̅̅̅̅̅̅̅̅̅̅̅̅̅̅̅̅̅̅̅̅̅̅̅̅̅̅̅̅̅̅̅̅̅̅̅̅̅̅̅̅̅̅̅̅̅̅̅̅̅̅̅
Abu Rushd Md Moydul Kadir
̅̅̅̅̅̅̅̅̅̅̅̅̅̅̅̅̅̅̅̅̅̅̅̅̅̅̅̅̅̅̅̅̅̅̅̅̅̅̅̅̅̅̅̅̅̅
Khairul Islam ̅̅̅̅̅̅̅̅̅̅̅̅̅̅̅̅̅̅̅̅̅̅̅̅̅̅̅̅̅̅̅̅̅
ⅲ
CERTIFICATION OF APPROVAL
The thesis title “ Experimental Investigation On Sandwich Composite Made of Expanded Perlite /Epoxy Based Core And JFRP & CF As Skin
” submitted by Md. Moshiur Rahman Sikder (BME-1903019278), Md.Mahedi Hasan Kishor (BME-1903019105), Abu Rushd Md.Moydul Kadir (BME-1903019058), Khairul Islam (BME-1903019123) has been accepted as satisfactory partial fulfillment of the requirement for the degree of bachelor of science in mechanical engineering on 28 May 2023.
Countersigned
G.M Ismail Hossain
Supervisor & Lecturer in Mechanical Engineering Sonargaon University (SU), Dhaka-1215, Bangladesh
ⅳ
ACKNOWLEDGEMENT
First and above all, we praise the Almighty Allah for providing us the opportunity, patience and allocating us the capability of completing the thesis for the degree of Bachelor of Science in Mechanical Engineering.
It is a great pleasure to acknowledge our profound gratitude and respect to our supervisor G.M Ismail Hossain, Lecturer in Mechanical Engineering and all respected teachers in Sonargaon University for their continuous help and support in all stages of this thesis for their consistent guidance, encouragement, helpful suggestion, constructive criticism and endless patience through the progress of this work. The successful completion of this thesis would not have been possible without their persistent motivation and continuous guidance.
We would like to expresses cordial thanks to our loving parents, friends and well-wishers for their cooperation, cheerfulness and inspiration during the course of this study.
[Authors]
Md.Moshiur Rahman Sikder Md. Mahedi Hasan Kishor Abu Rushd Md. Moydul Kadir Khairul Islam
ⅴ
ABSTRACT
A novel sandwich structure is fabricated consisting of an expanded
perlite/epoxy-based core and jute fiber reinforced polymer (JFRP) & Carbon
Fiber (CF) as skin. In situ sandwiching technique during compression molding
was adopted for manufacturing the structure. JFRP & CF skin was made
separately using the hand lay-up method and the core density of the sandwich
composite was varied using various compaction ratio. The flexural and
compressive properties are investigated along with the varying core to
investigate the hardness & Energy absorption of the skin . The performance of
the sandwich structure in flexure and compression is affected by the core
density .The load-carrying capacity of the sandwich structure was increased
about 1.5-1.91 times with an increasing to investigate the hardness & Energy
absorption of the skin from 2 to 3. Hardness and Energy absorption The
flexural failure of the sandwich composite was initiated from the core of the
flexural specimen (core shear failure) and then delamination of the skin. During
compression, the strength and the energy absorption are both enhanced
significantly by the increment the of core density .
Contents
Page no.Declaration
ⅲCertification of approval
ⅳAcknowledgment
ⅴAbstract
ⅵCHAPTER I INTRODUCTION 1
1.1Overview 1
1.2Objectives 1
CHAPTER II LITERATURE REVIEW 2
2.1Sandwich Composites 2
2.2Constituent Materials 2
2.2.1Expanded Perlite 2
2.2.2Jute Fiber 2.2.3 Carbon Fiber
4 5 2.2.4 Epoxy Resin and Hardener
2.2.5 Acetone
6 8
2.3 Related Previous Work 9
CHAPTER III MATERIALS AND METHODOLOGY 12
3.1Materials 12
3.1.1Expanded Perlite 12
3.1.2Jute Fiber Mat 3.1.3 Carbon Fiber Mat
13 13 3.1.4 Epoxy Resin and Hardener
3.1.5 Acetone
14 15 3.2 Specimen Preparation
3.2.1 Core Preparation 3.2.2 Skin Preparation
3.2.3 Sandwich Composite Fabrication
15 15 17 19
CHAPTER IV
3.2 Physical and Mechanical Test 3.3.1 Flexural Test
3.3.2 Compression Test 3.3.3 Rockwell Hardness Test 3.3.4 Impact Test
RESULTS AND DISCUSSION 21 21 23 25 26 27
4.1Physical Properties 27
4.2Flexural Properties 27
4.2.1Flexural Strength and Modulus 4.3 Compressive Properties
4.3.1 Compressive Strength and Modulus 4.3.2 Failure Behavior during Compression test 4.4 Hardness Test of Skin
4.5 Skin Impact Test
29 33 33 35 37 38
CHAPTER V CONCLUSION AND FUTURE RECOMMENDATION 39
5.1Conclusion 39
5.2Recommendations 39
REFERENCES 40
TABLE OF CONTENTS
1 List of Tables
Table No. Table Name Page No.
Table1 The chemical composition of perlite 03
Table2 Chemical constituents of jute fiber 04
Table3 Table 4
Table 5
Physico-mechanical properties of jute fiber
Carbon Fiber Materials Properties General Properties of Acetone
04 06 08 Table6 Mechanical properties of jute core sandwich nanocomposites. 10 Table7 Experimental results of sandwich composite testing 11
Table 8 Experimental data for density calculation for flexural test specimens where 2.0,2.5,3.0 indicates the compaction ratio, F as flexural and (1) as specimen number.
28
Table 9 Experimental data for density calculation for compression test specimens where 2.0,2.5,3.0 indicates the compaction ratio, C as Compression and (1,2,3) as specimen number.
30
Table10 Flexural strength and modulus for the different specimens during the flexural test. Where sample code & element number 2.0, 2.5,and 3.0 indicates compaction ratio and F for flexural and (1) specimen number.
31
Table11 Average Flexural strength and modulus for sandwich composite with different compaction ratio of the core.
31 Table12 Compressive strength and modulus for the different specimens
during the compression test. Where sample code & element number 2.0, 2.5, and 3.0 indicates compaction ratio and C for compression and (1) specimen number.
33
Table13 Average Compressive strength and modulus for sandwich composite with different compaction ratio.
34
Table14 Data of Rockwell Skin Test. 37
Table 15 Data of Impact skin Test . 38
List of Figure
Figure No. Figure Name Page
No.
Figure1 The formation of the sandwich structure 2
Figure2 Classification of epoxy-resin 7
Figure3 Expanded Perlite 13
Figure4 Jute Fiber Mat 13
Figure 5 Carbone Fiber Mat 14
Figure6 (a) (10:1) Epoxy Resin and hardener and (b)Epoxy resin-hardener (10:1)
14
Figure 7 Figure8
Acetone in bottle
(a)Schematic view of the mold and(b),(c)and(d)core preparation process 17
15
Figure 9 Line graph showing sample calculation for skin preparation 18
Figure 10 (a),(b) Preparation of skin by hand lay –up process and (c) Prepared JFRP &
CF skin in dimension of (15*15) cm2 19
Figure 11 (a) (e) Fabrication process of Sandwich composite and (f) Fabricated 20
Figure 12 Sandwich Panel Dimension 21
Figure 13 Force Displacement curve 22
Figure 14 Three –Point mid-span loading configuration 23
Figure 15 Load Displacement curve 24
Figure 16 Schematic diagram of flat wise compression test of the specimen 25
Figure 17 Rockwell Principle Diagram 26
Figure 18 (a) & (b) Schematic Diagram of Izod and Charphy Specimen 26
Figure 19 Flexural Strength versus Core density Curve 32
Figure 20 Flexural Modulus versus Core density Curve 32
Figure 21 Compressive Strength versus Core density Curve 34
Figure 22 Compressive Modulus versus Core density Curve 35
Figure 23 Failure pattern of a Sandwich Composite Specimen (2.0-C-1&2) 35
Subjected to Compression Loading Figure 24 Failure pattern of a Sandwich Composite Specimen (2.5-C-1&2) 36
Subjected to Compression Loading Figure 25 Failure pattern of a Sandwich Composite Specimen (3.0-C-1&2) 36
Subjected to Compression Loading Figure 26 (a) & ( b) Rockwell Hardness test 37
Figure 27 Impact Testing Machine & Materials Condition after Testing 38
Chapter 1 Introduction
1.1 Overview
Sandwich composite material and its structures are increasingly used in engineering applications in industries, building systems, and transporting composite sandwich materials. In automobile industries, aerospace and marine structures are mostly made of sandwich structures. Because the sandwich structures are lightweight in nature, can with stand heavy loads, and consists of relatively high flexural strength and stiffness. The sandwich core material is lightweight and mostly combined with skin materials. The skin materials can be of various types such as glass fiber reinforced polymer, carbon fiber reinforced polymer, steel, aluminum and fiber-reinforced polymer. Mostly, the composite skin materials are fabricated through hand lay-up methods or vacuum assisted resin transfer molding machines.
Expanded Perlite as core is mainly used because of its low density, light in weight, and JFRP & CF as skin because they are biodegradable comparatively higher strength than any other bio fiber. Aramid, balsa wood, Aluminum and Nomex core are mainly used as core materials. Corrugated cores are also used in mostly unidirectional support for structural applications. Some significantly higher strength fiber (carbon, glass, Kevlar) is being used as the skin of sandwich structure for better strength and stiffness of the composite structure. The prepared core materials are mostly covered with the two skin materials. Many researchers have carried out their work on sandwich composites focusing on different analysis techniques and using different types foams as core but the research on expanded perlite/epoxy-based core and JFRP& CF as skin by varying core density did not evokemuch attention, although it is a cheap material
.
1.2 Objectives
The objectives of the project are
i. To fabricate sandwich composites using expanded perlite/epoxy-based core and JFRP&
CF as skin by varying the core density,
ii. To Investigate the hardness & Energy absorption of the skin
iii. To investigate the flexural and compressive properties of the manufactured composites, and iv. To analyze the failure behavior during the flexural and compression tests.
1
Chapter 2 Literature Review
2.1 Sandwich Composites
A sandwich-structured composite is a particular class of composite material fabricated by attaching two thin but stiff skins to a lightweight but thick core. The core material is usually low strength material, but its higher thickness provides the sandwich composite with high bending stiffness with overall low density. [1]
Figure:1 The formation of the sandwich structure
Owing to the core structure, such composites are distinguished by stiffness. Despite the thickness of the core, sandwich composites are light and have a relatively high flexural strength. These composites have a spatial structure, which affects good thermal insulator properties. Sandwich panels are used in aeronautics, road vehicles, ships, and civil engineering. The mechanical properties of these composites are directly dependent on the properties of sandwich components and the manufacturing method. The paper presents some aspects of technology and its influence on the mechanical properties of sandwich structure composites made of expanded perlite/epoxy-based core and JFRP& CF as skin [1].
2.2 Constituent Materials 2.2.1 Expanded Perlite
Perlite is an amorphous volcanic glass with a relatively high-water content, typically formed by the hydration of obsidian. It occurs naturally and has the unusual property of greatly expanding
When heated sufficiently. It is an industrial mineral and a commercial product useful for it slow density after processing. It is a non-renewable resource, with about 700 million tons of perlite being stored in the current world.
Table1:The chemical composition of perlite
Constituent Percentage
SiO2 70-75%
Al2O3 12-15%
Na2O 3-4%
K2O 3-5%
Fe2O3 0.5-2%
MgO 0.2-0.7%
Cao 0.5-1.5%
LOI 3-5%
There are many advantages of perlite :
• It is very light in weight and has a low bulk density of about 30–150kg/m3.
• Extremely low thermal conductivity.
• It has extremely high insulation property temperature up to 650°C.
• Fireproof, rot proof, soundproof, impervious to damp.
• Environment friendly.
• Corrosion under insulation resistance.
Applications [4]
• It is used in high thermal insulation and heat protection.
• It is used in cryogenic applications like Non-combustible ultra-lightweight mineral aggregate with excellent insulation &adsorption properties.
• It is used in fireproofing and soundproofing systems.
• Swimming pools, cold storage, boilers, and some insulation projects with special requirements for water proofing.
• Perlite insulation is used in high-temperature applications in the steel and foundry industries, such as ladle topping, hot topping, and riser.
• Expanded Perlite is suitable for landscaping applications such as green roof construction, green golf renovation, planters, and drainage.
• Expanded perlite powder and board is a hydrophobic insulating aggregate.
2.2.2 Jute Fiber
Jute is one of the most affordable fibers, popularly known as "golden fiber". It is one of the cheapest and strongest all-natural fibers and is considered a future fiber. Jute is second only to cotton in the world's production of textile fibers. Jute fibers are composed primarily of the plant materials cellulose and lignin .Bangladesh, India, China, and Thailand are the leading producers of Jute. Jute is a significant textile fiber and a raw material for non-traditional and value-added non-textile products.
Table2: Chemical constituents of jute fiber
Types Cellulose (%) Hemi-cellulose(%) Lignin(%) Fat and Wax (%)
1 61.2 23.2 13.7 0.5
2 61-73.2 13.6-20.4 12-16 -
3 61-71 14-20 12-13 -
Table3:Physico-mechanical properties of jute fiber
Types Density(g/cm3) Tensile Strength(MPa) Lignin(%) Elongation at break(%)
1 1.3 393-773 26.5 1.5-1.8
2 1.3-1.46 393-800 10-30 1.5-1.8
3 1.3-1.45 393-773 13-26.5 1.16-1.5
The advantages of jute fiber are huge.
• Jute fiber is 100% biodegradable and recyclable, thus environmentally friendly.
• Jute has low pesticide and fertilizer needs.
• It is a natural fiber with a golden and silky shine and hence called the golden fiber.
• It is the cheapest vegetable fiber procured from the bast or skin of the plant's stem.
• It is the second most important vegetable fiber after cotton, in terms of usage, global consumption, production, and availability.
• It has high tensile strength and low extensibility and ensures better breathability of fabrics.
Therefore, in agricultural commodity bulk packaging, jute is very suitable. Advantages of jute fiber include good insulating and antistatic properties and low thermal conductivity and moderate moisture regain. Other benefits of Jute include acoustic insulating properties and manufacture with no skin irritations.
2.2.3 Carbon Fiber
Carbon fibers have diameters ranging from about 5 to 10μm and are composed primarily of carbon atoms. They are obtained by oxidation and carbonization in furnaces of poly acrylonitrile or PAN fibers. Their structure consists in a superposition of long and flat micro crystals aligned parallel to the fiber axis.
The main properties of carbon fibers are:
• high tensile and compressive strengths
• high modulus
• low density
• high chemical resistance
• high temperature tolerance
• electrically conductive
The variation of process parameters (temperatures, times etc.) can provides fibers with different characteristics: high or intermediate modulus, high tenacity etc.
Today's carbon fibers are nearly five times stronger than steel and three times lighter. These properties make carbon fiber extremely interesting for a range of industries, especially the automotive and aerospace industries
5
Table 4:Carbon fiber materials properties:
Tensile Strength (MPa) 5407
Tensile Modulus (GPa) 294
Elongation (%) 1.75
Density (g/cm3) 1.79
Strength- to-weight ratio (MPa/g/cm3)
3026
Applications:
• Hockey sticks, tennis racquets, archery bows, and golf clubs made from carbon fiber are often used.
• Even clothing and protective gear are made with carbon fiber, with racing sports often using carbon fiber helmets and shoes.
• Carbon fiber is expected to be used in components for mass-produced cars, such as housings and frames.
2.2.4 Epoxy Resin and Hardener
Epoxy resin comes in two parts: a resin and a hardener. Mixing the resin and hardener prompts a chemical reaction between the two, transforming them from a liquid into a solid in 24hours.The chemical formula of epoxy resin is C21H25ClO5. Correctly measured and thoroughly mixed epoxy resin is required for perfect cures.
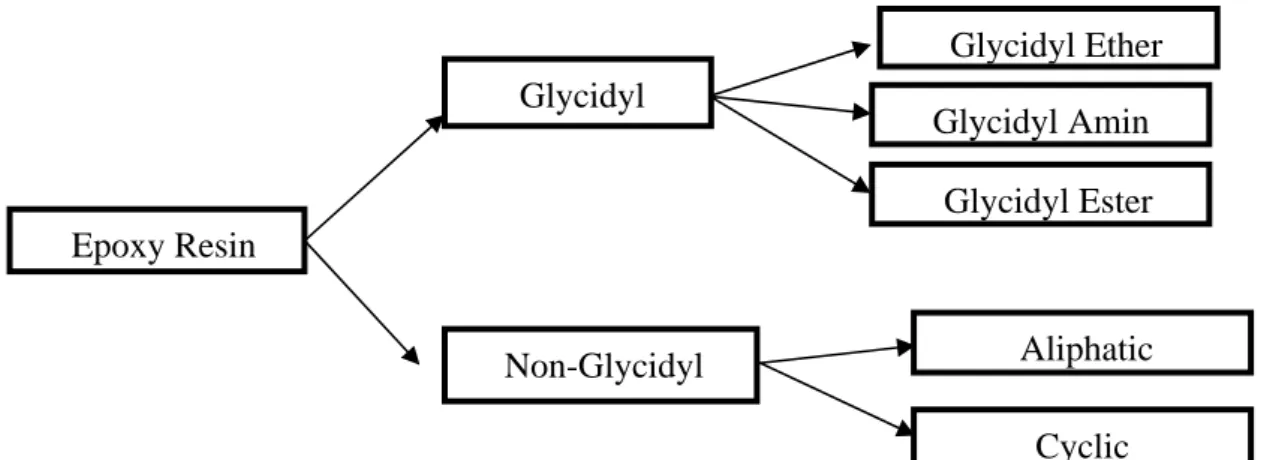
Epoxy Resin
Glycidyl Ester Glycidyl Amin Glycidyl
Glycidyl Ether
Cyclic
Non-Glycidyl Aliphatic
Epoxy resins fall into two types based on their molecular structure and applications: glycidyl epoxy and non-glycidyl epoxy. These can be further divided into three types based on their configuration: glycidyl ether, glycidyl ester, and glycidyl amine. [6]
Figure 2:Classification of epoxy-resin
Epoxy resins are used to manufacture adhesives, plastics, paints, coatings, primers and sealers, flooring, and other products and materials used in building and construction applications. The properties of epoxy resin are:
• High Strength.
• Low Shrinkage.
• Excellent adhesion to various substrates.
• Effective electrical insulation.
• Chemical and solvent resistance, and.
• Low cost and low toxicity.
Epoxy resins are of particular interest in structural composite applications because they provide:
• A unique balance of chemical and mechanical properties
• As well as extreme processing versatility
Some of their most exciting applications are found in the aerospace and recreation industries, where resins and fibers are combined to produce complex composites structures. Epoxy resins satisfy a variety of non-metallic composite designs in commercial and military aerospace
applications, including flooring panels, ducting, vertical and horizontal stabilizers, wings, etc.;
2.2.5 Acetone
Acetone is a clear, colorless liquid. It is a solvent that can dissolve or break down other materials, such as paint, varnish, or grease. It evaporates quickly into the air.
Acetone is naturally present in trees and other plants, as well as tobacco smoke, vehicle exhaust,
and landfills. It also occurs in the body.
Other names for acetone include:
✓ dimethyl ketone
✓ 2-propanone
✓ propanone
✓ beta-ketopropane
❖ Table 5 General Properties of Acetone – C3H6O
Molecular Weight/ Molar Mass 58.08 g/mol
Density 0.784 g/cm³
Boiling Point 56 °C
Melting Point −94.7°C
❖ Application:
Companies use acetone in small amounts to create products that break down or dissolve other substances, such as:
➢ nail polish
➢ paint
➢ varnish
In industry, manufacturers use acetone for a variety of purposes, including:
• Removing grease or gum from textiles such as wool and silk
• Making lacquers for cars or furniture
• Making plastics
2.3 Related Previous Works
Krzyzak et al. [7] determined the influence of sandwich laminates' production technology on chosen mechanical properties, including structural characteristics occurring at the boundary of core stages and sandwich panel skins. They analyzed the process of developing cracks appearing after impact. The sandwich structures were fabricated in the following three methods, (a) hand lay-up (b)press, and (c) autoclave. The core was prepared by Polyurethane foam surrounded by a composite made of epoxy resin. Low viscosity epoxy resin with a CES R70 symbol based on Bisphenol A/F(modified using an active two-function diluter) and CES H71 hardener was used for outer skins. Mechanical properties (compressive strength and flexural strength) were calculated using a universal testing machine and the estimated results were found to be, the maximum compressive strength of 0.601 MPa using hand lay-up, 0.627 MPa for press and 0.610 MPa for Autoclave methods also the maximum flexural strength of 6.22MPa using hand lay-up, 7.26 MPa for press and 4.02MPa for Autoclave methods[7].
Jiang et al. [9] manufactured bio-composite sandwich structured mycelium-based cores.
The materials were used in that bio-composite sandwich structure were natural textile reinforcement, mycelium-bound agricultural waste as core, and bio-resin. This manufacturing process was done in three specific steps of the seven-step manufacturing process: (a)filling prestamped textile shells with core mixture, (b) allowing the core material to grow, (c) thereby binding reinforcement particles, (d) textile skins into a unitized preform, and (e) oven drying said perform to drive off moisture and inactivate the mycelium. After preparing the composite three-point flexural strength and compressive strength were performed on the samples using a Universal testing machine. Three-point bending test results for biotex jute textile- reinforced sandwich panel specimens were an average of 762 kPa[9].
9
Daniel and Abot [10] fabricated and tested the composite sandwich beams of carbon/epoxy laminates as skin and aluminum honeycomb PAMG as core material by autoclave molding.
Uniaxial tensile and compressive tests were conducted primarily in the longitudinal direction to obtain the appropriate constitutive behavior of the facing material. Failure was governed by the compressive strength of the face sheet, which in this case reached a value of 1930 MPa (280 KSI),which was higher than the compression strength for this material measured under direct compression ,and the ultimate compressive strain recorded was 1.6%[10].
Hassan et al. [12] investigates the influence of varying core density on the blast resistance of sandwich panels based on cross-linked PVC cores and aluminium alloy as skins. Five cross- linked PVC foams, nominal densities ranging was between 60 and 200 kg/m3. Compression and single edge notch bend and shear tests were conducted on the prepared sandwich panels.
On samples whose density was 200 kg/m3, the tested results were Compressive modulus 280 MPa, Tensile Strength175 MPa, Shear strength 3.5 MPa, Plastic collapse stress 4.19MPa[12].
Anbusagar et al. [13] investigate the influence of nano-clay content on sandwich composites under flexural and impact loading. Four different sandwich composite panels made of fiber glass/nano-modified polyester face sheets and jute core were prepared by hand lay-up manufacturing technique (H.L.). The core thickness was 6 mm, and the face sheets were made of one layer of woven fabric glass fibers and nano-modified polyester for sandwich panels.
Composite samples were tested for flexural and impact behavior using universal testing machine standardASTM-C393& ASTM-D6110. The experimental results were found to be given in table 6 .
Table6:Mechanical properties of jute core sandwich nanocomposite.
Sample code
Measured failure load
(N)
Skin bedding strength
(MPa)
Core shear strength
(MPa)
Bending modulus
(GPa)
Impact strength (KJ/m2)
SJ0 506.22 140 3.89 10.53 48.71
SJ2 586.66 162.81 4.51 13.63 50.35
SJ4 558.96 134.48 4.29 15.26 52.73
SJ6 449.65 113.67 3.45 16.35 59.63
Sridhar et al. [14] investigated the Mechanical Characterization of Polyurethane Foam and Hybrid Natural Fiber-Based sandwich Composite fabricated using vacuum bagging process.
Polyurethane foam was used as a core with uniform thickness while varying the core density.
Jute and glass fiber was used as the skin of the sandwich composite. The mechanical characterization of the specimens involves a tensile test, compression test, and three-point bending test were conducted on the sample according to ASTM standards using the universal testing machine. The results from the investigation revealed that the strength of natural fiber could be enhanced by partially combining it with synthetic fibers, and the mechanical properties of sandwich structures increase with the increase in the polyurethane foam density.
The experimental results of sandwich composite were found to be given table 7.
Table7 :Experimental results of sandwich composite testing
Specimen Compression strength (MPa) Flexural strength
(MPa)
Flat wise Edgewise
Jute1 1.89 4.92 13.72
Jute2 2.4 6.9 19.54
Jute3 3.2 8.63 24.43
Glass1 2.14 7.92 27.28
Glass2 2.9 10.9 31.53
Glass3 3.7 13.73 39.41
Jute/Glass Hybrid1 2.4 13.87 23.65
Jute/Glass Hybrid2 3.1 19.14 30.58
Jute/Glass Hybrid3 3.8 23.43 38.23
Wangetal.[16]investigates the bending behaviors of three grid sandwich structures with wood facing and jute fabrics/epoxy composites cores. Three kinds of sandwich beams were prepared: cross, double-cross, and square sandwich structures (CSS, DCSS, and SSS), using spruce wood as face panels, KH‐560 modified jute fabrics reinforced epoxy laminated composites (JFRELC) as cores. There were three steps to preparing a grid sandwich structure.
11
Step 1, the jute fabrics with the size of 33 cm × 27 cm were immersed in a 2 wt% silane coupling agent solution at room temperature (22 ± 2℃) for 60 min, and then they were dried at 80℃ to a constant weight. In step2, two layers of modified fabrics were coated with the mixed resins, tiled between silicone cushions and placed in a drying oven. After curing for 1.5 h at 120℃, JFRELC was successfully prepared .A universal testing machine tested different types of tests like tensile, compressive, flexural properties, and in‐plane shear response of raw and modified JFRELC. The flexural rigidity, shear rigidity ,shear modulus, and shear strength of SSS were 2.10×10⁸N·mm2, 1.97×10⁵N, and 143.94MPa, 0.948MPa, respectively, which were significantly better than that of DCSS and CSS.[16]
Thus, no clear picture exists about the investigation of sandwich composite made of expanded perlite/epoxy-based core and JFRP & CF as skin. Therefore, this study aimed to manufacture a sandwich structure made of JFRP & CF as skin and perlite as core and to investigate their mechanical properties.
Chapter 3 Materials and Methodology
3.1 Materials
The raw materials that were utilized for this investigation are described below.
3.1.1 Expanded Perlite
During this investigation, the core manufacturing was done using expanded perlite. It was a granular material produced by growing the volcanic rock perlite. Having low specific gravity, it provides excellent heat-insulating and sound-insulating qualities. The size of perlite, around (4-5.6) mm has a bulk density of 65–75 kg/m3 (0.065–0.075 g/cm3) was selected. The perlite was collected from an online platform.
Figure 3: Expanded Perlite 3.1.2 Jute Fiber Mat
The two most common raw jute fiber mat types - White Jute and Tossa Jute- are available in Bangladesh. During this investigation, the Tossa jute fiber mat was selected for the preparation of skin because it is softer, silkier, and stronger than white Jute. Tossa Jute has a massive demand for industrial use and good sustainability in the climate. It is also known as the top-quality Jute from Bangladesh. Physical properties like mass per (150*150)square millimeters was 5.7 g.
Figure 4 : Jute Fiber Mat 3.1.3 Carbon Fiber Mat
Today's carbon fibers are nearly five times stronger than steel and three times lighter. These properties make carbon fiber extremely interesting for a range of industries, especially the
automotive and aerospace industries. we collect it then measuring it .In every skin we use 3 layer from this 2 layer from jute fiber and 1 from Carbon fiber .Physical properties like mass per (150x150) square millimeters was 6.25 gm.
13
Figure 5 : Carbon Fiber Mat
3.1.4 Epoxy Resin and Hardener
10:1 Epoxy resin hardener was chosen for core preparation. The epoxy resin-hardener mixer density was 10:1 for skin and 10:1 for core, and the curing time was 24 hours for both.
For the curing of sandwich composite, the compression molding technique was followed.
(a) (b)
Figure 6: (a)Epoxy resin and hardener (10:1) (b)Epoxy resin-hardener(10:1)
3.1.5
Acetone
Acetone is a clear, colorless liquid. It is a solvent that can dissolve or break down other materials.
It evaporates quickly into the air. we used it for decrease density of resin and hardener mixer .we used 5gm acetone for 2.0 compaction,7gm for 2.5 compaction and 8gm for 3.0 compaction in every mixer.
Figure 7: Acetone Bottle
3.2 Specimen Preparation
The preparation of the sandwich structure composites was carried out in three different steps as follows(a) Core preparation, (b)Skin preparation and(c) Sandwich structure fabrication
3.2.1 Core Preparation
The core was prepared using the following methods.
In step 1: The epoxy-hardener solution was prepared in the ratio of 10:1 by weight percentage in a container.
Step 2:Then, the expanded perlite was poured into the container and mixed it properly so that the perlite could wet properly with epoxy-hardener.
Step3: Then the wetted perlite was sucked with a filter from the container and placed into the mold. Before placing the wetted perlite into the mold, plastic paper was used on the lower parts and walls of the mold for easy removal of the prepared core.
15
Step4:After placing the wetted perlite in proper quantity (129-6g,162g,194-4g),the puncher was placed over the wetted perlite with a sufficient weight so that the curing process cloud occurred under compressive stress for good bonding & high density of the material. The core thickness was maintained at around 15mm for all compaction ratio.
Step5:The compression process was maintained on the core for 24hours for better curing and then extracted the prepared core from the mold. The sample calculation was as follows to estimate the perlite required,
Epoxy-Perlite mixing ratio(1:2)
The Weight of v =200ml perlite was ,w=16g According to the formula ρ=w/v
The Density of perlite ρ =0.08g/ml
Finite Volume required of the core={length(15cm)*width(15cm)*Thickness (1.8cm) =405cm3
1.Compaction ratio=2
Required Perlite Mass = (2* 405*)g =64.8 g
I. Compaction ratio=2.5
Required Perlite Mass = (2.5* 405*ρ)g
=81 g
II. Compaction ratio=3
Required Perlite Mass = (2.5*405*ρ)g
=97.2g
3.2.2Skin Preparation
After preparing the core, skin of the sandwich structure composites was prepared in the hand lay-up method in the following manner,
In step1: A plastic paper was placed on the bottom part to easily extract the prepare skin and then prepare the epoxy-hardener solution in a ratio of 10:1 by weight percentage.
Step2: After preparing the epoxy-hardener solution, It was poured on the paper and rolled it with a paint roller.
17
(a) Constructed Mold
(b)Pouring perlite mixture inside the mold (c)Prepared core Figure 8: (a)Constructed mold and(b) and (c) core preparation process
Step 3: Then a size of (150*150) mm2Carbon fiber mat was placed over this epoxy-hardener layer and rolled it with a roller for removing bubbles from it. After that again the epoxy- hardener solution was applied top of the order.
Step4: Then a size of (150*150) mm2 jute fiber mat was placed over this carbon fiber epoxy- hardener layer and rolled it with a roller for removing bubbles from it. In this way, the epoxy- hardener solution was applied by placing three successive layers in the same order, one on top of the other. The three-tiered mat was covered with plastic sheeting and re- rolled with a roller so that maximum air could escape from inside.
Step 4: After placing plastic paper, the top of the mold keeped it on UTM Machine and give pressure on it then it remove from there and was placed on top of the plastic for 24hours.
Step5:After 24hours, the skin was removed from the mold. And subsequent skins were created in exactly the same way. The sample calculation is as follows,
Mass of per jute mat skin(150*150mm2) = 64.8 g
Figure 9:Line graphs showing sample calculation for skin preparation Epoxy mixer mass=93gm
2-layer jute & 1- layer Carbon Fiber mats
mass=17.33gm
Resinweight = 80gm Hardenerweight=8gm Acetoneweigh=5gm
(a) (b)
3.2.3 Sandwich Composite Fabrication
After preparing the skin and core individually the sandwich composite of expanded perlite/epoxy-based core and JFRP & CF as the skin was prepared in the following steps.
In step1:A plastic paper was placed on top of the bottom surface of the mold so that the fabricated sandwich composites could not be attached to the surface of the mold.
19 (c)
Figure 10 (a), (b) Preparation of skin by hand lay-up process and (c) prepared JFRP&CF skin in dimension of (15*15) cm2
Step 2: After placing the plastic, adhesive was added to the skin of JFRP& CF with a roller.
Step3:Then, the skin was placed inside the mold and the core on it.
Step 4: In addition, adhesive was applied to both sides of the core and skin. After that, the upper skin was placed on this core and it was kept compressed for 24 hours.
Step 5:Then the fabricated sandwich composites were remove from the mold
(a) Adding adhesive to the skin
(b) Placing the skin into the mold
(c) Placing the core up on the lower skin
20
3.3 Physical and Mechanical Tests
3.3.1 Flexural test
The ASTM C393 test method was used to determine the flexural properties (flexural strength and modulus) of the sandwich structure. The equation for calculating flexural strength,
𝐹𝑠 = 𝑃𝑚𝑎𝑥
(𝑑 + 𝑐)𝑏
Fig 12: Sandwich Panel Dimension
21
(d)Placing the upper skin (e)Compression process (f)Fabricated Sandwich Composites
Figure11 : (a)-(e) Fabrication process of sandwich composite and (f) fabricated sandwich composite
t
d c
t
Where,
Fs=flexural strength MPa[psi]
Pmax=Force facing prior to failure, (N) t = nominal facing thickness, mm[in.]
d = sandwich thickness, mm [in.]
c = core thickness, mm[in.], (c =d-2t) b = SandwichPanelswidth ,mm [in.].
Flexural modulus was calculated using the following equation, E =𝑃2−𝑃1
𝜕2−𝜕1
Where,
E=flexural modulus,
P2= Application force corresponding to δ2
Figure13: Force-displacement curve
P1= Application force corresponding to δ1 δ2= Value of deflection corresponding to P2 δ1=Value of deflection corresponding to P1
Universal Testing Machine was used to perform these tests and the speed of testing was 5mm/min.
Sandwich panels of dimension 150×150×22 mm from which samples for the flexural test were cut in150×20×22 mm and there were at least three test specimens per test condition.
loading
Figure14: Three-point mid-span loading configuration
3.3.2 Compression Test
The ASTM C365 test method was used to determine the flat wise compression properties (compressive strength and modulus) of the sandwich structure. Sandwich panels of dimension (150×150×22) mm3 from which samples for compression test were cut in (20×20×22) mm3andthere were at least four test specimens per test
condition. These tests were conducted using a Universal Testing Machine with a stroke speed of testing was 5 mm/min.
The equation for calculating compression strength,
Fz =
𝑃𝑚𝑎𝑥𝐴
23
Where,
Fz = Ultimate flat wise compressive strength, (MPa) Pmax=Ultimate force prior to failure,(N)
A =Cross sectional Area, (mm2)
Flat wise compressive modulus was calculated using the Following equation,
E= 𝑃2−𝑃1
𝜕2−𝜕1
Figure 15 : Load Displacement curve
Where,
E=Flat wise compressive modulus
P2= Application force corresponding to δ2 P2= Application force corresponding to δ1 P2= Application force corresponding to δ δ2 = Value of deflection corresponding to P2 δ1= Value of deflection corresponding to P1
Figure16:Schematic diagram of flat wise compression test of the specimen
3.3.3 Rockwell Hardness Test:
Hardness number depends on The applied load, the shape of the indentation and the depth to which the indenter penetrates the specimen.
Rockwell B Scale : For softer materials ,a 1/16 inch diameter steel ball is used, the major load load and t is 90 kg and minor is 10kg ( 100 kg load in total) and the hardness is
HRB=130
-
𝑑0.02
Rockwell C Scale : For Harder materials ,a conical-shaped diamond of 120 apex angle is used, the major load is 140kg and minor load is 10kg (150 kg load in total) and the hardness is
HRC=100
-
𝑑0.02
25
Loading
Figure 17: Rockwell Principle
3.3.4Skin Impact Test:
ASTM E23 standard test method for Notched Bar Impact Testing of materials.
We can do Charpy Impact test and Izod Impact test by Impact Testing Machine. Specimen dimension for Charpy impact test is (55x10x10) mm and for Izod Impact test is
(75x10x10) mm.
Figure 18 : (a) & (b) Schematic diagram of Izod and Charphy Specimen
Where,
Depth at notch =Specimen depth-depth of notch
Cross sectional area at notch = Depth of notch X Specimen width Energy required to break the specimen = Absorbed Energy, E
Chapter 4 Results and Discussion
4.1 Physical Properties
Material characterization is the method of measuring and ascertaining the micro structural, physical, and mechanical properties of a material from which it is easy to find the causes of failure and problems related to the manufacturing process. Further, it helps the manufacturer to make critical materials decisions.
27
Table 8 : Experimental data for density calculation for flexural test specimens where 2.0 indicates the compaction ratio, F as flexural and(1) as specimen number.
Sample Code&
Element Number
Length
(mm)
Avg.
Width (mm)
Avg.
Thickn ess (mm)
Avg.
Mass (g)
Avg. Volume (cm3)
Densit y (g/cm 3)
Density (g/cm3)
2.0 F-(1) 148.12
148.1
19.80
19. 57
21.03
2 1. 12
37.1
37 . 23 61.21 0.61 .61
148.32 19.85 21.20 37.28
148.08 19.08 21.13 37.31
2.0 F-(2) 148.16
148.21
19.32
19.67
22.05
22.16
40.1
40.05 64.6 0.62
148.08 19.81 22.14 40.21
148.41 19.88 22.29 39.85
2.5 F-(1) 145.87
145.98
21.89
21.33
22.0
21.51
44.00
44.16 65.4
0.67
0.68
146.02 20.64 21.05 44.2
146.06 21.64 21.50 44.3
2.5 F-(2) 146.22
1 46.2
20.05
20.83
22.00
22.1
45.15
45.1 65.6
0.68
145.90 20.08 22.12 45.12
146.13 20.16 22.3 45.10
3.0 F-(1) 149.60
149.68
21.64
21.4
21.85
21.99
53.30
53.3 70.4
0.75
0.75
149.87 21.65 21.78 53.20
149.62 21.07 22.35 53.40
3.0 F-(2) 150.00
149.94
21.67
21.80
22.38
22.69
55.6
55.6 74.01
0.75
150.12 21.74 22.90 55.76
149.70 21.80 22.80 55.54
4.2 Flexural Properties
After conducting the three –point flexural test for sandwich composite on a universal testing machine at a speed of testing 5mm/min with a span length of 100 mm for the different compaction ratio of 2.0- 3.0,flexural properties were calculated from the raw data produced during the test period
4.2.1Flexural Strength and Modulus
Flexural strength and modulus as a function of core density for various compaction ratio (but without distinguishing particle sizes) are shown in table(9,10) and figure (19).As expected, they increased with increasing the sandwich core density (compaction ratio 2.0-3.0),
.
The least-square lines for flexural strength-core density relationship were found to be from the graph: y = x – 100x-45.597, R² = 0.9982 (Figure 19).
Further, the nature of flexural modulus for various density of core was estimated and were found to be the least-square lines y =1411x+377.3, R² =0.867 (Figure 20). It was also observed that as the core density was increased, the flexural strength and modulus was also increased (Figure 19,20) due to high density of the core, as expected.
29
Table 9 :Experimental data for density calculation for Compression test specimens where 2.0 , 2.5, 3.0 indicates the compaction ratio, C as Compression and(1)as specimen number.
Sample Code &
Element Number
Length
(mm)
Avg.
Width (mm)
Avg.
Thickn ess (mm)
Avg.
Mass (g)
Avg. Volume (cm3)
Densit y (g/cm 3)
Density (g/cm3)
2.0 C(1) 19.60
19.80
20.25
20.24
22.25
22.24
5.6
5.6 8.91 0.63 0.6
19.55 20.59 22.30 5.9
20.26 19.89 22.18 5.4
2.0-C-(2) 20.30
20.34
20.34
20.4
22.39
22.51
5.3
5.3 9.34
0.57
20.47 20.19 22.21 4.9
20.26 20.67 22.95 5.8
2.5 C-(1) 20.34
20.18
20.34
20.21
22.17
22.09
6.1
6.26 9.009
0.69
0.68
19.97 19.86 21.98 6.3
20.23 20.42 22.13 6.4
2.5 C-(2) 20.45
20.58
20.12
20.12
23.07
22.81
6.6
6.5 9.44
0.68
21.04 20.45 22.79 6.3
20.26 19.78 22.58 6.6
3.0 C-(1) 20.50
20.23
20.34
20.43
23.25
22.92
7.1
7.1 9.47
0.75
0.75
20.32 20.29 22.75 7.3
19.87 20.65 22.78 7.0
3.0 C-(2) 20.36
20.47
20.75
20.39
23.25
23.14
7.1
7.2 9.66
0.74
20.60 20.19 23.39 7.3
20.47 20.25 22.78 7.2
Table10 : Flexural strength and modulus for the different specimens during the compression test.
Where sample code & element number 2.0, 2.5, and 3.0 indicates compaction ratio and F for compression and (1) specimen number.
Sample code &
Element Number
Flexural Strength ( MPa)
Avg.(MPa) Flexural Modulus (MPa)
Avg. (MPa)
2.0-F-(1) 15.30 15.23 1215.80 1215.86
2.0-F-(2) 15.16 1215.92
2.5-F-(1) 22.67 22.75 1381.37 1381.67
2.5-F-(2) 22.83 1381.97
3.0-F-(1) 29.27 29.23 1413.20 1413.43
3.0-F-(2) 29.19 1413.63
Table11: Average Flexural strength and modulus fo sandwich composite with different compaction ratio.
Compaction Ratio
Flexural strength avg.(MPa) Flexural Modulus avg. (MPa)
2.0 –F-(1&2) 15.23 1215.86
2.5-F-(1&2) 22.75 1381.67
3.0-F-(1& 2) 29.23 1413.43
31
Figure 19 : Flexural strength versus core density curve
Figure 20 : Flexural Modulus versus Core Density Curve
32
y = 100x - 45.597 R² = 0.9982
10 15 20 25 30 35
0.58 0.63 0.68 0.73 0.78
Flexural Strength(MPa)
Core Density , g/cm3
y = 1411.2x + 377.36 R² = 0.867
1200 1250 1300 1350 1400 1450
0.58 0.63 0.68 0.73 0.78
Flexural Modulus (MPa)
Core Density g/cm3
4.3 Compressive Properties
After conducting the flat wise compression test for sandwich composite on a universal testing machine at a speed of testing 5mm/min with a sample size(20*20*22) mm3 compaction ratio ranges of 2.0-3.0, compression properties were calculated from the raw data produced during the test period.
4.3.1Compressive Strength and Modulus
Compressive strength and modulus as a function of core density for various core density (but without distinguishing particle sizes) are given in table (21, 22). As expected, they increase with increasing the sandwich core density (compaction ratio 2.0-3.0), The least- square lines for compressive strength-core density relationship were found to be from the graph : y = 45.57x-24.83 R² = 0.998 (Figure 21) and the nature of compressive modulus for various core density was estimated and were found to be the least-square lines y =1449.x- 584.8 ,R² = 0.0.804 (Figure 22). As expected, it was observed that as the core density was increased, the flexural strength and modulus was also increased (Figure21,22)
Table 12 :Compressive strength and modulus for the different specimens during the compression test. Where sample code & element number 2.0, 2.5, and 3.0 indicates compaction ratio and C for compression and (1) specimen number.
Sample code &
Element Number
Compressive Strength
( MPa)
Avg.(MPa) Compressive
Modulus (MPa)
Avg. (MPa)
2.0-C-(1) 2.81
2.89
270.184
270.285
2.0-C-(2) 2.97 270.386
2.5-C-(1) 6.29
6.31
458.22
458.44
2.5-C-(2) 6.34 458.66
3.0-C-(1) 9.09
9.27
473.07
473.17
3.0-C-(2) 9.45 473.27
33
Table 13:Average Compressive strength and modulus for sandwich composite with different compaction ratio.
Compaction Ratio
Compressive strength avg.(MPa) Compressive Modulus avg.(MPa)
2.0 –C-(1&2) 2.89 270.285
2.5-C-(1&2) 6.31 458.44
3.0-C-(1&2) 9.27 473.17
Figure 21: Compressive Strength Versus Core Density
y = 45.571x - 24.832 R² = 0.9983
0 1 2 3 4 5 6 7 8 9 10
0.58 0.63 0.68 0.73 0.78
Compressive Strength (MPa)
Core Density , g/cm3
Figure 22 : Compressive Modulus versus core Density
4.3.2 Failure Behavior during Compressive test
Typical flexural load versus displacement with photographs (Figure 23, 24,and 25)captured from the testing videos show failure sequences for several specimen configurations with compaction ratio of 2.0, 2.5, and 3.0. In general, the curves appear to have similar characteristics, each displaying a linearly increasing part before the peak point, then a sudden drop due to core failure at the outer edge. The first peak indicates before the cracking of the core. After the peak load, the core material is started to de- bonding and lose in carrying the load. It was also observed that, as the core density was increased compressive strength of the sandwich composite was also increased (Figure 21) because of the high density of the core, as expected.
(a) Initial (b) Start to de-bonding core (c) Increasing de-bonding
35
y = 1449.2x - 584.81 R² = 0.8041
150 200 250 300 350 400 450 500 550 600
0.58 0.63 0.68 0.73 0.78
Compressive Modulus (MPa)
Core Density,g/cm3
(d) Final failure
Figure 23 : failure pattern of composite specimen (2.0-C-1)
(a) Initial (b) Start de-b0nding core (c) Final Failure Figure 24 : failure pattern of composite specimen (2.5-C-1)
(a) Initial (b) Start cracking core (c) Final Failure Figure 25 :failure pattern of composite specimen (3.0-C-1)
4.4 Rockwell hardness test :
The hardness test of materials by the Rockwell hardness test method is measured by the depth of penetration of the indenter. at first select the load by rotating the knob and fix the suitable indenter .clean the test-piece and place n the special anvil or work table of the machine .turn the capstan wheel to elevate the test specimen into contact with the indent point .further turn the wheel for three rotations forcing the test specimen against in indenter .This will ensure that the minor load of 10 kg has been applied .Set the pointer on the scale dial at the appropriate position .Push the leveler to apply the major load .A dash pot provided in the loading mechanism to ensure that the load is applied gradually. As soon as the pointer comes to rest pull the handle in the reverse direction slowly .This release the Major, But not minor load .The pointer will now rotate in the reverse direction .The Rockwell hardness can be read off the scale dial .on the appropriate scale ,after the pointer comes to rest
(a) (b) Figure 26 : (a) & (b) Rockwell hardness test
Table 14 : Data of Rockwell hardness test :
Test no. scale Material used
Indentor used
Load Applied/kg
RHN Avg.
RHN Minor Major
1 C
JFRP & CF Skin Diamond
10 140 75
2 C 10 140 78 76
3 C 10 140 75
37
4.5 Skin Impact Testing :
Impact test is a test used in studying the toughness of materials. The definition of toughness is defined as the capacity of materials to absorb energy and deform plastically before fracturing.
Toughness is associated with both ductility and strength of materials.
At First the dimensions of the unnotched length and the thickness of specimen are measured. Then pendulum is raised to the left unit it indicates the maximum energy range on the upper indicator unit. The specimen is placed horizontally across support with the notch away from the pendulum .then pendulum released. The indicated value from the indicator unit is recorded. Then brake is applied until the pendulum has returned to its stable hanging vertical position. At last specimen is removed from the testing area and failure surface is observed.
(a) Impact Testing Machine (b) Condition After Testing Figure 27 : Impact Testing Machine & Materials Condition after testing Table 15: Data of impact test :
Materials
Energy absorbed
for Charphy
(J)
Average (J)
Energy absorbed
for Izod (J)
Average (J)
JFRP & CF Skin
14.5
14.63
10.2
10.2
14.6 10.6
14.8 10.0
38
Chapter 5 Conclusion and Future Recommendations
5.1
Conclusion
Sandwich composites using expanded perlite/epoxy-based core and JFRP & CF as skin by varying the core density were fabricated .The manufactured composite’s flexural and compressive properties were investigated along with the failure mechanism. The findings of the work can be summarized as -
• The flexural and compressive behavior of the sandwich structure is highly dependent on the core density.
• Crack initiated in the expanded perlite core of the sandwich structure during the flexural test and delamination is found to be the catastrophic failure.
• Some local indentation failure of the core was noticed due to skin distortion during the flexural test. Skin failure was noticed during Hardness and Skin Impact Test.
• The load-carrying capacity of the sandwich structure was increased about 1.5- 1.91 times for flexural and 2.35-3.20 times for compression due to a change in core density.
• Energy absorption during flexural test was decreased with increasing core density and it increased with increasing core density during compression test.
5.2 Future Recommendations
Further research could be done on these types of sandwich composites are,
i. The skin's strength could be improved by adding some high-strength fiber mat, including glass, and Kevlar, instead of JFRP & CF..
ii. Adding some high-strength constituent materials with the expanded perlite could enhance the stiffness and reduce the tendency of catastrophic failure of the core.
iii. Better compaction and air removal techniques could be used to improve core density and reduce skin bubble formation.
39
References
[1] Zenker and Dan, "An Introduction to Sandwich Structures," in An Introduction to Sandwich Structures,1995, pp. 1.2-1.3.
[2] Z. Li and J. Ma, "Experimental Study on Mechanical Properties of the Sandwich Composite Structure Reinforced by Basalt Fiber and Nomex Honeycomb," MDPI,p.1870,2020.
[3] A.Rekaandet.al,"Chemical,mineralogical and structural features of native and expanded perlite from Macedonia,"GeologiaCroatica,vol.72, no.
3,pp. 215-221, 2019.
[4] "Perlite Insulation Boards & Pipe Sections, "Wedge India, [Online]. Available :https://www.wedge-india.com/perlite- insulation-boards.
[5] H. Chandekar, V. Chaudhari and S. Waigaonkar, "A review of jute fiber reinforced polymer composites, "Elsevier Ltd., pp. 2214-7853, 2020.
[6] S. Pradhanandet .al, "Insight on the Chemistry of Epoxy and Its Curing for Coating Applications: A Detailed Investigation and Future Perspectives," Polymer-Plastics Technology and Engineering, pp. 862-877, 2016.
[7] Krzyhak and et.al, "Sandwich Structured Composites for Aeronautics:
Methods of Manufacturing Affecting Some Mechanical Properties, "
Hindawi Publishing Corporation, vol. 2016, no. 7816912, p. 10, 2016.
[8] M. Mohamed and et.al, "Manufacturing and characterization of polyurethane-based sandwich composite structures," Elsevier, vol. 123, pp. 169-179, 2015.
[9] "A new approach to manufacturing biocomposite sandwich structures:
mycelium-based cores," International Manufacturing Science and Engineering Conference,p.8864,2016.
[10] J.L.A. Isaac M.Daniel, "Fabrication, testing and analysis of composite sandwich beams,"ELSEVIER, pp. 2455-2463, 2000.
[11] P.W.et.al,"Experimental and numerical evaluation of the flexural
properties of a stitched foam-core sandwich structure," ELSEVIER, pp.
243-248, 2013.
[12] M. Hassan and et.al,"The influence of core density on the blast
resistance of foam-based sandwich structures," Elsevier, vol. 50, pp. 9- 16, 2012.
[13] N. R. R. Anbusagar, P. K. Giridharan, and et.al, "Mechanical Behavior of Glass-Jute Sandwich NanoPolyester Composites to Flexural and Impact Loading," European Journal of Scientific Research, vol. 84, no.
2, pp. 148-155, 2012.
[14] S.B.S,S.A.R and et.al, "Mechanical Characterization Of Polyurethane Foam And Hybrid Natural Fiber Based Sandwich Composite," Palarch’s Journal Of Archaeology Of Egypt/Egyptology,vol. 17, no. 9, pp. 5588- 5604, 2020.
[15] M. Arifuzzaman and H.S.kim,”Novel Flexural behavior of sandwich structures made of perlite foam/sodium silicate core and paper skin “ Construction and building materials, Elsevier ,vol.148,pp.321-333-2017.
[16] X.Wang ,X.-I .Shi and et.at, “Bending behaviors of three grid sandwich structures with wood facing and jute fabrics/epoxy composite
cores,”composite structures,vol,252,p.
41