FINGERPRINT ENHANCE RECOGNITION SYSTEM FOR BIO-METRIC
AUTHENTICATION
A Project and Thesis submitted in partial. fulfillment of the requirements for the Award of Degree of
Bachelor of Science in Electrical and .Electronic Engineering
by
MD. SADDAM HOSSAIN
ID #: 171-33-3911
MD. KAISAR AHMMED
ID #: 171-33-411
Supervised by
ENGR. MD. ASHRAFUL HAQUE
Assistant Professor Department of EEE
D
EPARTMENT OFE
LECTRICAL ANDE
LECTRONICE
NGINEERINGF ACULTY OF E NGINEERING
DAFFODIL INTERNATIONAL UNIVERSITY
October 2020
Certification
This is to certify that this project. and thesis entitled “Fingerprint Enhance Recognition System For Bio-Metric Authentication” is done by the following students under my direct supervision. and this work has been carried out by them in the laboratories of the Department of Electrical and Electronic Engineering under the Faculty of Engineering of Daffodil International University. in partial fulfillment of the requirements for the. degree of Bachelor of Science in Electrical and Electronic Engineering. The presentation of the work was held on 18 October 2020.
Signature of the candidates
_____________________
Name: Md. Saddam Hossain ID #: 171-33-3911
________________________
Name: Md. Kaisar Ahmmed ID #: 171-33-411
Countersigned
_______________________
Engr. Md. Ashraful Haque Assistant Professor
Department of Electrical and Electronic Engineering Faculty of Science and Engineering
Daffodil International University.
The project and thesis entitled “ Fingerprint Enhance Recognition System For Bio- Metric Authentication,” submitted by Md. Saddam Hossain and Md. Kaisar ahmed, ID No:171-33-3911, ID No: 171-33-411, Session: Spring 2020 has been accepted as satisfactory in partial fulfillment of the requirements for the degree of Bachelor of Science in Electrical and Electronic Engineering on 18 October 2020.
BOARD OF EXAMINERS
____________________________
Dr. Engr. … Chairman
Professor
Department of EEE, DIU
____________________________
Dr. Engr. --- Internal Member
Professor
Department of EEE, DIU
____________________________
Dr. Engr. --- Internal Member
Professor
Department of EEE, DIU
Dedicated to
Our Parents
CONTENTS
List of Figures vii
List of Tables vii
Acknowledgment vii
Abstract ix
Chapter 1: INTRODUCTION 1-4
1.1 Introduction 1
1.1.1 Historical Background Of Research 1
1.1.2 Overview 2
1.2 Problem Statement 3
1.3 Objectives 4
1.4 Research Methodology 4
Chapter 2: BIOMETRICS AUTHENTICATION
5-12
2.1 Introduction 5
2.2 Techniques Of Biometrics Authentication 5
2.3 Working Process Of Biometric Technology 6
2.3.1 Enrollment 6
2.3.2 Verification 7
2.3.3 Identification 8
2.4 Existing Biometric Technology 8
2.4.1 fingerprint Recognition 9
2.4.2 Fingerprints In Biometric Authentication 9
2.4.3 Minutiae 10
Chapter 3: THEORETICAL MODEL 13-16
3.1 Introduction 13
3.2 Image Binarization 13
3.3 Ridge Thinning 14
3.4 Minutiae Marking 15
3.5 Summary of the chapter 16
Chapter 4: IMAGE QUALITY ASSESSMENT 17-33
4.1 Introduction 17
4.2 Importance Of Quality Measure 17
4.3 Methods To Evaluate Image Quality 17
4.3.1 Mean Squared Error (MSE) 18
4.3.2 Peak Signal To Noise Ratio (PSNR) 18
4.3.3 SSIM 18
4.5 FILTER 20
4.6 Database 23
4.7 Program 27
Chapter 5: RESULTS AND DISCUSSIONS 34-36
5.1 Introduction 34
5.2 Results 35
5.6 Summary 36
Chapter 6:
DISCUSSION AND CONCLUSION
37-38
6.1 Discussion 37
6.2 Conclusion 37
References 38
LIST OF FIGURES
Figure # Figure Caption Page #
2.1 Fingerprint authentication process 6
2.2 Regions of fingerprint 10
2.3 Image with minutiae 11
2.4 Different types of ridges 12
3.1 Binarize image 14
3.2 Thinning image 15
3.3 Minutiae marking process 16
4.1 Reference image 27
4.2 Binarize output image 27
4.3 Thining output image 28
4.4 Filtered image 29
4.5 Supressed image 30
4.6 Bifurecated image 32
5.1 Flow chart of evaluation image quality
LIST OF TABLES
Table # Table Caption Page #
4.1 Values of MSE, PSNR & SSIM 35
ACKNOWLEDGEMENT
First of all, we give thanks to Allah or God. Then we would like to take this opportunity to express our appreciation and gratitude to our project and thesis supervisor Engr. Md.
Ashraful Haque, Assistant professor of Department of EEE for being dedicated in
supporting, motivating and guiding us through this project. This project can’t be done without his useful advice and helps. Also thank you very much for giving us opportunity to choose this project.
We also want to convey our thankfulness to Dr. Engr. Name, Professor and Chairperson of the Department of EEE for his help, support and constant encouragement.
Apart from that, we would like to thank our entire friends for sharing knowledge; information and helping us in making this project a success. Also thanks for lending us some tools and equipment.
To our beloved family, we want to give them our deepest love and gratitude for being very supportive and also for their inspiration and encouragement during our studies in this University.
ABSTRACT
Human fingerprints are rich in details called minutiae, which can be used as identification marks for fingerprint verification. The goal of this thesis to develop image quality through improves PSNR, MSE & SSIM for fingerprint verification through extracting and matching minutiae. Measurement of image quality is important for many image processing applications. Image quality assessment is closely related to image similarity assessment in which quality is based on the differences (or similarity) between a degraded image and the original, unmodified image.
There are two ways to measure image quality by subjective or objective assessment.
Subjective evaluations are expensive and time-consuming. It is impossible to implement them into automatic real-time systems. Objective evaluations are automatic and mathematical defined algorithms. Well-known objective evaluation algorithms for measuring image quality include mean squared error (MSE), peak signal-to-noise ratio (PSNR), and structural similarity (SSIM). MSE & PSNR are very simple and easy to use.
Various objective evaluation algorithms for measuring image quality like Mean Squared Error (MSE), Peak Signal-To Noise Ratio (PSNR) and Structural Similarity (SSIM) etc. have been studied and their results are compared.
CHAPTER 1
INTRODUCTION
1.1 Introduction
The fingerprint verification system was one of the most i effective i andI well-known formsi of biometrics, usually used to automatically verify or authenticate a person's identity through automated systems. This is iachieved by comparing the fingerprint features of two people with match power. It helps in verifying the identity claimed by an individual iand is closely related to the techniques used in iapplications such as access control isystems. Scientific research has shown ithat fingerprints are surprisingly unique; There are no two people in the whole iworld iwith the same kind of details, not even identical itwins. Fingerprints are permanent, integral to a person, except that they are damaged by fear, fingerprints remain the same from birth to ideath. This unique fingerprint feature used to identify individuals helps provide instant biometric solutions to existing iproblems with traditional securityi access control systems of locks and keys that could be stolen or i forged, PIN codes or passwords that can be i forgotten or heard, and RFID cards without any forged identification. Can use an intruder.
Fingerprint analysis for matching purposes usually requires a comparison iof some important features of ithe fingerprint pattern. These include fingerprint ipatterns such as arches, loops, and vortices that are a combination of Chavez and Minutia points.
Scientists have discovered that each family member often bears the same fingerprints.
Patterns can be inherited This is the basis of common belief.
This chapter provides a brief overview of the study, including the historical background of the study, the research issues, and the key contributions presented.
1.1.1 Historical Background Of Research
The history of fingerprinting began its use in criminal activities. Consistent with historians, the Babylonians pressed their fingers into the wet soil to record business
2
transactions. This Chinese custom-made strategy, however, works with its profits as a single mark as an abusive ink on paper to conduct business transactions and determine their youth. Even many years later, the application was still in use once, in 18, AN English, then known as Sir William Herschel, the then Chief Justice of Hooghly District, Jangipur, India, required residents to record a fingerprint once in the language of their business documents. It was on this basis that Henry Faulds, a Scottish physician, came up with the idea. Physicians, while operating in Japan, discovered fingerprints on ancient clay items. In 1880, Fouldes wrote a letter to Darwin to facilitate his organization. Darwin refused at the time but sent the request to Sir Galton. Galton was a young scientist, the World Health Organization gathered a great deal of knowledge on the physical characteristics of individuals so that the mechanics behind ithe inheritance of igenetic traits could work. After collecting 7,000 fingerprint isamples, Galton revealed that his book "Fingerprints" would become the earliest fingerprint company in history throughout 1982. The system may not look stylish at the time, but its flaw survives. At the same time, others around the world had the same idea when the cep released "Fingerprints", a Frenchman named Bartillon was performing on his own system, involving hands, feet and other sutures. This practice, called mastication, was adopted by the British people in the nineties by the Indian police in Argentina. Once known for helping to investigate the murder of 2 boys in a passing village near the Argentine capital, his system competes with a pole half. Once samples were verified from the crime scene, she was identified as the killer, Francisca Rojas, the son's mother, she confessed to the crime and was born comparative dactyloscopy
1.1.2 Overview
The word "biometrics" comes from the Greek words "bio" (existence) and "matrix"
(to measure). Some of the best biometric structures have come on the market quite a long time ago, a way of making significant progress in computer systems. Several of these new gadget-driven strategies, however, supported the concept of rectangular degree support that was originally planned much earlier than the whole. The concept of bioscience has changed as a gift for many years now. Within the Ordnance Century, China practiced fingerprinting to separate merchants and their children from others. Fingerprints are used nowadays.
● In the nineteenth century, Anthropologist Alphonse Bertilion, an associate degree sociologist, developed a technique for measuring the bodies of individuals (known as Bertiliones). Stays. This technique has declined rapidly because it has been found that people with the same body measurements are often mistakenly taken together. Then, Richard Edward Henry of Scotland Yard developed a strategy for the process.
● The retina detection plan was devised in 1935 by Dr. Carlton Simon and Dr.
Isador Goldstein. In 1976, a research iand development ieffort iwas conducted at the postgraduate INC. The primary industrial retina scanning system was created in 1981.
● Iris recognition iwas invented in 1993 by John Dogman at Cambridge
● In 2001, a biometric automated itoolset (BAT) was introduced iin Kosovo, offering a concrete detection.
Today, biometric has got to return up as an independent ifield of study with iprecise technologies of building personal iidentities. [ 3 ]
1.2 Problem Statement
Reliable personal authentication ischemes are required to verify or idetermine the identity of iindividuals requesting their iservices across a wide variety of systems. The purpose of such schemes is to ensure that ithe render services are accessed iby a legitimate iuser, and no one else. Examples of these systems iinclude secure access to buildings, computer isystems, laptops, cellular phones iand ATMs. In the absence of robust authentication schemes, these systems are risky for an impostor type. Dition has traditionally been used to restrict access to ipasswords (knowledge-based security) and ID icards (token-based isecurity) to the system. The main iadvantages of this traditional thematic personal identification are (i) they are very simple (ii) they can be easily integrated into different systems at low cost. However, this method is not based on a person's inherent qualities to create a ipersonal identity, so tokens can be lost, stolen, iforgotten, or misplaced; PIN forgotten ior hypocrites can guess. Disclosure of a password to an unauthorized user or theft of a card by an impostor can ieasily violate security ion these systems; Further, simple passwords are easy to guess (by an incorrect person) and hard passwords (by a legitimate user) are difficult to retrieve. So they are iunable to meet the security irequirements of our Electronic Connected Information Association. The rise of biometrics has solved the problem of sorting out traditional theoretical verification.
4
1.3 Objectives
On the bases of those iideas the goal of ithis thesis work is to match objective image quality matrices for iimage assessment and their analysis which will automatically predict iimage quality. Image quality iassessment is closely associated with iimage similarity iassessment. So, the emphasis during this thesis are on image fidelity, i.e., however shut a picture to given original or reference image. Some commonly used ways to evaluate image quality.
1.4 Research Methodology
The new image quality imetric has been designed to be exploited in the iMATLAB software package. iMatlab is a powerful, all-purpose, mathematical isoftware package.
iMatlab has great graphics and matrix handling icapabilities. It integrates imathematical computing over ipowerful languages to provide a versatile environment for technological computing. The main options of Matlab Square measure its built-in mathematical toolbox and graphic functions. Also, external routines that are written in different languages such as iC, iC ++, iFortran and iJava can be iintegrated with iMatlab applications. iMatlab supports iimporting files and data from various external idevices.
Most iof the functions of iMatlab Square are matrix-based measurements and can work in arrays of any acceptable dimensions. Matlab also includes a separate tool chest for image processing applications, which provides simple solutions to a number of problems compared to this analysis, complete step-by-step objective image matrix.
Step 1: Several algorithms have already been developed for measuring image quality.
Among the average Square Error i(MSE), iPeak Signal to Noise Ratio i(PSNR), Average Difference i(AD), iMaximum iDifference (MD), Universal Image iQuality Index i(UIQI), and Structural Harmony Index Metric i(SSIM) The initial step is to review the metrics. This is done through a literary survey. This istep is to analyze their
isignificance. It is an in-depth study of the advantages and disadvantages of their individual contributions and methods in the formulation of parameters used
Step 2: The second step iis to simulate the methods i(MSE, iPSNR).
Step 3:Execute the methods iwith some standard iimages. The images are first corrupted with idifferent kind of noise.
CHAPTER 2
BIOMETRICS
AUTHENTICATION
2.1 Introduction
Biometrics authentication refers ito techniques that believe in imeasurable physiological and distinctive features that will be iautomatically verified. In a nutshell, each or all of us have individual characteristics that will be used for specific identification, as well as a fingerprint, a membrane pattern, and voice features. Visual or 2-Quality Authentication - 1 of the 1 things you recognize is characterized by two of its own features (for example, ia password), i(for example, ia swipe card), or it (for example, a fingerprint) - is becoming secure A truly common addition to the computing environment. The computer ianalyzes your fingerprint to idetermine who you are and, based on iyour identity followed by ia pass code or pass phrase, allows you different levels iof access. Access levels can include the ability to iopen sensitive files, to iuse credit card information ito make electronic ipurchases, and so on.
2.2 Techniques Of Biometrics Authentication
Biometric authentication is truly a ipattern-recognition that creates a ipersonal
iidentification determined by the belief in a specific physiological or behavioral trait held by ithe user. A personal matter is understandable but is being raised with an intelligent approach to determining whether a personal is understood. Authentication is often divided into 3 modules:
a.) Enrollment module b.) Verification module c.) Identification.
2.3 Working Process Of Biometric Technology
The registered module
Throughout the enrollment, a person's biometric feature is scanned by a biometric reader to provide a raw digital image of the feature. Thus for the convenience of the mill, the raw digital image is
but returned with a more compact image than the one referred to as a model.
Depending on the instrument, the model also puts in the central data. Depending on the application, Bioscience is going to be emplo
verification or detection. Verification to verify the identity of a person Health Organization they say they person’s identity—that
technology resides in completely different features, all biometric systems with a collaborative ienrollment stage and follow a uniform stage that will use
iverification or identification.
Figure2.1: Fingerprint authentication process 2.3.1 ENROLLMENT
In enrollment a biometric system is trained to identify specific individuals. The 1st person provides an identifier like the card. Biometric identification is attached to the identity according to the document. He then presents the biometric (e.g., finger
6
Working Process Of Biometric Technology
The registered module iis responsible ifor enrollment in the biometric i
Throughout the enrollment, a person's biometric feature is scanned by a biometric reader to provide a raw digital image of the feature. Thus for the convenience of the mill, the raw digital image is usually more processed by the feature extractor but returned with a more compact image than the one referred to as a model.
Depending on the instrument, the model also puts in the central data. Depending on the application, Bioscience is going to be employed in one of 2 modes:
verification or detection. Verification - also referred to as authentication to verify the identity of a person - to prove that people are the unit of the World
rganization they say they iare. Identification iis used to establish that iis, to determine who a person is. Although biometric technology resides in completely different features, all biometric systems
enrollment stage and follow a uniform stage that will use verification or identification.
Figure2.1: Fingerprint authentication process
In enrollment a biometric system is trained to identify specific individuals. The 1st person provides an identifier like the card. Biometric identification is attached to the identity according to the document. He then presents the biometric (e.g., finger
isystem.
Throughout the enrollment, a person's biometric feature is scanned by a biometric reader to provide a raw digital image of the feature. Thus for the convenience of
usually more processed by the feature extractor but returned with a more compact image than the one referred to as a model.
Depending on the instrument, the model also puts in the central data. Depending yed in one of 2 modes:
also referred to as authentication - is used to prove that people are the unit of the World
d to establish ia Although biometric technology resides in completely different features, all biometric systems istart
enrollment stage and follow a uniform stage that will use
In enrollment a biometric system is trained to identify specific individuals. The 1st person provides an identifier like the card. Biometric identification is attached to the identity according to the document. He then presents the biometric (e.g., finger tips,
hand or iris) on a purchasing device. Individual alternative zone units are stabilized and one or more sample zone units are lifted, encoded and kept as a reference guide for future comparisons. iDepending on the technology, biometric isample images can also be collected as a recording or a record of attached dynamic measurements.
However biometric systems extract options and provide inscriptions and information in the guide in the system vendor-owned algorithm or the size of the template depends on the vendor and therefore differs in technology. Templates are often placed remotely within a central data or biometric reader device; Their small size allows them to be stored on extra sensitive icards or tokens. iMinute changes in position, distance, ipressure, atmosphere, and alternative factors affect the generation of the guide. As a result, every time a person's biometric data area unit is captured, the new template is probably going to be unique. Calculating on a biometric system, biometric data may often have to be gifted to enroll someone's name. Either the reference guide can present a combination of information captured later or many listed templates can also be placed. The value of guides or itemplates is important to the ioverall success of biometric applications. Biometric options will improve over time, forcing individuals to re-enroll to update their reference guides. Some technology will update the reference guide to match activities. The method of enrollment ialso depends on the
iquality of ithe symbol that the soul represents. iThe reference guide is linked to an identity to the identification document. If the iidentification document does inot specify the ireal identity of the person, the reference guide is going to be attached to a false identity.
2.3.2 VERIFICATION
The final outline of this chapter goes here.
In the verification system, the step during enrollment is that anyone or he claims (e.g., the name registered) he verifies the UN agency when the person provides the associate symbol, the biometric is provided, the biometric system captures, supports an evolving algorithm Effort creates templates. The system then icompares the test biometric itemplate with this person's reference itemplate, which is listed in the system to idetermine if a person's judgment is tested and if the templates match. Verification is usually referred to as a 1: 1 (one-to-one) match. The verification system will have databases ranging from dozens to logged registered temples but the field unit was
8
predicted to be matched with the biometrics provided along with its collaborator as opposed to his or her reference itemplate. Almost all verification systems will make a match-no-match call but render in a second. One of the most icommon applications of
iverification as a whole may be a system that requires employees to reveal their claimed identities before they can isecure buildings or access computers.
2.3.3 Identification
In the detection system, the step after enrollment is that person is Unlike the spot verification system, no identifier is provided. To find a match, the person identifies the reference itemplate and compares the test itemplate with all the individual reference templates registered in the system instead of comparing it with the biometrics presented. The region of the detection system matches the unit as 1: M (one-to-M, or one-to-many) because individual biometrics are icompared to multiple biometric
itemplates in the system's idatabase. There are 2 forms of detection system: positive and inegative. Identification system area unit designed to ensure that a person's biometric information is registered. The expected results in attendance can be a match. A common positive identification system icontrols access to a secure ibuilding or secure computer by ichecking anyone seeking access through the WHO, in contrast to information received from registered staff. The goal is to determine if anyone seeking access can register with the system. The Negative Identification System Area Unit is designed to ensure that a person's biometric information is not present at any time. No description matches the expected result. Comparing a person's biometric data with all WHO data registered during the public benefits program will ensure that the person is not "double-dipped" by documentation of exploitative fraud for registration under imultiple identities. Another form of inegative identification system is the watch ilist system. Such systems are designed to spot people on the surveillance list and alert the authorities for acceptable action. For all ipeople, the system allows them to see that they are not on the watch list and allows them to pass normally.
Those who have biometrics in the data on this system cannot voluntarily provide them. For a surveillance system, for example, biometrics can be captured from mug shots provided by law enforcement agencies.
2.4 Existing Biometric Technology
There are many biometric itechnologies that have been planned over the ipast few years, but in the last five years alone the leading ones have turned out to be a lot wider deployments. Some technologies are more suitable for specific iapplications than
others iand are acceptable to a few users. We can describe iseven top biometric technologies:
● Facial Recognition
● Fingerprint Recognition
● Hand iGeometry
● Iris Recognition
● Signature Recognition
● Speaker Recognition
2.4.1fingerprint Recognition
Fingerprint recognition is ione of the most effective known and most used ibiometric technologies. Automated systems ihave been commercially iacceptable since the early nineteen seventies and during our study, we have a tendency to find there are seventy- five fingerprint irecognition technology companies. Until recently, fingerprint
irecognition was used primarily in applications. Fingerprint irecognition technology extracts the feature from iimpressions created by distinct widths above the fingernail.
iFingerprints will be flat or rotated. Captures the effect of a completely central location between a flat print tip and the 1st knuckle; A rotating print captures the capture on either side of the finger. An image of the fingerprint is captured by the scanner, enlarged and reproduced into a itemplate. iScanner itechnologies will be optical, silicon or ultrasound technology. Ultrasound, where it is probably the most accurate, is not uncommon in wide use. In 2002, we discovered that optical scanners were commonly used. Throughout the improvement, idirt, icuts, stains and creases or dry, iwet or worn fingerprints have decreased, and the definition of agility has also increased. Vendors base their algorithms on the extraction of points of trivial matters related to breaks in the holes of their fingerprints. Different algorithms support square measurement extracting ridge patterns.
2.4.2 Fingerprints In Biometric Authentication
The area unit of fingerprints is considered to be unique to people and to the ifingers of the same person. Even identical itwins having the same DNA, the region unit is believed ito possess completely idifferent fingerprints. Historically, fingerprint patterns are extracted by creating a degree of ink print associated with the fingerprint on the paper. The electronic age introduced various compact sensors that provided digital images of ithese patterns. These sensors can only be integrated into existing PC peripherals such as a imouse or keyboard i(figure), making this mode of detection a highly attractive proposition. This has led to an increase in the use of fingerprint-
based authentication systems automatically in every civil application.
Typically, the iglobal configuration described by the
work in the Fingerprint section, where the distribution of Mintia points is assigned to find and match between 2
which match a query print with huge print data (this will carry it with millions of prints), think about the patterns inside the query image (fingerprint indexing) and a specific match (finger) to slide their search into the database Imprint Matching) The pattern of on-ridge flow in minute points to work never matches fingerprints by itself [4]
2.4.3 Minutiae
In fingerprinting terms, minutiae ar the points of
ibifurcations (a ridge rending into two) and ridge
10
based authentication systems automatically in every civilian and applicable
Figure2.2: Regions of fingerprint
global configuration described by the iridge structure is assigned to work in the Fingerprint section, where the distribution of Mintia points is assigned to between 2 ifingerprints. Automatic fingerprint iidentification systems, which match a query print with huge print data (this will carry it with millions of prints), think about the patterns inside the query image (fingerprint indexing) and a h (finger) to slide their search into the database Imprint Matching) The ridge flow in minute points to work never matches fingerprints by itself
In fingerprinting terms, minutiae ar the points of iinterest during a finge bifurcations (a ridge rending into two) and ridge iendings.
ian and applicable
ridge structure is assigned to work in the Fingerprint section, where the distribution of Mintia points is assigned to identification systems, which match a query print with huge print data (this will carry it with millions of prints), think about the patterns inside the query image (fingerprint indexing) and a h (finger) to slide their search into the database Imprint Matching) The ridge flow in minute points to work never matches fingerprints by itself.
interest during a fingerprint, like
Different types of ridges are:
a.) ridge endings – a iridge that ends short
b.) ridge bifurcation – one ridge that divides into 2 ridges c.) short iridges, island or freelance
distance then ends
d.) ridge enclosures – one continue as one ridge
e.) spur – a bifurcation with a brief
f.) crossover or bridge – a brief ridge that runs between 2 parallel Figure2.3: Image with minutiae Different types of ridges are:
ridge that ends short
one ridge that divides into 2 ridges
idges, island or freelance iridge – a iridge that commences, travels a brief one iridge that bifurcates and reunites shortly afterward to a bifurcation with a brief iridge branching off a extended ridge
a brief ridge that runs between 2 parallel iridges
ridge that commences, travels a brief ridge that bifurcates and reunites shortly afterward to
12
Figure2.4:Different types of ridges
CHAPTER 3
ANALYSIS AND SIMULATION
3.1 Introduction
Improving the fingerprint image is used to clear the image for more extra activity.
Since fingerprint images obtained from scanners or other media are of excellent quality, they do not seem to be reassured with augmentation methods, due to insufficient amount of ink to widen the gap between ridals and valleys and to attach false broken points in canals. Very helpful. Originally, the advanced step was supposed to be done using clever edge identifiers. After examination, however, it is found that the result of an edge detector is an image with the boundary of the regidus.
Filling sizes using edge detection requires the employment of additional steps that can take a lot of processing time and increase the complexity of the code.
3.2 Image Binarization
The binaryization move makes the most obvious statement, that the factual information obtained from the print is only bilateral; Elite vs. Valley prints are taken as grayscale images, so it is a very necessary step in the process of lifting ridges, so knowing that they are fraudulently differentiates sharply. Image that provides equivalent information. So, ibinarization transforms the iimage from a 256-level iimage to a 2-level image that gives the same iinformation. Typically, an iobject's pixel is given a ivalue of "1" while a background ipixel is given a value of "0." The value is given Finally, a ibinary image is created by icoloring each pixel white or black based on the label of the pixel (black for zero, white for 1) bin Threshold (Global Throholding) cannot be selected Image.in is performed to bifurcate, the image is divided into blocks (16x16), and the average intensity value for each board is calculated, then each pixel is converted to one if its intensity value is greater than the average intensity value of the current block relative to the pixel. [1]
3.3 Ridge thinning
Ridge thinning is the removal of useless pixels of ridges until the ridges are only one pixel wide. The associate degree is careless, parallel thin formulas are employed. In each scan of the total ifingerprint image, the
(3x3) and finally removes all these marked pixels after a few scans. The thin
filtered by various sized activities to get rid of some H brakes, isolated points and spikes.
During this step, any single points, be they
an episode, will be deleted and the process will be considered.
14
Figure3.1: Binarize image
is the removal of useless pixels of ridges until the ridges are only one pixel wide. The associate degree is careless, parallel thin formulas are employed. In each scan of fingerprint image, the rule marks redundant pixels in each ismall image window (3x3) and finally removes all these marked pixels after a few scans. The thin
filtered by various sized activities to get rid of some H brakes, isolated points and spikes.
tep, any single points, be they isingle-point races or single point breaks during an episode, will be deleted and the process will be considered..[4]
is the removal of useless pixels of ridges until the ridges are only one pixel wide. The associate degree is careless, parallel thin formulas are employed. In each scan of small image window (3x3) and finally removes all these marked pixels after a few scans. The thin iridge map is filtered by various sized activities to get rid of some H brakes, isolated points and spikes.
point races or single point breaks during
3.4 Minutiae Marking
After the ifingerprint ridge thinning, marking The idea of a Crossing number
general, for ieach 3x3 window, if the central specifically three one-value
one-value neighbor, then the central pixel is a
= = 1 it’s a iridge end and if Cn(P) = = 3 it’s a ridge Figure3.2: Thining image
3.4 Minutiae Marking
fingerprint ridge thinning, marking iminutiae points is comparatively simple.
The idea of a Crossing number i(CN) is widely used for extracting the
each 3x3 window, if the central picture element is one and has value ineighbors, then the. If the central pixel is 1 and has only 1 value neighbor, then the central pixel is a iridge ending, i.e., for a pixel P, if Cn(P)
ridge end and if Cn(P) = = 3 it’s a ridge ibifurcation point.
points is comparatively simple.
(CN) is widely used for extracting the iminutiae. In picture element is one and has central pixel is 1 and has only 1 pixel P, if Cn(P)
16
(a) (b)
(c) (d) Figure3.3: (a), (b), (c), (d) minutiae marking process
The value of both the top pixel is 1 and at the same time there is another neighbor outside the 3x3 window of the right pixel which is marked as a branch, but in reality only 1 branch is located in a small area so check routine does not add value to both a branch and the branch neighbors. Also, the average intermediate width D is the easiest way to estimate the common D value calculated at this level. Scan a row of thin ridge images and add all the pixels in a row with one of the values. Then divide the length of the row by the shortest edge to get an interstitial width. For more accuracy, this type of row scan is performed in a variety of rows and icolumn scans, finally, iall the
iinter-drawing widths together Minutia identifies, there is no labeled unique ID for all the thin ridges of the fingerprint image operation. [4]
CHAPPTER 4
IMAGE QUALITY ASSESSMENT
4.1 Introduction
Image quality can be compromised in most systems of understandable importance.
Digital images underwent massive disasters throughout iacquisition, processing, storage, itransmission, and copying, all of which could lead to a deterioration of visible quality.
4.2 Importance Of Quality Measure
We know the importance of the quality of pictures and videos and the price-quality balance associated with it, the apparent question that arises is why we want to measure quality. The solution is simple and will be illustrated by a few examples. If a designer plans this high-end TV and is interested in understanding what the value curve looks like, he or she clearly wants a style to determine the quality of the output video after running his or her style at a certain configuration cost for a particular company's accounting. In other situations, the designer of a medical imaging device may want to conclude that 2 different X-ray devices give higher results. He also wants some way to scientifically compare the values of the 2 methods. Basically, qualitative evaluation algorithms are basically required for 3 types of applications:
1. For optimization ipurpose, where one maximize quality iat a given cost.
2. For icomparative analysis between different ialternatives.
3. For quality monitoring in real-time applications.
4.3 Methods To Evaluate Image Quality
Some commonly used methods to evaluate image quality are given below:
(i) Mean Squared Error (MSE)
(ii) Peak Signal to Noise Ratio (PSNR) (iii) Structural Similarity (SSIM)
4.3.1 Mean Squared Error (MSE)
An obvious method of measuring this similarity is to calculate the error signal subtracting the check signal from the reference and calculating the average strength of the error signal. Average
widely used, full-reference image quality mascara.
signal process and is outlined as follows:
MSE=
Where x(i, j) represents the original (reference) image and
distorted (modified) image and i and j arethe pixel position of the M×N image. MSE is zero when x(i,j) = y(i, j
4.3.2 Peak Signal To Noise Ratio
Peak ratio, commonly abbreviated to PSNR, is an engineering term for the ratio between the maximum achievable strength of a signal and the strength of the transmitted sound that affects the fidelity of its image. W
truly broad dynamic variations, PSNR is usually expressed in terms of the index DB scale. The PSNR is assessed in decibels and is inversely proportional to the average square error. This is given by the equation:
4.3.3 SSIM
The difference between the various technologies of previously mentioned relevance, such as MSE or PSNR, is that these methods assume absolute error; Conversely, SSIM may be a perception
change in structural information, yet incorporates the activity of sensory activity, masking each brightness level and contrasting mask conditions. Structural information is the concept of the interdependence of pixels, especially after the concept is clearly closed. This dependence carries important
object within the ivisual scene. Brightness level masking can be one where image distortions (in this context) are less visible in bright areas, while contrast
matter where visible activity or "texture" in the image is visible where distortion is seen.
18
4.3.1 Mean Squared Error (MSE)
An obvious method of measuring this similarity is to calculate the error signal subtracting the check signal from the reference and calculating the average strength of the error signal. Average-Squad-Error (MSE) is the simplest and therefore the most
reference image quality mascara. This metric is usually utilized signal process and is outlined as follows:
) represents the original (reference) image andy(i, j) represents the distorted (modified) image and i and j arethe pixel position of the M×N image. MSE
j) .[5,9]
4.3.2 Peak Signal To Noise Ratio (PSNR)
Peak ratio, commonly abbreviated to PSNR, is an engineering term for the ratio between the maximum achievable strength of a signal and the strength of the transmitted sound that affects the fidelity of its image. While several signals result in truly broad dynamic variations, PSNR is usually expressed in terms of the index DB scale. The PSNR is assessed in decibels and is inversely proportional to the average square error. This is given by the equation:
The difference between the various technologies of previously mentioned relevance, such as MSE or PSNR, is that these methods assume absolute error; Conversely, SSIM may be a perception-based model that treats image degradation as perceived uctural information, yet incorporates the activity of sensory activity, masking each brightness level and contrasting mask conditions. Structural information is the concept of the interdependence of pixels, especially after the concept is clearly his dependence carries important iinformation about the structure of the visual scene. Brightness level masking can be one where image distortions (in this context) are less visible in bright areas, while contrast
ere visible activity or "texture" in the image is visible where distortion is An obvious method of measuring this similarity is to calculate the error signal by subtracting the check signal from the reference and calculating the average strength of Error (MSE) is the simplest and therefore the most This metric is usually utilized in
) represents the distorted (modified) image and i and j arethe pixel position of the M×N image. MSE
Peak ratio, commonly abbreviated to PSNR, is an engineering term for the ratio between the maximum achievable strength of a signal and the strength of the hile several signals result in truly broad dynamic variations, PSNR is usually expressed in terms of the index DB scale. The PSNR is assessed in decibels and is inversely proportional to the average
The difference between the various technologies of previously mentioned relevance, such as MSE or PSNR, is that these methods assume absolute error; Conversely, based model that treats image degradation as perceived uctural information, yet incorporates the activity of sensory activity, masking each brightness level and contrasting mask conditions. Structural information is the concept of the interdependence of pixels, especially after the concept is clearly information about the structure of the visual scene. Brightness level masking can be one where image distortions (in this context) are less visible in bright areas, while contrast imasking is a ere visible activity or "texture" in the image is visible where distortion is
The inspiration behind the structural matching method for measuring image quality is that HVS images are not designed to detect imperfections and "errors". Instead, HVST has evolved in such a way that it recognizes visual patterns so as to be able to find structures or connections to natural images. Based on this observation, it is realized that a helpful perceptible quality metric will emphasize the visual structure over lighting effects. The idea that image metrics would be created based on this philosophy was initially explored and so it was modified, applied, evaluated and improved in contrast to struct and an image. Conversely, the structural approach is sensitive to distortions that break down natural spatial relationships such as blasts, the art of block compression, and noise in an image. As described, the structural philosophy can be applied by employing a set of equations of the SSIM standard metric in place of the f
individually. Given the comparison of two images (or image patches) with x and y, the average luminance of each image is estimated.
Contrast is iestimated using standard deviation as
and istructureis iestimated normalizing by the standard
Then, the measurements µx; µy;
luminance icomparison function l(x; y), a contrast comparison structure comparison function s(x; y) to give a composite similarity
Where α; β; & are positive constants used to weight each comparison function.
The comparison functions are given as:
The inspiration behind the structural matching method for measuring image quality is that HVS images are not designed to detect imperfections and "errors". Instead, s evolved in such a way that it recognizes visual patterns so as to be able to find structures or connections to natural images. Based on this observation, it is realized that a helpful perceptible quality metric will emphasize the visual structure ghting effects. The idea that image metrics would be created based on this philosophy was initially explored and so it was modified, applied, evaluated and improved in contrast to struct and an image. Conversely, the structural approach is tortions that break down natural spatial relationships such as blasts, the art of block compression, and noise in an image. As described, the structural philosophy can be applied by employing a set of equations of the SSIM standard metric in place of the figure. Illumination, contrast and structure are measured individually. Given the comparison of two images (or image patches) with x and y, the average luminance of each image is estimated.
estimated using standard deviation as
estimated ifrom the image vector x by removing the mean and normalizing by the standard ideviation
Then, the measurements µx; µy; αx; αy; & x; & y are icombined using a comparison function l(x; y), a contrast comparison function c(x; y), and a structure comparison function s(x; y) to give a composite imeasure of structural
are positive constants used to weight each comparison function.
The comparison functions are given as:
The inspiration behind the structural matching method for measuring image quality is that HVS images are not designed to detect imperfections and "errors". Instead, s evolved in such a way that it recognizes visual patterns so as to be able to find structures or connections to natural images. Based on this observation, it is realized that a helpful perceptible quality metric will emphasize the visual structure ghting effects. The idea that image metrics would be created based on this philosophy was initially explored and so it was modified, applied, evaluated and improved in contrast to struct and an image. Conversely, the structural approach is tortions that break down natural spatial relationships such as blasts, the art of block compression, and noise in an image. As described, the structural philosophy can be applied by employing a set of equations of the SSIM standard igure. Illumination, contrast and structure are measured individually. Given the comparison of two images (or image patches) with x and y,
from the image vector x by removing the mean and
combined using a function c(x; y), and a measure of structural
are positive constants used to weight each comparison function.
Where () is the inner-product operator defining the correlation between the structure of the two images.
4.5 FILTER
Filters are data iprocessing techniques that can smooth out in idata or snatch specific frequency pe
Matlab filters a vector of data x according to different equations.
The filter is driven by a moving common data smoothing technique.
Different types of MATLAB function:
Imfilter
N-D filtering of multidimensional images Syntax
B = imfilter(A, iH)
B i= iimfilter(A, iH, ioption1, Description
B i= iimfilter(A, iH) ifilters the multidimensional array A with the multidimensional filter H. The array A can be logical or a nonsparse numeric array of any class and dimension. The result B has the same size and class as A.
Each component of output B is calculated using a double A is an integer or logical array, the output elem
type limit and the values of the fraction are rounded.
Imnoise
Add noise to image
Syntax
J = iimnoise(I,type)
20
product operator defining the correlation between the structure
processing techniques that can smooth out ihigh-frequency fluctuations data or snatch specific frequency periodic trends from data. The filter function in Matlab filters a vector of data x according to different equations.
The filter is driven by a moving-average filter implementation strategy, common data smoothing technique.
TLAB function:
D filtering of multidimensional images
option1, ioption2,...)
filters the multidimensional array A with the multidimensional A can be logical or a nonsparse numeric array of any class and dimension. The result B has the same size and class as A.
Each component of output B is calculated using a double-precision floating
A is an integer or logical array, the output elements are truncated beyond the integer type limit and the values of the fraction are rounded.
product operator defining the correlation between the structure
.[6 ,8]
frequency fluctuations riodic trends from data. The filter function in
average filter implementation strategy, which is a
filters the multidimensional array A with the multidimensional A can be logical or a nonsparse numeric array of any class and
precision floating-point. If ents are truncated beyond the integer
J i= iimnoise(I,'gaussian',m,v) J = imnoise(I,'poisson') J = imnoise(I,'salt&pepper',d)
J = imnoise(I,'gaussian',m,v) adds Gaussian white noise of mean m and variance v to the image I. The default is zero mean noise with 0.01 variance.
J = imnoise(I,'poisson') generates Poisson noise from the data instead of adding artificial noise to the data. If I is double precision, then input pixel values are interpreted as means of Poisson distributions scaled up by 1e12. For example, if an input pixel has the value 5.5e-12, then the corresponding output pixel will be generated from a Poisson distribution with mean of 5.5 and then scaled back down by 1e12. If I is single precision, the scale factor used is 1e6. If I is uint8 or uint16, then input pixel values are used directly without scaling. For example, if a pixel in a uint8 input has the value 10, then the corresponding output pixel will be generated from a Poisson distribution with mean 10.
J = imnoise(I,'salt&pepper',d) adds salt and pepper noise to the image I, where d is the noise density. This affects approximately d*numel(I) pixels. The default for d is 0.05.
The mean and variance parameters for 'gaussian', 'localvar', and 'speckle' noise types are always specified as if the image were of class double in the range [0, 1]. If the input image is of class uint8 or uint16, the imnoise function converts the image to double, adds noise according to the specified type and parameters, and then converts the noisy image back to the same class as the input.
Gaussian filter
In the physical sciences and signal processors, a Gaussian filter may be a filter whose emotional response may be a Gaussian performance (or an approximate to it).
Gaussian filters have the feature of not getting any overshoot for performing any action while increasing and decreasing the reading time. This behavior is closely linked to the actual truth with the least possible cluster delay of the Gaussian filter. It is concerned about the best time-domain filters, even the standard frequency-domain filters such as sinc. These units are important in regions such as oscilloscopes and digital telecommunication systems.
Mathematically, a Gaussian filter modifies the input by compromising by a Gaussian function; This recording is additionally referred to as Wearstrass Transform.
Fig: Shape of the impulse response of a typical Gaussian filter Definition:
The one-dimensional Gaussian
=
and the frequency iresponse is given by the
with f the ordinary frequency. These equations can also be expressed with the standard deviation as parameter.
And the frequency response is given by
By writing a function of
of with the two equations for
standard deviation and the standard deviation in the frequency domain is given by
where the standard deviations
time and frequency iin seconds and Hertz.
In two dimensions, it is the product of two such
g(x,y)= .
where x is the distance ifrom the origin in the horizontal axis, origin in the vertical axis, and
distribution.[7]
22
Shape of the impulse response of a typical Gaussian filter
dimensional Gaussian ifilter has an impulse response given by
response is given by the iFourier transform
ordinary frequency. These equations can also be expressed with as parameter.
And the frequency response is given by
a function of with the two equations for g(x) and as a function equations for g(f) it can be shown that the product of the standard deviation and the standard deviation in the frequency domain is given by
where the standard deviations iare expressed in their physical iunits, e.g. in the case of in seconds and Hertz.
In two dimensions, it is the product of two such iGaussians, one per direction:
.
from the origin in the horizontal axis, iy is the distance from the origin in the vertical axis, and iσ is the standard deviation of the
ordinary frequency. These equations can also be expressed with
and as a function it can be shown that the product of the standard deviation and the standard deviation in the frequency domain is given by
units, e.g. in the case of Gaussians, one per direction:
is the distance from the standard deviation of the iGaussian
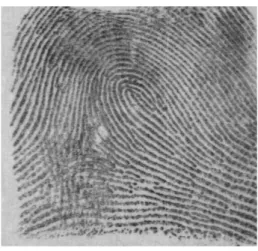
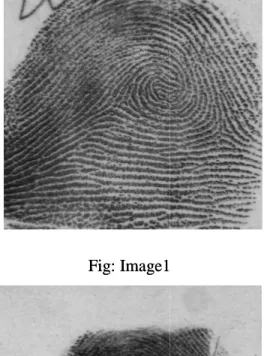
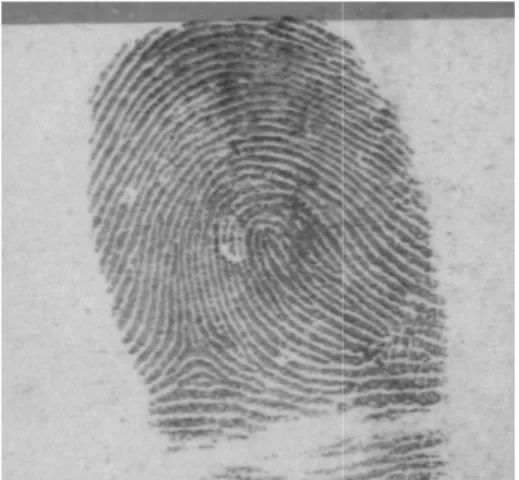
4.6 Database
Fig: Image1 Fig: Image2
Fig: Image3 Fig: Image4
Fig: Image5 Fig: Image6
Fig: Image1 Fig: Image2
Fig: Image3 Fig: Image4
Fig: Image5 Fig: Image6
Fig: Image7
Fig: Image9 Fig: Image10
Fig: Image11
24
Fig: Image8
Fig: Image9 Fig: Image10
Fig: Image11 Fig: Image12
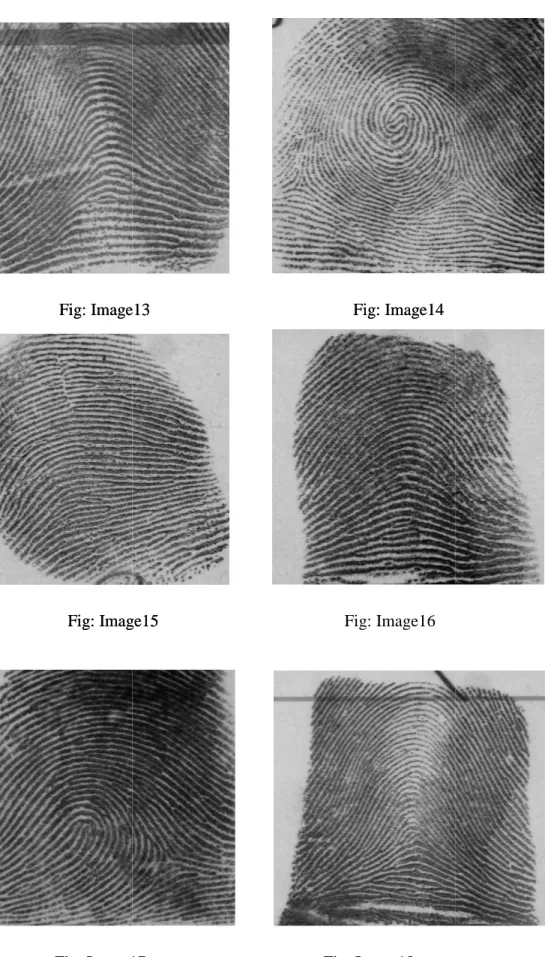
Fig: Image13 Fig: Image14
Fig: Image15
Fig: Image17 Fig: Image18
Fig: Image13 Fig: Image14
Fig: Image15 Fig: Image16
Fig: Image17 Fig: Image18
Fig: Image19 Fig: Image20
Fig: Image21
Fig: Image23
26
Fig: Image19 Fig: Image20
Fig: Image21 Fig: Image22
Fig: Image23 Fig: Image24
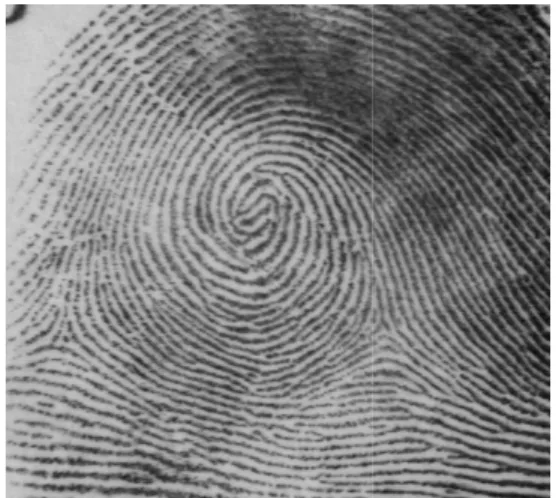
4.7 Program
Input image read:-
functionfingerprintdemo() clear iall
close iall clc
I=imread('J:\20.png');
%I=image iread
I1=I([130:440],[130:440]);
figure(1), isubplot(2,2,1),
iimshow(I1) i clear I
Image Binarization:- I=I1;
H = fspecial('gaussian',[9 9],0.5); Figure4.1: Reference image I = imfilter(I,H);
figure(1), subplot(2,2,2), imshow(I) set(gcf,'position',[1 1 600 600]);
J=I(:,:,1)>100;
figure(1), subplot(2,2,3), imshow(J)
set(gcf,'position',[1 1 600 600]);
Image Thining:-
K=bwmorph(~J,'thin','inf');
%K=bwmorph(~J,'skel');
figure(1), subplot(2,2,4), imshow(~K)
set(gcf,'position',[1 1 600 600]);
Figure4.2: Binarize output image
28
Figure4.3: Thinning output image fun=@minutie;
L = nlfilter(K,[3 3],fun);
LTerm=(L==1);
% make all value of '1' is 1, but all zero.
figure(2), subplot(2,2,1),imshow(LTerm)
%LTermLab=bwlabel(LTerm);
LTermLab=LTerm;
propTerm=regionprops(LTermLab,'Centroid') CentroidTerm=round(cat(1,propTerm(:).Centroid));
figure(2), iisubplot(2,2,2), iiimshow(~K) set(gcf,'position',[1 ii1 ii600 ii600]);
hold ion
plot(CentroidTerm(:,1),CentroidTerm(:,2),'ro') hold ion
LBif=(L==3);
LBifLab=bwlabel(LBif);
propBif=regionprops(LBifLab,'Centroid','Image');
CentroidBif=round(cat(1,propBif(:).Centroid));
plot(CentroidBif(:,1),CentroidBif(:,2),'go') D=3;
Distance=DistEuclidian(CentroidBif,CentroidTerm);
SpuriousMinutae=Distance<D;
[i,j]=find(SpuriousMinutae);
CentroidBif(i,:)=[];
CentroidTerm(j,:)=[];
Distance=DistEuclidian(CentroidBif);
SpuriousMinutae=Distance<D;
[i,j]=find(SpuriousMinutae);
CentroidBif(i,:)=[];
%Process i3
Distance=DistEuclidian(CentroidTerm );
SpuriousMinutae=Distance<D;
[i,j]=find(SpuriousMinutae);
CentroidTerm(i,:)=[];
hold ioff
figure(2), isubplot(2,2,3),imshow(~K) hold ion
plot(CentroidTerm(:,1),CentroidTerm(
:,2),'ro')
plot(CentroidBif(:,1),CentroidBif(:,2),' go')
hold ioff
Kopen=imclose(K,strel('square',11));
KopenClean= iimfill(Kopen,'holes');
KopenClean=bwareaopen(KopenClea n,7);
Figure4.4: iFiltered image figure(3), subplot(2,2,3), imshow(KopenClean)
KopenClean([1 end],:)=0;
KopenClean(:,[1 end])=0;
ROI=imerode(KopenClean,strel('disk',10));
Figure(2),
Subplot(2,2,4),imshow(ROI) imshow(I)
hold ion imshow(ROI) alpha(0.5) hold ion
plot(CentroidTerm(:,1),CentroidTerm(:,2),'ro')
plot(CentroidBif(:,1),CentroidBif(:,2), hold ioff
[m,n]=size(I(:,:,1));
indTerm=sub2ind([m,n],CentroidTerm(:,1),CentroidTerm(:,2));
Z=zeros(m,n);
Z(indTerm)=1;
ZTerm=Z.*ROI';
[CentroidTermX,CentroidTermY]=find(ZTerm);
indBif=sub2ind([m,n],CentroidBif(:,1),CentroidBif(:,2));
Z=zeros(m,n);
Z(indBif)=1;
ZBif=Z.*ROI';
[CentroidBifX,CentroidBifY]=find(ZBif);
figure(3), subplot(2,2,1), imshow(I)
Figure4.5 hold ion
plot(CentroidTermX,CentroidTermY, plot(CentroidBifX,CentroidBifY,
30 plot(CentroidBif(:,1),CentroidBif(:,2),'go')
indTerm=sub2ind([m,n],CentroidTerm(:,1),CentroidTerm(:,2));
[CentroidTermX,CentroidTermY]=find(ZTerm);
indBif=sub2ind([m,n],CentroidBif(:,1),CentroidBif(:,2));
[CentroidBifX,CentroidBifY]=find(ZBif);
figure(3), subplot(2,2,1), imshow(I)
Figure4.5: Supressed image
plot(CentroidTermX,CentroidTermY,'ro','linewidth',2) plot(CentroidBifX,CentroidBifY,'go','linewidth',2)
Table=[3*pi/4 i2*pi/3 ipi/2 ipi/3 pi/4 5*pi/6 0 0 0 pi/6
pi 0 0 0 0
-5*pi/6 0 0 0 -pi/6
-3*pi/4 -2*pi/3 -pi/2 -pi/3 -pi/4];
%OrientationTerm=zeros(6,1);
forind=1:length(CentroidTermX)
Klocal=K(CentroidTermY(ind)-2:CentroidTermY(ind)+2,CentroidTermX(ind)- 2:CentroidTermX(ind)+2);
Klocal(2:end-1,2:end-1)=0;
[i,j]=find(Klocal);
OrientationTerm(ind,1)=Table(i(1),j(1));
end
dxTerm=sin(OrientationTerm)*20;
dyTerm=cos(OrientationTerm)*20;
figure(3), subplot(2,2,2),imshow(K) set(gcf,'position',[1 i1 i600 i600]);
hold on
plot(CentroidTermX