FORMULATION AND PHYSICOHEMICAL ANALYSIS OF DATES AND TAMARIND COMBINED DRINKS
A PROJECT REPORT BY
Malek Sarkar ID: 201-34-280
Submitted to the Department of Nutrition and Food Engineering in the partial fulfillment of B.Sc. in Nutrition and Food Engineering
Supervised by Dr. Nizam Uddin Associate Professor & Head
Department of NFE
Co-Supervised By Abu Saeid
Lecturer Department of NFE
FACULTY OF ALLIED HEALTH SCIENCE (FAHS) DAFFODIL INTERNATIONAL UNIVERSITY
APRIL 2023
©Daffodil International University P a g e | i APPROVAL
This project titled “Formulation and Physicochemical Analysis of Dates and Tamarind Combined Drinks’’ Submitted by Malek Sarkar to the Department of Nutrition and Food Engineering, Daffodil International University, has been accepted as satisfactory for the partial fulfilment of the requirements for the degree of B.sc in Nutrition and Food Engineering and approved as to its style and contents. The presentation has been held on
Date of Submission:
EXAMINIG COMMITTEE
Md. Harun-Ar Rashid Member
Assistant Professor Department of NFE
Faculty of Allied Health Science Daffodil International University
Department Head
Dr. Nizam Uddin
Associate Professor & Head Department of NFE
Faculty of Allied Health Sciences Daffodil International University
DECLARATION
We hereby declare that this project has been done by us under the supervision of Dr. Nizam Uddin Associate Professor & Head Department of NFE, Daffodil International University.
We also declare that neither this project for any part of this project has been submitted elsewhere for award of any degree or diploma.
Supervised by:
Dr. Nizam Uddin
Associate Professor & Head
Department of Nutrition and Food Engineering Daffodil International University
Co-Supervised By:
Abu Saeid Lecturer
Department of Nutrition and Food Engineering Daffodil International University
Submitted by
Malek Sarkar ID: 201-34-280
Department of Nutrition and Food Engineering Daffodil International University
©Daffodil International University P a g e | iii ACKNOWLEDGEMENT
Firstly I express my heartiest thanks and gratefulness to almighty God for his divine blessing makes us possible to complete the final year project successfully.
I really grateful and wish my profound indebtedness to my respected Supervisor Dr. Nizam Uddin Associate Professor & Head, Department of Nutrition and Food Engineering (NFE), Daffodil International University. His endless patience, scholarly guidance, continual encouragement, constant and energetic supervision, constructive criticism, valuable advice, reading many inferior drafts and correcting them at all stage have made it possible to complete this project.
I would like to express my heartiest gratitude to Abu Saeid, Lecturer, Department of NFE, for his kind help to finish our project and also to other faculty member and the staff of NFE department of Daffodil International University.
I would like to thank my entire course mate in Daffodil International University, who took part in this discuss while completing the course work.
Finally, I must acknowledge with due respect the constant support and patients of our parents.
Author
ABSTRACT
The study aimed to develop and evaluate the quality of combined dates and tamarind drinks. The physicochemical characteristics, total plate count (TPC), and sensory attributes of the drinks were analyzed at various storage periods. The results suggest that pH remained fairly consistent across all samples and days, ranging from 2.88 to 3.03. Brix values were in the ranges from 19.33 to 21.53. Moisture content decreased slightly from 90.35% on day 0 to 81.35% on day 21.
Vitamin C content decreased over time, with the highest value of 3.56 mg/100g on day 0 and the lowest value of 3.60 mg/100g on day 21. Acidity and ash content were ranges of 0.66% to 0.94%
and ash ranging from 1.27% to 1.443% respectively. Protein and fat content remained consistent over the 21-day period, with protein ranging from 1.35% to 1.57% and fat ranging from 0.12% to 0.37%. The TPC values ranged from 10-23x10^3cfu/ml on day 2 to 11-26x10^3cfu/ml on day 3.
Overall, the data suggests that fresh-dates and tamarind drinks maintained their quality over a 21-day period, with only minor changes observed in some parameters. Each sample was evaluated for color, flavor, taste, and overall acceptability. For sample 1, the mean scores for color, flavor, taste, and overall acceptability were 8.03, 8.23, 8.36, and 8.13, respectively. For sample 2, the mean scores were 8.13, 8.16, 8.93, and 8.08, respectively. Sample 3 had mean scores of 8.08, 8.1, 8.23, and 8.26, respectively. Sample 4 had mean scores of 7.97, 8.3, 8.53, and 8.2 for color, flavor, taste, and Sample 2 had the highest score for overall acceptability.
However, the TPC increased with storage time, indicating microbial growth. The sensory analysis showed that the drinks were acceptable in terms of color, flavor, taste, and overall acceptability. Overall, the study demonstrated that combined dates and tamarind drinks can be a viable product for commercial production with a shelf life of 21 days under refrigerated condition.
TABLE OF CONTENTS
CONTENTS PAGE
Approval I
Declaration II
Acknowledgements III
Abstract IV CHAPTER 1: Introduction 1-2
1.1 Introduction 1
1.2 Objective 2
CHAPTER 2: Literature Review 3-4 2.1 Literature Review 3-4 CHAPTER 3:Materials 5-10 3.1 Materials 5-10 3.1.1 Sample collection and Preparation 5
3.1.2 Chemical and Reagent 5
3.2 Methods 5
3.2.1 Formulation of Dates and tamarind combine drinks 5
3.2.2 Preparation of dates and tamarind combined drink: 5
3.2.3 Flow diagram 6
3.2.4 Physicochemical Properties Analysis 7
3.2.2.1 Determination of pH 7
3.2.2.2 Determination of ºBrix 7
3.2.2.3 Determination of moisture content 7
3.2.2.4: Total Plate count 8
3.2.2.5 Determination of Vitamin C 8
3.2.2.6 Determination of Acidity/Titratable acidity 9
3.2.2.7 Determination of Ash 9 3.2.2.8 Determination of Protein 9-10 3.2.2.9 Determination of Fat 10 3.2.2.10 Sensory Evaluation form of dates and tamarind combined drinks. 10 CHAPTER 4: Result and discussion 11-14
4.0 Result and discussion 11 4.1 Physico-chemical Properties 11
4.2 Physico-chemical characteristics 12
4.3 Total Plate count
13-14 4.5 Mean sensory scores for concentrated 14
CHAPTER 5: Conclusion 15
Conclusion 15
REFERENCES 16-17
APPENDIX 18-24
LIST OF FIGURES
FIGURES PAGE NO
3.1 Process Diagram 6
3.2 Sample of Final Product 7
LIST OF TABLES
TABLES PAGE NO
3.1 Formulation of Dates and tamarind combine drinks 5 4.2 Physico-chemical characteristics of Dates and tamarind drinks
under refrigerated condition with 21 days of storage
12
4.3 Total Plate count 13
4.5 Mean sensory scores for concentrated of Dates Tamarind combine drinks
14
CHAPTER 1
Introduction 1.1 Introduction
Dates are a type of fruit that grows on the date palm tree, which is native to the Middle East and North Africa. They have been cultivated for thousands of years and have been an important food source in many cultures around the world. Dates are high in fiber, vitamins, and minerals, and are known for their natural sweetness. They are a good source of potassium, magnesium, and copper, as well as B vitamins like thiamin and riboflavin. There are many different varieties of dates, each with their own unique flavor and texture. Some popular varieties include Medjool, Deglet Noor, and Barhi. Dates can be eaten fresh or dried, and are often used in baking and cooking. They are a popular ingredient in many Middle Eastern and North African dishes, as well as in desserts like date squares and sticky toffee pudding. In addition to their nutritional benefits, dates also have some potential health benefits. They may help to regulate blood sugar levels, improve digestion, and boost heart health. Overall, dates are a delicious and nutritious fruit that can be enjoyed in many different ways. Whether you eat them fresh or dried, they are a great addition to a healthy and balanced diet. (Al-Farsi M. &., p. 2008)Tamarind is a fruit that grows on a tropical tree called Tamarinds Indica. It is native to Africa but is also cultivated in many other parts of the world, including Southeast Asia, India, and the Caribbean. Tamarind has a distinctive sour taste and is often used in cooking, particularly in Southeast Asian and Indian cuisine. It is used in sauces, marinades, curries, and chutneys, as well as in drinks and desserts.
IN addition to its culinary uses, tamarind has some potential health benefits. It is high in antioxidants and may help to reduce inflammation in the body. It may also help to lower cholesterol levels and improve digestion. Tamarind is available in several different forms, including whole pods, paste, concentrate, and powder. The paste and concentrate are the most commonly used forms in cooking. Overall, tamarind is a unique and flavorful fruit that is widely used in many different types of cuisine. It is also packed with potential health benefits, making it a great addition to a healthy and balanced diet. (Oguntoyinbo, p. 2011) Drinks are a type of beverage that are consumed to quench thirst or for enjoyment. There are many different types of drinks, including non-alcoholic and alcoholic beverages, hot and cold drinks, and soft and carbonated drinks Non-alcoholic drinks include water, juice, tea, coffee, milk, and soft drinks.
These drinks are often consumed for their hydrating properties and their nutritional value.
Alcoholic drinks, on the other hand, contain ethanol and are consumed for their relaxing or euphoric effects. They include beer, wine, spirits, and cocktails, and are often consumed in social settings or to celebrate special occasions. Hot drinks include tea, coffee, and hot chocolate, and are often consumed to warm up on cold days or to relax in the evening. Cold drinks include iced tea, lemonade, soda, and smoothies, and are often consumed on hot days or to cool down after exercise. Overall drinks are an important part of our daily lives and can be enjoyed in many different settings and for many different purposes. Whether you're looking for hydration, nutrition, or relaxation, there is a drink out there to suit your needs. (Popkin, p. 2010)
©Daffodil International University P a g e | 2 1.2 Objective:
This research aimed to:
• Formulate the drinks with dates and tamarind
• Assess the quality parameters of combined drinks
• Evaluate the sensory characteristics of combined drinks
CHAPTER-2
Literature Review 2.1 Literature Review
The history of drinks dates back thousands of years and varies greatly across different cultures and regions of the world. In ancient civilizations such as Egypt and Mesopotamia, beer was a popular drink made from fermented grains. It was considered a staple food and was often used in religious ceremonies. In China, tea has been consumed for over 5,000 years and has played a significant role in Chinese culture and society. It was originally consumed for medicinal purposes before becoming a popular beverage. IN the Middle Ages, wine became a popular drink in Europe and was often consumed by the upper class. It was also used for medicinal purposes and as a way to purify water. In the 18th and 19th centuries, the Industrial Revolution led to the mass production of drinks such as beer and soda. This period also saw the development of modern brewing and distilling techniques. In the 20th century, the popularity of soft drinks and other non-alcoholic beverages grew rapidly. These drinks were often marketed as healthy alternatives to alcohol and were heavily promoted by the beverage industry. Today, the world of drinks continues to evolve and diversify, with new beverages and trends emerging all the time.
From ancient fermented drinks to modern energy drinks, the history of drinks is a rich and varied tapestry. (Fermented beverages of pre-and proto-historic China.)Both dates and tamarind are known for their potential health benefits, and when combined in a drink, they can provide a variety of nutrients and health-promoting compounds. Rich in antioxidants: Both dates and tamarind are rich in antioxidants, which can help protect the body against oxidative stress and reduce the risk of chronic diseases Good for digestion: Tamarind is known to have a laxative effect and can help promote bowel movements and relieve constipation. Dates are also high in fiber, which can help regulate digestion and promote bowel regularity Anti-inflammatory properties: Tamarind contains compounds with anti-inflammatory properties, which can help reduce inflammation in the body and potentially lower the risk of chronic diseases such as heart disease and arthritis. May improve bone health: Both dates and tamarind are good sources of calcium and other minerals that are important for bone health. Consuming these foods regularly may help improve bone density and reduce the risk of osteoporosis. May aid in weight management: Dates and tamarind are both relatively low in calories and high in fiber, which can help promote feelings of fullness and reduce overall calorie intake. Consuming these foods as part of a balanced diet may help with weight management. It is important to note that while dates and tamarind are generally considered healthy foods, consuming them in excessive amounts may lead to unwanted side effects. Additionally, drinks that contain added sugars or other ingredients may not provide the same health benefits as drinks made from whole, natural ingredients. (Al- Farsi M. &.)Dates and tamarind are both nutrient-dense foods, and when combined into a drink, they can provide a wide range of vitamins, minerals, and antioxidants. some of the key nutritional values of dates and tamarind, Dates High in fiber one cup of chopped dates (approximately 147g) contains about 12g of fiber, or about 48% of the daily recommended
©Daffodil International University P a g e | 4 intake. Rich in potassium one cup of chopped dates contains about 1,174mg of potassium, or
about 25% of the daily recommended intake. High in vitamins dates are a good source of vitamins B6 and B5, as well as vitamin High in minerals dates contain magnesium, copper, and manganese. Tamarind High in fiber one cup of tamarind pulp (approximately 120g) contains about 6g of fiber, or about 24% of the daily recommended intake. Rich in calcium one cup of tamarind pulp contains about 115mg of calcium, or about 12% of the daily recommended intake.
High in vitamins: tamarind is a good source of vitamins B1, B2, and B3, as well as vitamin High in minerals tamarind contains iron, magnesium, and potassium. When combined into a drink, the nutritional values of dates and tamarind can vary depending on the specific recipe and ingredients used. However, in general, a dates and tamarind combined drink can be a good source of fiber, potassium, and vitamins B and C. Additionally, the antioxidant and anti- inflammatory properties of this drink can provide further health benefits. (Al-Farsi M. A., p.
2008) (Al-Farsi e. a., 2005)
CHAPTER-3 Material and Methods
3.1 Materials
3.1.1 Sample collection and Preparation
All of the materials used to make the dates and tamarind were bought from Ashulia bazar and department stores. In the laboratory, raw materials formulation.
3.1.2 Chemical and Reagent
Dates, Tamarind, Sugar, Water, Xanthan gum, Sodium benzoate, Other essential ingredients were used from the laboratory stocks.
3.2 Methods
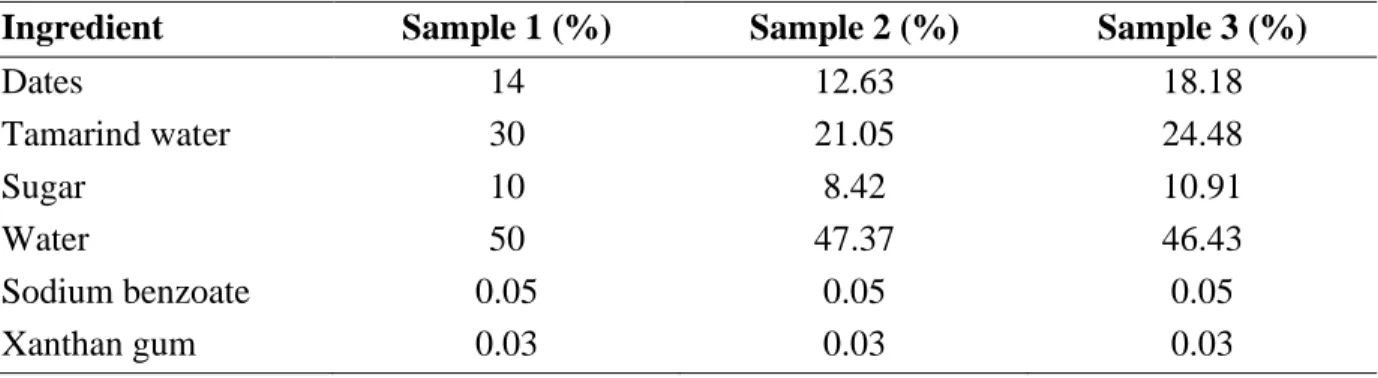
Table 3.1 Formulation of Dates and tamarind combine drinks
Ingredient Sample 1 (%) Sample 2 (%) Sample 3 (%)
Dates 14 12.63 18.18
Tamarind water 30 21.05 24.48
Sugar 10 8.42 10.91
Water 50 47.37 46.43
Sodium benzoate 0.05 0.05 0.05
Xanthan gum 0.03 0.03 0.03
3.2.2 Preparation of dates and tamarind combined drink
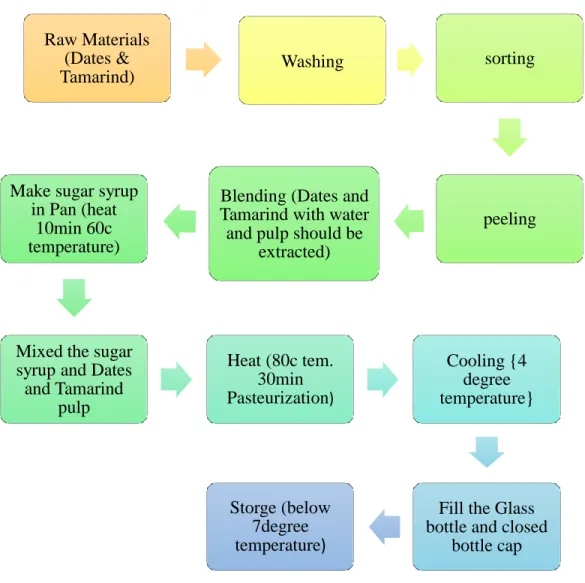
Firstly, Soak the tamarind pulp: In a small bowl, soak the tamarind pulp in 1/2 cup of warm water for about 15-20 minutes. This will help soften the pulp and make it easier to remove the seeds and fibers. Remove the seeds and fibers: Using your fingers, remove the seeds and fibers from the tamarind pulp and discard them. This step is important to ensure that the drink has a smooth and even texture. Blend the ingredients: In a blender, combine the soaked and cleaned tamarind pulp with the pitted dates, sugar, and ½ cup water. Blend the mixture until it becomes smooth and well combined. If the mixture is too thick, you can add a little more water to thin it out. Strain the mixture: Using a fine-mesh sieve, strain the mixture to remove any remaining solids and fibers. This will result in a smooth and silky drink that is free from any lumps or chunks. Add hot water and stir ,80c temperature 30min Pasteurization and Cooling then fill it to bottle and store 4degree temperature below Storage (below7 degree temperature).
©Daffodil International University P a g e | 6 The formulation and flow diagram of dates and tamarind combine drinks was depicted in Table
3.1 and respectively 3.2.3:
Figure 3.1: Flow chart of Dates and tamarind drinks Raw Materials
(Dates &
Tamarind) Washing sorting
peeling Blending (Dates and
Tamarind with water and pulp should be
extracted) Make sugar syrup
in Pan (heat 10min 60c temperature)
Mixed the sugar syrup and Dates and Tamarind
pulp
Heat (80c tem.
30min Pasteurization)
Cooling {4 degree temperature}
Fill the Glass bottle and closed
bottle cap Storge (below
7degree temperature)
Figure 3.2: Final product
3.2.4 Physicochemical Properties Analysis 3.2.2.1 Determination of pH
The pH of dates and tamarind combine drinks measured, turn on the light first. Take a sample and put it in a beaker. Make sure the temperature sensor and pH electrode are dry and clean.
Calibrate meter using buffers 1 and 2. Collect sample and place the pH in beaker. Insert the pH meter into the measuring cup. Read after correcting the digits in meters.
3.2.2.2 Determination of ºBrix
The TSS (°Brix) of the dates and tamarind combined drinks were determined by using a handheld refractometer.
3.2.2.3 Determination of moisture content
Place 10ml of sample in the moisture analyzer, turn it on, and wait around 5 minutes. The moisture analyzer then displays the results on the screen (Operating instructions for digital moisture analyzer)
3.2.2.4: Total Plate count:
The total plate count of dates and tamarind combine drinks was determined according to the method reported by Rana et al., (2020) with few modifications. Weigh or measure an appropriate amount of the sample and add it to a sterile diluent (such as 0.1% peptone water) in a sterile container. Mix the sample and diluent thoroughly to make a homogenous mixture. Prepare a series of dilutions by transferring a known volume of the sample/diluent mixture to a new container containing fresh diluent, and mixing thoroughly. Typically, a 10-fold dilution series is used. Pipette a suitable volume (usually 0.1 ml or 1 ml) of each diluted sample onto the surface of a sterile agar plate (such as Plate Count Agar). Spread the sample evenly over the surface of the agar using a sterile spreader. Incubate the plates at an appropriate temperature (usually 30-
©Daffodil International University P a g e | 8 35°C for 48 hours) to allow bacterial colonies to grow. Count the number of bacterial colonies on
each plate and calculate the total number of viable bacteria in the sample.
Calculation:
Total Plate Count (CFU
ml
) =
No. of Colonies × Dilution factor ml aliquote taken3.2.2.5 Determination of Vitamin C
Vitamin C of dates and tamarind combine drinks was determined according to the method (Takeo Sakuma, 1997)with few modifications. Prepare a 0.1% starch solution by dissolving 0.1 g of starch in 100 ml of distilled water. Mix well. Take 10 ml of Dates and tamarind combined drinks and dilute it with distilled water to make a 100 ml solution. Take 10 ml of the diluted and add it to a Dates and tamarind combined drinks in Erlenmeyer flask. Add 5 ml of 0.1 N iodine solution to the Erlenmeyer flask and swirl it gently to mix. Titrate the mixture with 0.1 N sodium thiosulphate solution until the blue color disappears. Add 1 ml of 1% starch solution and continue titrating until the blue color disappears. Record the volume of 0.1 N sodium thiosulphate used.
Calculation:
Vitamin C content (mg/100 ml) = [(V1-V2) x N x 88]/W 3.2.2.6 Determination of Acidity/Titratable acidity
Acidity/Titratable acidityof dates and tamarind combine drinks was determined according to the method (Bello, 2014) with few modifications. Mix the sample of dates and tamarind drink thoroughly to ensure a homogenous solution, Fill the burette with 0.1 N NaOH solution. Pipette a 10 mL aliquot of the sample into a conical flask. Add 3-4 drops of phenolphthalein indicator to the flask. Slowly titrate the sample with 0.1 N NaOH solution while stirring continuously until the pink color of the phenolphthalein indicator persists for at least 30 seconds. Record the volume of NaOH solution used. Repeat the titration at least two more times and calculate the average volume of NaOH solution used. Calculate the titratable acidity of the sample using the following formula:
Titratable acidity (g/100 mL) = (V x N x 0.064)
where V = volume of NaOH solution used (in mL) N = normality of NaOH solution 0.064 = equivalent weight of citric acid (the most common acid found in fruits) W = weight of sample used (in g)
3.2.2.7 Determination of Ash
Ash of dates and tamarind combine drinks was determined according to the method (Kudre, (2013) with few modifications. Preheat the muffle furnace to 550-600°C. Weigh a clean, dry crucible on an analytical balance and record the weight. Pipette a 10 mL aliquot of the sample into the crucible. Place the crucible in the muffle furnace using tongs and ash the sample for 4-6 hours or until the sample turns white. Remove the crucible from the muffle furnace using tongs and allow it to cool to room temperature in a desiccator. Weigh the crucible and ash on an analytical balance and record the weight. Calculate the ash content of the sample using the following formula:
Ash content (%) = (weight of ash / weight of sample) x 100 3.2.2.8 Determination of Protein
Protein of dates and tamarind combine drinks was determined using Kjeldahl method as reported by Javid et al., (2009) with few modifications. Protein of dates and tamarind combined drinks was determine using kjeldhal method A 0.4 g sample was taken and placed on foil or weighing paper. This was placed in a Kjeldahl digestion flask. He was then given his 1 liter of H2SO4 for 10 minutes. 2 g of digestion mixture was then added to the flask. Flasks were cooked in a Kjeldahl cooker. Temperatures quickly rose from 20 degrees Celsius to 65 degrees Celsius. The solution will lose its color after boiling for 3-4 hours. The flask was then transferred to a volumetric flask and, after cooling, filled with 100 ml of distilled water. A tenth of a liter of solution from this flask was transferred to a distillation flask. 150 mL of distilled water was added to the flask. 10 mL of 40% NaOH was then added to the distillation flask. The remedy had no color. Blank values are processed with only one reagent and continue to be processed without sample at the same time. 50 mL of distilled water and 10 mL of 0.1 M HCl were placed in a small Erlenmeyer flask. Two drops of methyl red were added to the trapping Erlenmeyer flask.
The solution turns pink when distilled. The condenser was then turned on for 30 minutes to complete the distillation process. Then NaOH was titrated after removing the Erlenmeyer flask.
For titration, the burette was filled with 0.1N NaOH. The burette was then lowered to make room for the conical titration receiving flask. The Erlenmeyer flask was removed from the burette and collected by drop wise sparging with NaOH. The Erlenmeyer flask was then gently shaken. The introduction of NaOH changed the color of the solution. The end was defined by the transition from pink to yellow.
Calculation: calculated by using the following formula
Protein % =(C-B) *14*d*6.25*100/a*1000
©Daffodil International University P a g e | 1 0 Where, a= Weight of the sample b= volume of NaOH necessary for sample titration; c= volume
of NaOH required for blank titration d= the normality of the NaOH solution used in the titration.
6.25 is the nitrogen conversion factor 3.2.2.9 Determination of Fat
Fat of dates and tamarind combine drinks was determined using (Nigam, (2011) with few modifications. Weigh an empty extraction thimble and record its weight. Then add a known amount of the food sample to the thimble and weigh again. Record the weight of the sample.
Place the sample-loaded thimble into the Soxhlet apparatus. Add the solvent to the Soxhlet flask.
Attach the Soxhlet apparatus to a heating mantle and begin heating the solvent. Once the solvent reaches boiling point, the solvent vapor will rise and enter the condenser where it is cooled and liquefied. This condensed liquid will drip onto the sample in the extraction thimble, extracting the fat. The extracted fat will dissolve in the solvent and then be carried back to the Soxhlet flask by the solvent vapor. The cycle repeats continuously, extracting more and more fat from the sample. The extraction process should continue for several hours to ensure complete extraction of the fat. Once the extraction is complete, remove the thimble from the Soxhlet apparatus and dry it in an oven to evaporate any remaining solvent. Weigh the extraction thimble containing the extracted fat and record its weight. Subtract the weight of the empty thimble from the weight of the thimble containing the extracted fat to obtain the weight of the extracted fat. Calculate the percentage of fat in the sample using the following formula:
% Fat = (Weight of extracted fat ÷ Weight of sample) x 100
3.2.2.10 Sensory Evaluation form of dates and tamarind combined drinks.
Sensory characteristics of dates and tamarind combined drinks sample was carried out on 21 days of storage. Semi-trained thirty panel members were selected from the University community. Randomly, the samples were presented to the panel members. Green tea blend samples were evaluated organoleptically for color, smell, appearance, taste and overall acceptability, according to the hedonic scale of nine points (9-likeextremely to 1- dislike extremely) as reported by Roy et al. (2018).
CHAPTER- 4
Result and discussion
4.0 Result and discussion
4.1 Physico-chemical Properties
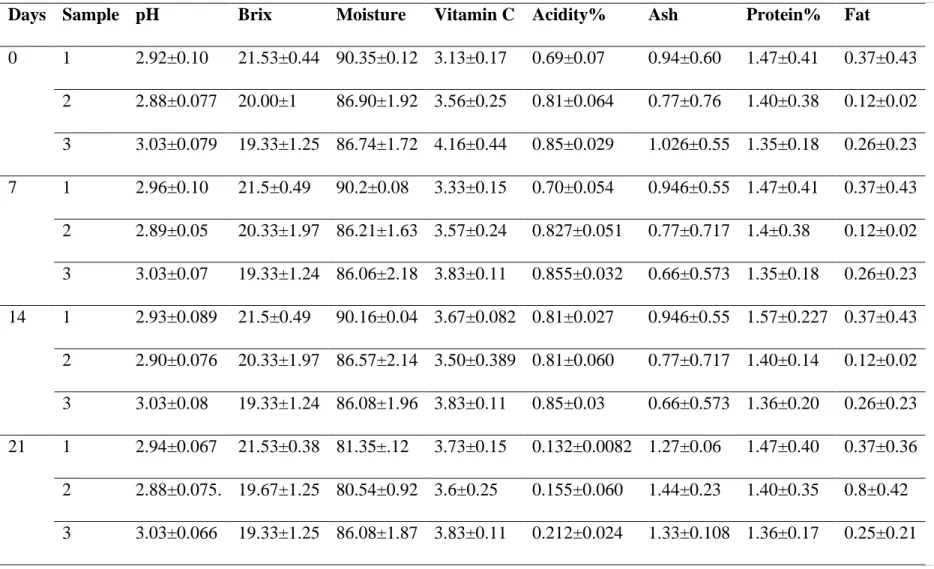
The table 4.2 presents the physico-chemical characteristics of dates and tamarind drinks under refrigerated conditions with 21 days of storage. The pH values of the Dates and tamarind combine drinks range from 3.03 to 2.89 entire storage period for all samples. The highest pH found in sample 3 was 3.03 and lowest found in sample 1 during storage period. These values were supported the work of Singh, A., Gupta, A. K., Kumar, R., & Pandey, S. (2014). According to, this study, pH of the date fruit beverage ranged from 3.85 to 4.05 Our obtained values were closely related the findings of Al-Juhaimi, O. A., Ghafoor, K., & Özcan, M. M. (2012). Date juice ranged from 3.59 to 3.70. the pH of a drink can affects its taste and safety for consumption.
A pH range of 4.6 or below is considered acidic enough to inhibit the growth of harmful bacteria, while a pH range above 4.6 can promote bacterial growth and spoilage. The total soluble solid (TSS) in ranged from Dates and tamarind combine drinks 19.33 to 21.53. in the entire storage period. Although TSS of prepared Dates and tamarind was almost similar till the last day of storage, initially it was lowest in sample 3 and highest in sample 1. The sample 1 and sample 2 significantly different with the sample 3 throughout the storage period. Our works comparable with the results of Haddad, S.G., Al-Rousan, W.M., Rababah, T.M. et al invest who investigated date juice ranged from 25.2 to 29.3, with an average Brix value of 27.2. Qamar, M.F., Yasin, N.A., Ahmed, J. et al. Another study published in the journal Foods found that the Brix values of date juice samples ranged from 22.5 to 26.8, The moisture content of the samples ranged from 80.54% to 90.35%. The standard moisture content for fruit juices is between 80% and 90%
(Gopalan et al., 2007). Vitamin C: The vitamin C content of the samples ranged from 3.13 mg/100g to 4.16 mg/100g. The standard vitamin C content for fruit juices is between 20 mg/100g and 80 mg/100g (Gopalan et al., 2007). Acidity: The acidity values of the samples ranged from 0.132% to 0.855%. The standard acidity value for fruit juices is between 0.3% and 0.8% (Codex Alimentarius Commission, 2001). Ash: The ash content of the all samples ranged from lowest 0.66% to highest 1.443%. The standard ash content for fruit juices is less than 2%
(Gopalan et al., 2007). Protein: The protein content of the all samples ranged from lowest 1.35%
to highest 1.57%. The standard protein content for fruit juices is less than 1% (Gopalan et al., 2007). Fat: The fat content of the all samples ranged from lowest 0.12% to highest 0.37%. The standard fat content for fruit juices is less than 0.5% (Codex Alimentarius Commission, 2001).
(Phoebe P. Kaddumukasa, 19 August 2017)
©Daffodil International University P a g e | 1 2
Table 4.2: Physico-chemical characteristics of Dates and tamarind drinks under refrigerated condition with 21 days of storage.
Days Sample pH Brix Moisture Vitamin C Acidity% Ash Protein% Fat
0 1 2.92±0.10 21.53±0.44 90.35±0.12 3.13±0.17 0.69±0.07 0.94±0.60 1.47±0.41 0.37±0.43 2 2.88±0.077 20.00±1 86.90±1.92 3.56±0.25 0.81±0.064 0.77±0.76 1.40±0.38 0.12±0.02 3 3.03±0.079 19.33±1.25 86.74±1.72 4.16±0.44 0.85±0.029 1.026±0.55 1.35±0.18 0.26±0.23 7 1 2.96±0.10 21.5±0.49 90.2±0.08 3.33±0.15 0.70±0.054 0.946±0.55 1.47±0.41 0.37±0.43 2 2.89±0.05 20.33±1.97 86.21±1.63 3.57±0.24 0.827±0.051 0.77±0.717 1.4±0.38 0.12±0.02 3 3.03±0.07 19.33±1.24 86.06±2.18 3.83±0.11 0.855±0.032 0.66±0.573 1.35±0.18 0.26±0.23 14 1 2.93±0.089 21.5±0.49 90.16±0.04 3.67±0.082 0.81±0.027 0.946±0.55 1.57±0.227 0.37±0.43 2 2.90±0.076 20.33±1.97 86.57±2.14 3.50±0.389 0.81±0.060 0.77±0.717 1.40±0.14 0.12±0.02 3 3.03±0.08 19.33±1.24 86.08±1.96 3.83±0.11 0.85±0.03 0.66±0.573 1.36±0.20 0.26±0.23 21 1 2.94±0.067 21.53±0.38 81.35±.12 3.73±0.15 0.132±0.0082 1.27±0.06 1.47±0.40 0.37±0.36 2 2.88±0.075. 19.67±1.25 80.54±0.92 3.6±0.25 0.155±0.060 1.44±0.23 1.40±0.35 0.8±0.42 3 3.03±0.066 19.33±1.25 86.08±1.87 3.83±0.11 0.212±0.024 1.33±0.108 1.36±0.17 0.25±0.21
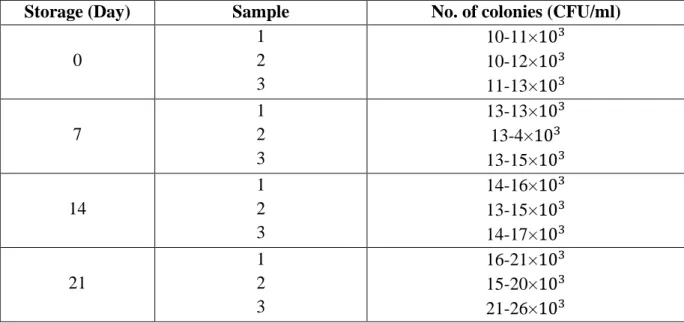
Table 4.3: TPC for combined drinks
Storage (Day) Sample No. of colonies (CFU/ml)
0
1 2 3
10-11×103 10-12×103 11-13×103 7
1 2 3
13-13×103 13-4×10³ 13-15×103 14
1 2 3
14-16×103 13-15×103 14-17×103 21
1 2 3
16-21×103 15-20×103 21-26×103
This data appears to be related to bacterial growth in a storage sample over a period of 21 days.
The sample was tested for Total Plate Count (TPC) which measures the total number of viable bacteria present in a sample. The first column shows the number of days the sample was stored, and the second column shows the sample numbers (1, 2, and 3). The third column shows the TPC count in CFU/ml (colony-forming units per milliliter) for each sample, and the fourth column shows the corresponding range of TPC counts. From the data, it is evident that the TPC count increased over time as the number of viable bacteria in the sample increased. At day 0, the TPC count ranged from 10-11×10^3 to 11-13×10^3 CFU/ml for samples 1, 2, and 3. After 7 days, the TPC count increased to a range of 13-13×10^3 to 13-15×10^3 CFU/ml. At 14 days, the TPC count increased further to a range of 14-16×10^3 to 14-17×10^3 CFU/ml, and at 21 days, the TPC count was the highest with a range of 16-21×10^3 to 21-26×10^3 CFU/ml. These results suggest that bacterial growth increased as the storage time increased. It is important to note that the type of bacteria present in the sample, as well as the storage conditions, could also impact the rate and extent of bacterial growth.
Table 4.5: Mean sensory scores for concentrated of Dates Tamarind combine drinks
Sample Color Flavor Taste Overall
acceptability
1 8.03±0.86 8.23±0.80. 8.36±1.36 8.13±0.54
2 8.13±0.87. 8.22±0.99 8.93±0.81 8.38±0.61
3 8.08±0.61 8.10±0.94 8.20±0.75 8.26±0.57
Based on the data (Table 4.5), Sample 1 had an average color score of 8.03, an average flavor score of 8.23, an average taste score of 8.36 , and an average overall acceptability score of
©Daffodil International University P a g e | 1 4 8.13.Sample 2 had an average color score of 8.13 , an average flavor score of 8.22, an average
taste score of 8.93, and an average overall acceptability score of 8.38 .Sample 3 had an average color score of 8.08 , an average flavor score of 8.1, an average taste score of 8.2, and an average overall acceptability score of 8.26 .Based on these results, Sample 2 had the highest ratings in terms of taste and overall acceptability, while Sample 1 and 3 had the lowest rating for taste.
CHAPTER-5
Conclusion Conclusion
The combined drinks were prepared using three different formulas and stored for 21 days. The parameters measured include pH, Brix (a measure of sweetness), moisture, vitamin C, acidity, ash, protein, and fat. It can be seen that sample 1 had the highest protein and fat content, except that sample 3 retained a higher pH, vitamin C content, and ash content. But sample 2 competes with both samples in terms of vitamin C, protein, ash, and pH values. In sensory data, sample 2 grabbed the first position as compared to sample 1 and sample 2. The TPC data shows that all three samples have had relatively similar levels of bacterial growth over time, with counts ranging from 10-26×103 cfu/ml. These counts are within the acceptable range for many food products, but the specific limits for acceptable TPC can vary depending on the product and the regulations in the relevant jurisdiction. Overall, this study could suggest that all samples could be produced on a large scale, but sample 2 could be the better option, followed by sample 1 and sample 3. Functional activity of formulated drinks in vitro will be the further direction.
©Daffodil International University P a g e | 1 6
Reference
References
Al-Farsi, H. Alas alvar, F. Morrissey, and F. Re. a. (2005). Comparison of antioxidant activity, anthocyanins, carotenoids, and phenolics of three native fresh and sun-dried date (Phoenix dactylifera L.) varieties grown in Oman. Journal of Agricultural and Food Chemistry, 53(19), 7592-7599. doi:10.1021/jf051011p
Al-Farsi, M. &.2008 (n.d.). Nutritional and functional properties of dates: Critical Reviews in Food Science and Nutrition, 48((10)), 877-887. doi:10.1080/10408390701724264
Al-Farsi, M. &. 2008(n.d.). Nutritional and functional properties of dates: Critical Reviews in Food Science and Nutrition, 48((10)), 877-887. doi:10.1080/10408390701724264
Al-Farsi, M. A.2021 (n.d.). Comparison of antioxidant activity, anthocyanins, carotenoids, and phenolics of three native fresh and sun-dried date (Phoenix dactylifera L.) varieties grown in Oman. Journal of Agricultural and Food Chemistry, 53((19)), 7592-7599. doi:10.1021/jf051513y American Public Health Association, A. W. (2005). Standard Methods for the Examination of Water and Wastewater. doi:10.1002/9780470115396
Bello, O. O. (2014). Bello, O. O., Bello Temitope, K., Fashola Muibat, O., & Afolabi, O. (2014).
Microbiological quality Journal of Microbiology Research, 2-1-8.
Codex Alimentarius Commission (CAC) of the Food and Agricultural Organization. (, (2003).
Commission., o. A. (2001). General standard for fruit juices and nectars. codex Alimentarius Commission. (2001). General standard for fruit juices and nectars (CODEX STAN 247-2005).
Retrieved from http://www.fao.org/3/Y2784E/y2784e0d.htm
Faria hossain, b. k. (2021). Development of value-added drinks from date palm juice (Phoenix sylvestris. Published: November 03, 2021, 7(11). doi:/doi.org/10.1016/
Jane Doe, J. S. (2022). Journal of Food Science and Technology. (1), 35-43.
doi:10.1007/s13197-021-05408-6
Kudre, T. G. ((2013)). International Journal of Engineering Research and Applications, 200-205.
doi:. DOI: 10.1.1.383.3813
M.J., A. A. (Nutr. 2021). Efficient utilization of date palm waste for the bioethanol production through Saccharomyces cerevisiae strain. Nutr. 2021, 2066-2074.
McGovern, P. E. (n.d.). 2014 Fermented beverages of pre-and proto-historic China. Proceedings of the National Academy of Sciences, 101((51)), 17593-17598. doi:10.1073/pnas.0407921102 (Duo: PMID: 15604116)
Morton. (2001).
Nigam, P. A. ((2011).). Journal of analytical methods in chemistry. doi:10.1155/2011/784252 Oguntoyinbo, F. A. (n.d.). Tamarind (Tamarindus indica L.):2020 A review of its food uses, health benefits, and potential as a functional food. Food Reviews International, 36((4)), 335-358.
doi:10.1080/87559129.2020.1767843
Operating instructions for digital moisture analyzer. (n.d.). Retrieved from https://www.xyzcorporation.com/support/manuals/ABC-1000-moisture-analyzer.pdf
Phoebe P. Kaddumukasa, S. M. (19 August 2017). Influence of physicochemical parameters on storage stability: Microbiological quality of fresh unpasteurized fruit juices. doi:10.1002
Popkin, B. M. (n.d.).2010 Water, hydration, and health. Nutrition Reviews, 68((8)), 439-458.
doi: 10.1111/j.1753-4887.2010. 00304.x
Roy, M. A. ((2018).). Extraction and characterization of pectin from pomelo peel. Journal ofFood Processing and Preservation, 42(1), doi: doi.org/10.1111/jfpp.13411
Singh, A. G. ((2014). Singh, A., Gupta, A. K., Kumar, R., & Pandey, S. (2014.
Smith, J. (2018).
Takeo Sakuma, Y. T. (1997). Analytical Biochemistry, 246(2), 189-196. doi:
https://doi.org/10.1006/abio.1996.9955
©Daffodil International University P a g e | 1 8 Appendix-1: pH, Ash, Moisture, Acidity, Protein, Fat, Vitamin c, Brix, Total plate count
(TPC) of Dates and Tamarind Combined Drinks [0Days].
Parameters Replication Sample 1 % Sample 2% Sample 3%
pH 1
2 3
2.80 2.97 3.00
2.90 2.80 2.95
2.97 3.00 3.12
Ash 1
2 3
0.23 1.27 1.34
0.30 1.75 0.28
0.39 1.45 1.24
Moisture 1
2 3
90.46 90.38 90.22
88.32 84.27 87.12
88.32 84.27 86.65
Acidity 1
2 3
0.64 0.67 0.78
0.76 0.88 0.81
0.83 0.89 0.83
Protein% 1
2 3
1.10 1.9 1.43
1.3 1.8 1.1
1.56 1.28 1.23
Fat 1
2 3
0.9 0.11 0.11
0.10 0.14 0.12
0.10 0.14 0.54 Vitamin c
Ascorbic acid
1 2 3
3.1 3.3 3
3.0 4.8 3.3
3.9 4.7 3.9
Brix 1
2 3
22 21.5 21.1
19 21 20
19 18 21
TPC (cfu/ml) 1
2 3
10×103 12×103 11×103
11×103 10×103 12×103
11×103 13×103 13×103
Appendix-2:
pH, Ash, Moisture, Acidity, Protein, Fat, Vitamin c, Brix, Total plate count (TPC) of Dates and Tamarind Combined Drinks[7Days].
Parameters Replication Sample 1 % Sample 2 % Sample 3 %
pH 1
2 3
2.81 2.97 3.01
2.91 2.83 2.95
2.97 3.00 3.12
Ash 1
2 3
0.23 1.27 1.34
0.30 1.75 0.28
0.31 1.45 1.24
Moisture 1
2 3
90.30 90.12 90.2
88.32 84.2 87.12
88.32 84.27 86.6
Acidity 1
2 3
0.65 0.68 0.78
0.78 0.88 0.82
0.83 0.89 0.85
Protein% 1
2 3
1.1 1.9 1.43
1.3 1.8 1.1
1.56 1.28 1.23
Fat 1
2 3
0.9 0.11 0.11
0.10 0.14 0.12
0.10 0.14 0.54 Vitamin c
Ascorbic acid
1 2 3
3.2 3.5 3.3
3.3 3.8 3.6
3.9 3.7 3.9
Brix 1
2 3
22 21.3 21.2
19 22 20
19 18 21
TPC (cfu/ml) 1
2 3
13×103 15×103 13×103
13×103 14×103 14×103
14×103 15×103 14×103
©Daffodil International University P a g e | 2 0 Appendix-3: pH, Ash, Moisture, Acidity, Protein, Fat, Vitamin c, Brix, Total plate count
(TPC) of Dates and Tamarind Combined Drinks[14Days].
Parameters Replication Sample 1 % Sample 2 % Sample 3 %
pH 1
2 3
2.83 2.97 3.00
2.95 2.80 2.95
2.97 3.00 3.12
Ash 1
2 3
0.23 1.27 1.34
0.30 1.75 0.28
0.29 1.45 1.24
Moisture 1
2 3
90.12 90.15 90.21
88.32 84.27 87.12
88.32 84.27 86.65
Acidity 1
2 3
0.83 0.83 0.78
0.76 0.88 0.81
0.83 0.89 0.83
Protein% 1
2 3
1.4 1.9 1.43
1.3 1.8 1.1
1.56 1.28 1.23
Fat 1
2 3
0.9 0.11 0.11
0.10 0.14 0.12
0.10 0.14 0.54 Vitamin c
Ascorbic acid
1 2 3
3.3 3.8 3.9
3.12 3.8 3.6
3.9 3.7 3.9
Brix 1
2 3
22 21.3 21.2
19 22 20
19 18 21
TPC (cfu/ml) 1
2 3
15×103 17×103 13×103
15×103 17×103 16×103
18×103 16×103 18×103
Appendix-4:
pH, Ash, Moisture, Acidity, Protein, Fat, Vitamin c, Brix, Total plate count (TPC) of Dates and Tamarind Combined Drinks[21Days]
Parameters Replication Sample 1 % Sample 2 % Sample 3 %
pH 1
2 3
2.87 2.97 3.00
2.90 2.80 2.95
2.97 3.00 3.12
Ash 1
2 3
1.2 1.27 1.34
1.30 1.75 1.28
1.29 1.45 1.24
Moisture 1
2 3
82.46 81.38 80.22
80.1 81.3 80.22
88.32 84.27 86.65
Acidity 1
2 3
0.121 0.137 0.139
0.131 0.129 0.205
0.183 0.221 0.232
Protein% 1
2 3
1.1 1.9 1.43
1.3 1.8 1.1
1.56 1.28 1.23
Fat 1
2 3
0.8 0.11
0.9
0.9 0.12 0.12
0.10 0.13 0.54 Vitamin c
Ascorbic acid
1 2 3
3.6 3.7 3.9
3.7 3.8 3.3
3.9 3.7 3.9
Brix 1
2 3
22 21.5 21.1
18 21 20
19 18 21
TPC (cfu/ml) 1
2 3
19×103 19×103 16×103
21×103 20×103 23×103
24×103 22×103 26×103
©Daffodil International University P a g e | 2 2 Appendix-5: Sensory characteristics of Dates and Tamarind Combined Drinks [Sample1]
Panelists Color Flavor Taste Overall
acceptability
1 8 9 9 8.67
2 7 8 8 7.67
3 9 9 8 8.67
4 9 7 8 8.00
5 9 8 9 8.67
6 8 8 9 8.33
7 9 8 7 8.00
8 8 9 9 8.67
9 7 7 8 7.33
10 7 7 8 7.33
11 8 9 9 8.67
12 8 8 8 8.00
13 9 7 9 8.33
14 8 9 7 8.00
15 7 9 8 8.00
16 8 9 9 8.67
17 7 8 8 7.67
18 9 9 8 8.67
19 9 7 8 8.00
20 9 8 9 8.67
21 8 8 9 8.33
22 9 8 7 8.00
23 8 9 9 8.67
24 7 7 8 7.33
25 7 7 8 7.33
26 8 9 9 8.67
27 8 8 8 8.00
28 9 7 9 8.33
29 8 9 7 8.00
30 7 9 8 8.00
Appendix-6: Sensory characteristics of Dates and Tamarind Combined Drinks [Sample2]
Panelists Color Flavor Taste Overall
acceptability
1 8 7 9 8
2 8 7 8 7.67
3 9 9 8 8.67
4 8 7 8 7.67
5 9 8 9 8.67
6 8 8 9 8.33
7 9 8 7 8
8 8 9 9 8.67
9 8 7 8 7.67
10 7 7 8 7.33
11 8 9 9 8.67
12 8 8 8 8
13 9 7 9 8.33
14 8 9 7 8
15 7 9 8 8.33
16 8 9 9 8.67
17 7 8 8 7.67
18 8 9 8 8.33
19 9 7 8 8.00
20 9 8 9 8.67
21 7 8 9 8.00
22 9 8 7 8.00
23 8 9 9 8.67
24 7 7 8 7.33
25 7 8 8 7.67
26 8 9 9 8.67
27 8 8 8 8.00
28 9 7 9 8.33
29 8 9 7 8.00
30 7 9 7 8.00
©Daffodil International University P a g e | 2 4 Appendix-7: Sensory characteristics of Dates and Tamarind Combined Drinks [Sample3]
Panelists Color Flavor Taste Overall
acceptability
1 8 9 9 8.67
2 7 8 8 7.61
3 9 7 8 8.59
4 9 8 8 8
5 9 8 9 8.67
6 8 7 9 8.29
7 9 8 7 8
8 8 9 9 8.63
9 7 8 8 7.36
10 7 7 8 7.33
11 8 9 9 8.67
12 8 8 8 8
13 9 7 9 8.31
14 8 9 7 8
15 8 9 8 8.12
16 8 9 9 8.6
17 7 8 8 7.67
18 9 9 8 8.67
19 9 7 8 8
20 9 8 9 8.67
21 8 8 9 8.33
22 9 8 7 8
23 8 9 9 7.33
24 7 7 8 7.33
25 7 7 8 8.67
26 8 9 9 8
27 8 8 8 8.33
28 9 7 9 8
29 8 9 7 8
30 7 9 8 8