©Daffodil International University
GUAVA DISEASES DETECTION USING IMAGE PROCESSING BY
ABDUR ROUF ID: 153-15-6416 TONMOY MONDAL
ID: 153-15-6351
This Report Presented in Partial Fulfillment of the Requirements for the Degree of Bachelor of Science in Computer Science and Engineering.
Supervised By Md. Azizul Hakim
Lecturer
Department of Computer Science and Engineering Faculty of Science & Information Technology
Daffodil International University Co-Supervised By
Ms. Rubaiya hafiz Lecturer
Department of Computer Science and Engineering Faculty of Science & Information Technology
Daffodil International University
DAFFODIL INTERNATIONAL UNIVERSITY DHAKA, BANGLADESH
JULY 2019
©Daffodil International University i
©Daffodil International University ii
©Daffodil International University iii
ACKNOWLEDGEMENT
At first, we are thankful to Almighty Allah for his mercy and grace without which we wouldn’t be able to complete our project. We had to work hard to get the job done but we are grateful to some other people, without the help of whom this project couldn’t be as it is. We tried our best and finally this project is completed.
At first, we’d like to thank our respected Supervisor, Md. Azizul Hakim, Assistant Professor and Co-Supervisor Ms. Rubaiya hafiz, Department of Computer Science & Engineering, Daffodil International University. This whole time they have supported us, inspired us and showed us the right way. They made it easier for us to work continuously with all their patience and inspirations. Every time we had a difficulty, we contacted them and they helped us with a suggestion and that helped us a lot throughout the whole time.
They were so friendly with us this whole time and that was the main inspiration for us. We are so lucky to work under their supervision and of course, it has been an honor to work under their supervision. We also want to our express our deepest gratitude to honorable Professor and Head of CSE department, Dr. Syed Akhter Hossain.
At last, again we want to thank all the good wishers, friends, family, seniors for all the help and inspirations. This research is a result of hard work and all those inspirations and assistance.
©Daffodil International University iv
Abstract
Guava is one of the most familiar fruits in Bangladesh and it is the poor man’s apple for Bengali people. The production of guava is decreasing day by day because of affecting different types of diseases. Most common diseases of guava are Anthracnose, Fomopsis rot, Fruit fly, Mealy bug, White fly, Shooty mould etc. These kind of diseases spoil the fruit growth and due to unworthiness, the fruits are not marketable, transit able and ineligible to eat. It is very harmful problem for the guava farmers and it does heavy loss so that they cannot afford their livelihood.
The first three is our concerned. Premus persica is the reason of fomopsis rot. Due to this disease the fruit becomes hard and erupts brown spots. Insects lay on eggs inside the fruit and grow up new insects and eat the inner side of the guava and the fruit is going to rot is known as fruit fly.
Anthracnose is also the brown colored spot outer side of guava and it increases day by day. It becomes sore and split the fruit. The climatic condition in Bangladesh also favours fruit rot due to higher temperature and humidity. Our paper deals with the diseases of guava which commonly occur in Bangladesh along with their management practices. The aim of designing this approach is to identify these diseases automatically by using images without any human efforts
©Daffodil International University i
TABLE OF CONTENTS
CONTENTS Page No.
Approval i
Declaration ii
Acknowledgments iii
Abstract iv
CHAPTER 1: INTRODUCTION
1-31.1 Introduction 1
1.2 Background 1
1.3 Problem Statement 2
1.4 Expected Outcomes 2
1.5 Scope of Study 3
1.6 Thesis Organization 3
CHAPTER 2
:LITERATURE REVIEW 4-72.1 Introduction 4
2.2 Overview of Guava diseases 4
2.3 Related works 5
2.4 Research summary 6
2.5 Conclusion 7
CHAPTER 3
:RESEARCH METHODOLOGY
8-203.1 Introduction 8
3.2 Work flow 8
3.3 Data Collection 14
3.4 Data processing 14
3.5 Statistical Analysis 15
3.6 Proposed Methodology 16
CHAPTER 4
:EXPERIMENTAL RESULTS AND DISCUSSION
21-27
4.1 Experimental Results 21
©Daffodil International University
CHAPTER 5
:SUMMARY AND CONCLUSION
285.1 Summary of the study 28
5.2 Limitation 28
5.3 Future Work 28
REFERENCES
29APPENDIX
30LIST OF FIGURES
Fig 3.1: Diagram of workflow 8
Fig 3.2: Architecture of Inception v3 9
Fig 3.3: Transfer learning 10
Fig 3.4: Convolution layer 11
Fig 3.5: Cross entropy error function 13
Fig 3.6: Anthracnose of guava image 14
Fig 3.7: Fomopsis rot of guava image 15
Fig 3.8: Fruit fly of guava image 15
Fig 3.9: convolutional neural network 17
Fig 3.10: inception-v3 module 19
Fig 4.1: Comparison of accuracy between Anthracnose, Fomopsis rot and Fruit
fly 21
Fig 4.2: Correctly classified 4 anthracnose image 24
Fig 4.3: Incorrectly classified 4 anthracnose image 24
Fig 4.4: Correctly classified 4 fomopsis rot of guava image 25 Fig 4.5: Incorrectly classified 4 fomopsis rot of guava image 25 Fig 4.6: Correctly classified 4 fruit fly of guava image 26 Fig 4.7: Incorrectly classified 4 fruit fly of guava image 26
Fig 4.8: Iteration vs Accuracy 27
Fig 4.9: Comparison of specificity, Recall and false positive rate and precision 27
LIST OF TABLES
Table PAGE
Table 2.1:Research summary 6
Table 4.1: Accuracy measure using confusion matrix 23
©Daffodil International University 1
CHAPTER 1 Introduction
1.1 Introduction:
Several diseases have been found on Guava in the modern agricultural science. In spite of that we have to fix our research area in the three most renowned diseases into the guava according to our country. Mentioned the three consequence diseases are Anthracnose of guava, Fomopsis of guava and finally, Fruit fly of guava. In this report, there are several subsections we are covering where defines the overview of our research project. Such as, the background section is briefly describing the identification of project and related issue. And our research objective is how we find the diseases guava to more easy and reliable way from farmer to researcher.
1.2 Background:
Guava, the scientific name is psidium guajava, is most renowned fruit in subtropical area. It also known as most healthy food and widely grown in Asia. Many people are eating this fruit habitually. However, recently there are many factor that make reduce the production of this fruit.
The factor or diseases would be defined in earlier section where we notice the specific diseases name.
For instance, in 2018, hundreds of guava drastically fall in production and attack various types of fungus. Most of the guava orchards are giving a low production because of the diseases. As there is no agro-based industry for the fruit, growers are often compelled to sell their produce at throwaway prices.
According to fact that, we have to collect 1200 image from Chapai Nawabganj guava orchards which is located on the north-western part of Bangladesh and it is a part of the Rajshahi Division.
Here we also try to find out the diseases which being caused for less production. And noticed that from Deputy Director of DAE (Department of Agriculture Extension), said that the crop is being cultivated on more than 4500 hectares or land in the region of Rajshai, Naogaon, Natore
©Daffodil International University 2
and Chapai Nawabganj where there are 1500 orchards of thai guava at present. DAE has given knowledge to the farmers about the cultivation process of Thai variety. Per kilogram of thai guava is now being sold at tk 90 to 120.
1.3 Problem statement
Anthracnose caused by (Colletotrichum gloeosporoides : Westcott 1971) and the disease is the most commonly observed disease that affects both pre and post-harvest growing of guava. This disease can cause considerable postharvest losses and can affect young developing flowers and fruit. These disease symptoms consist of sunken, dark colored, necrotic lesions. Another is Phomopsis rot symptom starts at calyx disc of the fruit during rainy season and affected area is covered with whitish cotton like growth which develops very fast as the fruit matures and pathogen is able to cover almost the entire surface within a period of 3-4 days during humid weather. And the skin of the fruit it turns light brown to dark.Bactrocera correcta is a species of tephritid fruit files that is widely distributed in Southeast Asia. And it has transverse facial spots and incomplete costal band. Fruit flies lay their eggs inside the fruit and maggots feed on the flesh. As a result fruits rot and infestation often spread quickly. Almost every guava producer in Bangladesh are facing problem of fruit flies attack and their yields are greatly affected. It also takes the time to detect the disease and manually checks for farmer.
1.4 Expected Outcome
The development of the application has met its specification successfully. And form data set accuracy we get 91.48% good result. Hopefully it will be more accurate in near future from other sight of development.
©Daffodil International University 3
1.5 Scope of study
The users of the system basically they are farmer and some researcher. The prototype is designed in python and in future if somebody are try to do more finding in guava diseases it should be model for them.
1.6 Thesis Organization
This thesis are consists of five chapter ranging from chapter 1 until chapter 5. Chapter 1 are gives an summary of this topic. And additionally comprise of problem statement where we describe the mentioned diseases, Expected output there are we find the accuracy and the scope of study.
In the meantime, chapter two is defined by the past work or research was led by the other scientist. All the significant points are describes in this chapter and elaborate the topic. In chapter 3, we are illustrating the procedure for framework improvement and process stream in detail of these examinations. Also we have to investigate our calculation is being utilized and our method is reliable exploit in field work. Moreover, in chapter 4 we have to comprise of expected outcome or yields, lacking of task and further research. After that, in chapter 5 we have bring conclusion where finished up the general examination and limitation.
©Daffodil International University 4
CHAPTER 2 Background 2.1 Introduction
This chapter will provide a pure concept of the previous work about our topic which is “Guava Diseases”. Also the section is more clarify about the related work where what are the researcher actually done. Generally, in this chapter we had to include the three areas in section. First of all, the primary segment s portrays sketch of Guava diseases then discuss about the kind of diseases.
Finally, the last part had to talk about the strategy and technique.
2.2 Overview of Guava diseases
Eventually, in section firstly introduce what is basically guava disease and giving symptoms of those diseases. Moreover that subsection will give a clear understanding what looks like a guava diseases in real field.
2.2.1 Sketch of Guava diseases
Guava is more useful and healthy fruits in subtropical countries where the fruits are affected by 177 pathogens of which, 167 are fungal, 3 bacteria and 1 epiphyte [1]. Thus though the guava is hardy plant but it suffers by number of important diseases and they are high loss of guava production in Bangladesh and abroad.
2.2.2 Kind of Guava diseases
Basically the researcher are works the two type’s diseases that are field and post harvest diseases.
For instance, Wilt is the most important diseases of guava as the diseases is soil borne in nature, there are limitations it’s control. Comprehensive review has been done on wilt diseases of guava by Prakash and Misra (1993). Another kind of diseases is Leaf blight which is first reported by
©Daffodil International University 5
Sridhar. There are first symptom is the appearance of small circular spots with dark brown centre.
2.2.3 Strategy and Technique
The researcher is firstly addressing the disease name and then they are deals with the geographical distribution. And knowing that what had been actual caused for losses production, after that they have to study symptomatology and causal organism about the diseases. Finally, they have to try to management the diseases.
2.3 Related works
We are working on thesis on guava disease detection. We see that no one is worked on this topic.
We know that guava is very popular in our country. A lot of people livelihood depends on this guava business. There is worked on guava leaf disease ant that there is a work on other fruit. So we are giving some research work on related topics. The first work done on guava leaf disease done by M.Thilagavathi who is a Research scholar of Department of computer science from Annamalai University and S.Abirami who is Assistance professor of department of computer science and engineering from Annamalai University. The use k-Nearest Neighbor classifier to classify the image and they worked on 5 diseases, using K-NN they get the average correct classifying result is 92%.And using Support vector machine classifier they get the good result of classification which is 97%.
©Daffodil International University 6
2.4 Research summary
2.1 Table: Research summary
SL Author Methodology or Using
tool
Description Outcome Accuracy 1 M.Thilagavathi,
S.Abirami[3]
k-Nearest Neighbor classifier
Classification Guava Leaf Diseases
92%
2 M.Thilagavathi, S.Abirami [3]
Support vector machine classifier
Classification Guava Leaf Diseases
97%
3 Md. Tarek Habib , Anup Majumder , A.Z.M.
Jakaria , Morium Akter, Mohammad Shorif Uddin, Farruk Ahmed[4]
Support vector machine classifier and k-means clustering algorithm
papaya disease recognition
90.50%
4 Sukhvir Kaur Shreelekha Pandey Shivani Goel[5]
k-Nearest Neighbor classifier
Leaf spots and leaf blotch
93%
5 Jagadeesh Devdas Pujari, Rajesh Yakkundimath,
Abdulmunaf Syedhusain Byadg[6]
Statistical Texture Features
Anthracnose Fungal Disease of Fruits
84.65%
6 Diptesh Majumdar , Dipak Kumar Kole ,Aruna Chakraborty ,Dwijesh Dutta Majumder[7]
Optimum Global Thresholding using Otsu’s
Detection plant leaf disease using integrated image processing approach
98%
©Daffodil International University 7
7 AmandaRamcharan,Kelsee Baranowski, Peter
McCloskey,Babuali Ahmed, James Legg and David P. Hughes [8]
Convolutional neural network Inception v3
Cassava Disease Detection
84%
2.5 Conclusion
From that brief discussion, this chapter presented the concept of a method for detecting the guava diseases. By reviewing the section we learned basically what process to detect or address the guava diseases is. Finally, through the section we have to deal with a simple characteristic of guava disease detection.
©Daffodil International University 8
CHAPTER 3 Research Methodology
3
.1 IntroductionThis chapter is to understand the approach and technique for the thesis. Method or approach have been used for the designing and implementing the thesis. This is also including this chapter. This chapter also discussed the workflow of this thesis.
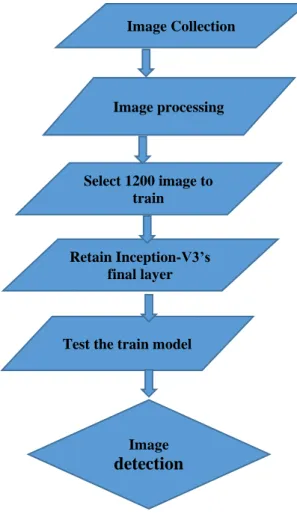
3.2 Work Flow
Fig 3.1: Diagram of workflow
Image Collection
Image processing
Select 1200 image to train
Retain Inception-V3’s final layer
Test the train model
Image
detection
©Daffodil International University 9
3.2.1 Inception-V3
We use image recognition model which is called inception V3. Inception v3 have tow parts.One is feature extraction part with a convolutional neural network and the other is Classification part with fully-connected and softmax layers. We can discuss some main part of inception v3 such as transfer learning, convolution layer, max polling, and fully connected layer, The inception v3 model introduced a very tricky factorization which is factorize big kernel to small kernel.
Example, 7 ×7kernel=two 5×5 kernels with two strides and two 5×5 kernels with two strides=three 3×3 kernels with one stride.
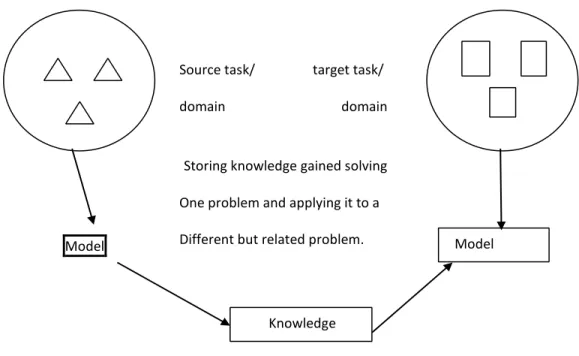
Fig 3.2 Architecture of Inception v3 3.2.2. Transfer learning
Gaining knowledge from one solved problem, Apply that to another related problem is one of the uses of transfer learning. Enough training data collection to rebuild models is a problem.
Transfer learning’s main aim is to transfer knowledge from source domain to target domain.
Here source domain and target domain must contain large dataset and small dataset accordingly.
There are different feature spaces between domain data or source task. Target tasks are focusing on different topics and boosting the performance itself. Transfer learning using CNNs is used various field. Transfer learning have few scenarios. Among them three major scenario are ConvNET, which is known as fixed feature extractor. The network is trained on large dataset like ImageNet and also trained all the parameters of the neural network and it takes hours on GPU.
We use the pre-trained Inception-V3 for our analysis by loading all layers of the Inception-V3 with pre-trained weights. We used to transfer learning to retrain our dataset which is different from Inception-V3 images. To classify our dataset we build a new model, then reuse the feature extraction part and re-train the classification part with our dataset.
©Daffodil International University 10
Fig 3.3 transfer learning
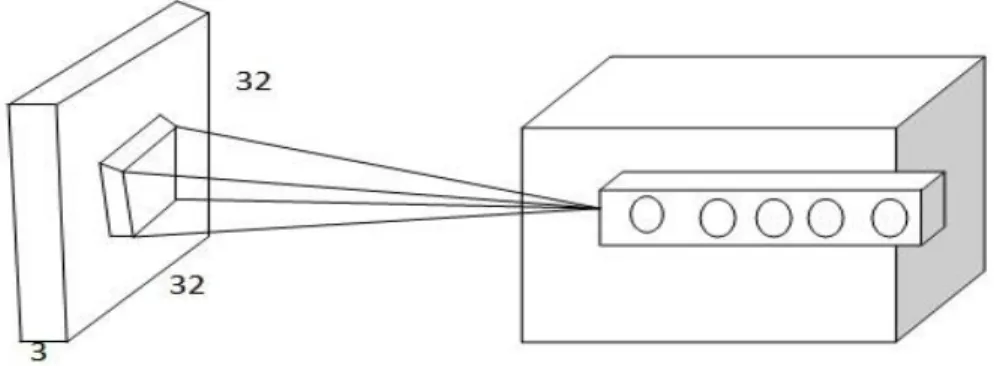
3.2.3 Convolutional layer:
Convolution layer extract feature from an input image. A convolutional operation is performed to the input and then passes the result to the next layer. Using small squares of input data, convolution learns image features and preserves the spatial relationship between pixels. CONV layer’s parameters are made of a set of learnable filters. Every filter is small spatially (along width and height), but extends through the full depth of the input volume. An example of convolution layer is:
Source task/ target task/
domain domain
Storing knowledge gained solving One problem and applying it to a Different but related problem.
Model Model
Knowledge
©Daffodil International University 11
Fig 3.4: Convolution layer
It is an input volume in red (e.g. a 32x32x3 CIFAR-10 image), and an example volume of neurons in the first Convolutional layer. Each neuron in the convolutional layer is connected only to a local region in the input volume spatially, but to the full depth and there are multiple neurons (5 in this example) along the depth, all looking at the same region in the input.
3.2.4 Rectified linear unit (ReLU)
Rectifired linear unit is called ReLU. Deep learning networks for hidden layers, where rectified linear unit is use.Rectifired linear unit is a activation function.Input is les than 0 then the function return 0 and it return output equal to the input if input is greater than 0.so we can call that output is derivative either 0 or 1. Derivative is just one when the input is positive.for that on the back propagated error is no effect. Here we can write as like
𝑓(𝑥) = 𝑚𝑎𝑥(𝟎, 𝒙)
The input to a neuron is x. For large network rectified linear unit is used. because it give very fast result
©Daffodil International University 12
3.2.5 Max pooling
Pooling or down sampling reduces the dimensionality of each sub-region but saves the most significant information. Pooling layer is inserted in-between every consecutive Conv layers in convolutional Neural network architecture. We used max pooling to reduces the dimensionality and get the highest element of each sub-region.max pooling uses the maximum value from each sub-region of every node at the previous layer. Max pooling is discarded 75%
of the activations and controlling overfitting.
3.2.6 Fully Connected Layer
Fully Connected layers are not defined by the number of nodes, just by how they are connected to adjacent layer`s nodes. The fullyConnected layer also introduced by Dense layers used in classification adding previous layer neurons to every neuron on the next layer. Different types of function like softmax activation function, SVM, and many others are used here for high- level reasoning in the neural network. But in our model, we stick used softmax for classification. After several convolution and pooling layers, we get some high-level features as input. These input images features are used as classifying to explore various classes. But when we combine convolution layer`s features and polling layer`s features it gives the better result of classifications. In Fully Connected layers summation of output probabilities is 1.One Conv layer share weights with other Conv layers.It is very difficult to attach all nodes with a softmax layer that’s why we use a fully-connected layer to increase the efficiency of classification in our model.
3.2.7 Softmax
Let us consider a classification model to classify with n classes. This model takes input datasets and an algorithm and produces a score of each class. The softmax activation function converts from score to the probability between 0 to 1.the summation of all probabilities is 1.we used this function to the final layer of convolutional neural networks to classify the classes.
©Daffodil International University 13
This function is produced multiple class from an input array. The probability distribution of softmax function is:
Where i=1,2,3,…….n and j=1,2,3,…….n
3.2.8 Cross Entropy
Cross-entropy loss, or log loss, measures the performance of a classification model whoseoutput is a probability value between 0 and 1. Cross-entropy loss increases as the predictedprobability diverge from the actual label. In our classification tasks to classify no-ball based on images of no-ball, a very common type of loss function to use is Cross Entropyloss.It is defined as
(𝑝, 𝑞) = [−log𝑞] = (𝑝) + 𝐷𝑘(𝑝||𝑞)
Where H(p) is the entropy of p.
(𝑝||𝑞) is the kullback-leibler divergence of q from p.
©Daffodil International University 14
Fig 3.5: cross entropy error function
3.3 Data collection:
In our model to classify anthracnose, fomopsis rot and fruit fly of guava. We give image as input.
The dataset we use which is contain fifteen hundred image. We use twelve hundred image to train the model and another three hundred image to test the model. Our train image contains three classes, Anthracnose of guava which is contain four hundred image, Fomopsis rot of guava which is contain four hundred image and Fruits fly of guava which is contain another four hundred image. Like as train test contain three classes anthracnose of guava, fomopsis rot of guava and fruit fly of guava, every class contain one hundreds image. We collect the image from the field. We use the real image to get the better result.
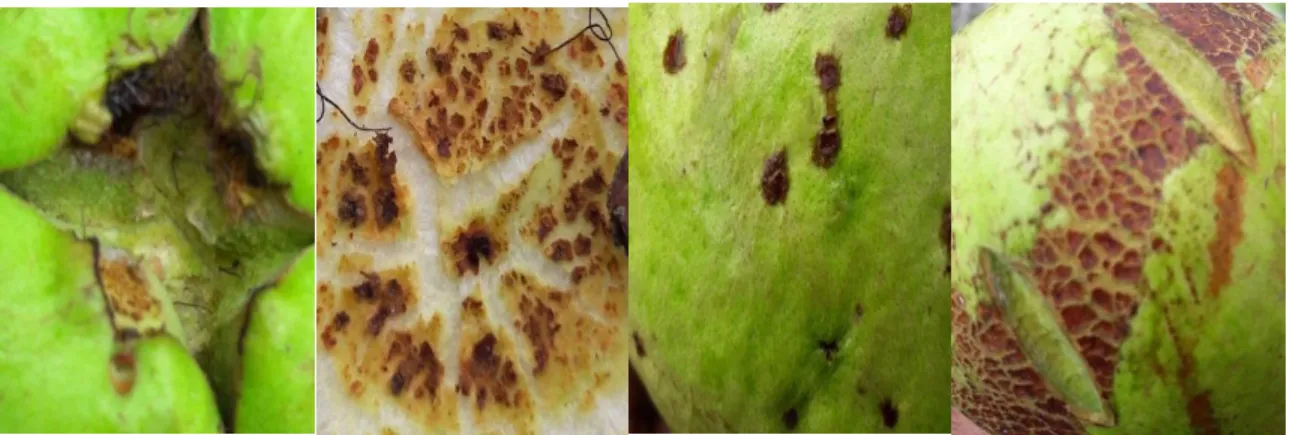
3.4 Data processing:
First of all, we create three classes and we put the right image in right class. Those image have very different dimension so we use adobe Photoshop to resize the image. We set the image size 300*300 dimension. Here we give some example image of our data set.
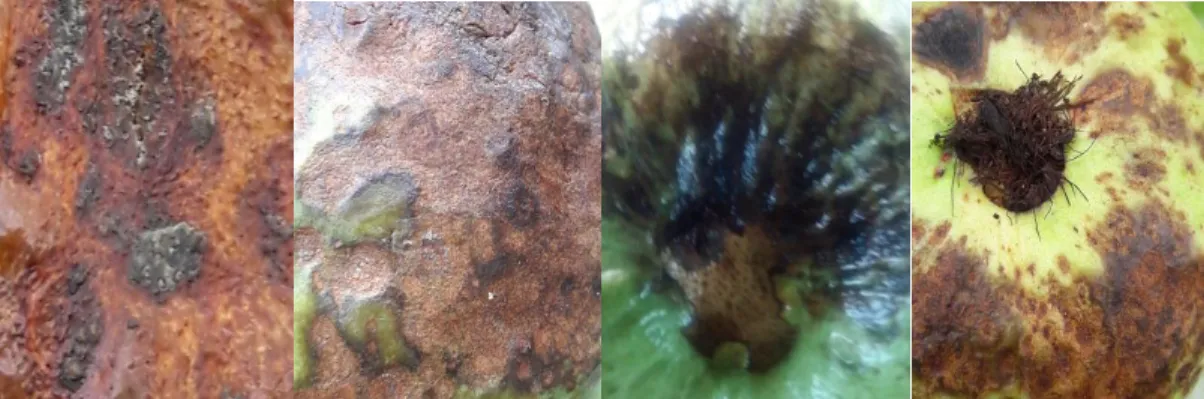
Anthracnose:
Fig 3.6: Anthracnose of guava image
©Daffodil International University 15
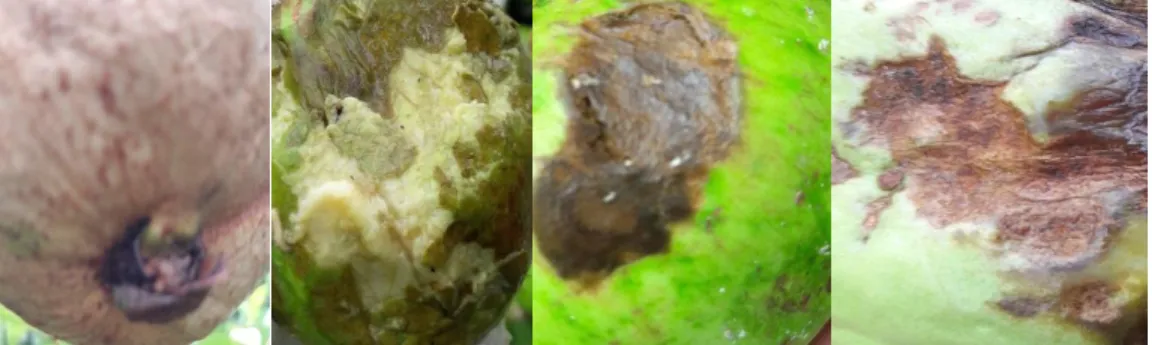
Fig 3.7 : 4 Fomopsis rot of guava image
Fruit fly:
Fig 3.8: 4 fruit fly of guava image
3.5 Statistical analysis:
We train our model inception-V3 with twelve hundred image and retained Inception-v3’s final layer. After that we test the retained model. We test the model with three hundred image for three class and we check each image of every test classes that if it is anthracnose, fomopsis or fruit fly of guava.
©Daffodil International University 16
3.6 Proposed methodology
Convolution neural network is use in our proposed method. We build the architecture with four type main layer. One is convolution layer. Rectified linear unit (ReLU) layer max pooling and fully connected layer and one the other is function which is called softmax. This is work to classify the probability of all outputs.
In each convolution layer we measure width and height to get the dimension from the previous activation by used be these following equation
Here ,
P is pointing to the padding size S is pointing to the number of stride 𝐹𝑤 is for width of the convolution filter 𝐹ℎ pointing to height of the convolution filter 𝑁𝑤(𝑙−1) is pointing width of the previous layer
𝑁ℎ[𝑙−1] is pointing height of the previous layer
The equation of maxpoll layer
©Daffodil International University 17
Here,
=width of the previous layer
𝑁ℎ[𝑙−1]=height of the previous layer 𝐹𝑤=width of the convolution filter 𝐹ℎ=height o the convolution filter Nc=number of channel
Measure the ReLU activation by the equation:
(𝑥) = log(1 + 𝑒𝑥)
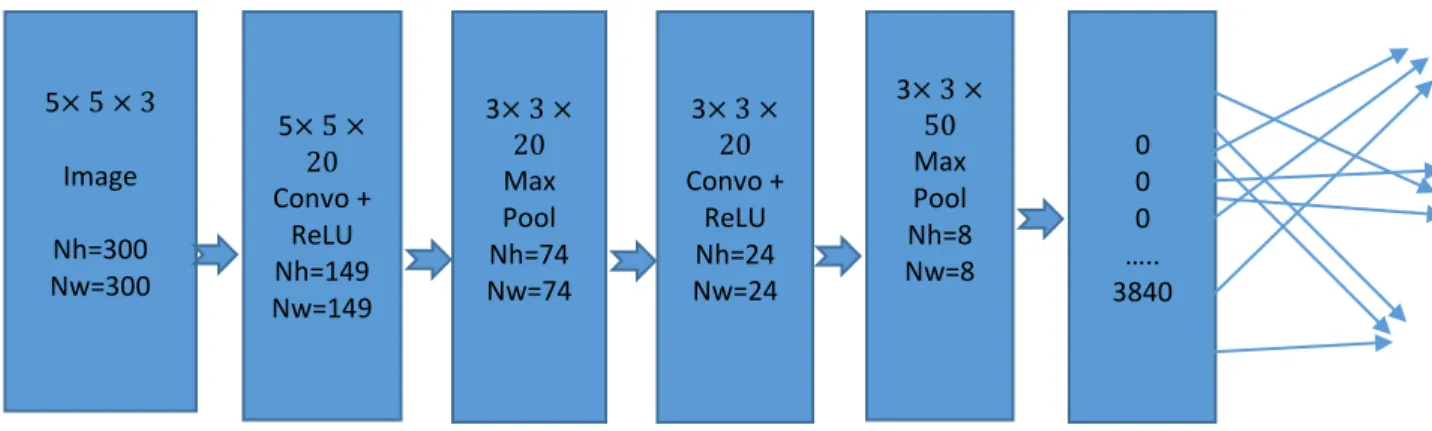
Fig 3.9 : convolutional neural network
Our model take input as raw pixels value of the image with dimension 300×300×3.the dimension is described as width:300, height:300 and the number of channels are 3.channel 3 means it contains the color of Red, Green, and Blue.
5× 5 × 3 Image Nh=300 Nw=300
5× 5 × 20 Convo +
ReLU Nh=149 Nw=149
3× 3 × 20 Max Pool Nh=74 Nw=74
3× 3 × 20 Convo +
ReLU Nh=24 Nw=24
3× 3 × 50 Max Pool Nh=8 Nw=8
0 0 0
…..
3840
©Daffodil International University 18
we apply 5×5 convolution layer and ReLu with padding p=0and stride s=2 for out input image to compute the output of neurons. This layer is multiplied by the input image and we decided to use 20 filters.apply the 5×5 convolution layer to get the neurons as output is 149×149×20.
For this output, we apply 3×3 max pool with stride s=2 to compute the output of neurons. The output is 74×74×20. Both conv+Relu and max pool are represented layer one.
For the next step, we apply 3×3 c convolution layer+ ReLu with padding p=0 and stride s=3 and decided the number of filters is 20.again this layer is multiplied by the previous activation output and produce the output neurons is 24×24×20.
Again we apply 3×3 max pool with stride s=3 and number of filters is same as the previous convolution layer.the output of the layer is 8×8×50.
ReLu layer is applied an elementwise activation function and the output volume is unchanged.
The fully connected layer is made by the all activations of in the previous layer and computes the class score.the volume of the resulting size is 3840.
We want to increase the accuracy of our proposed model that’s why we use inception v3 in the last layer in our model.inception v3 is a pre-trained model by GooLeNet.
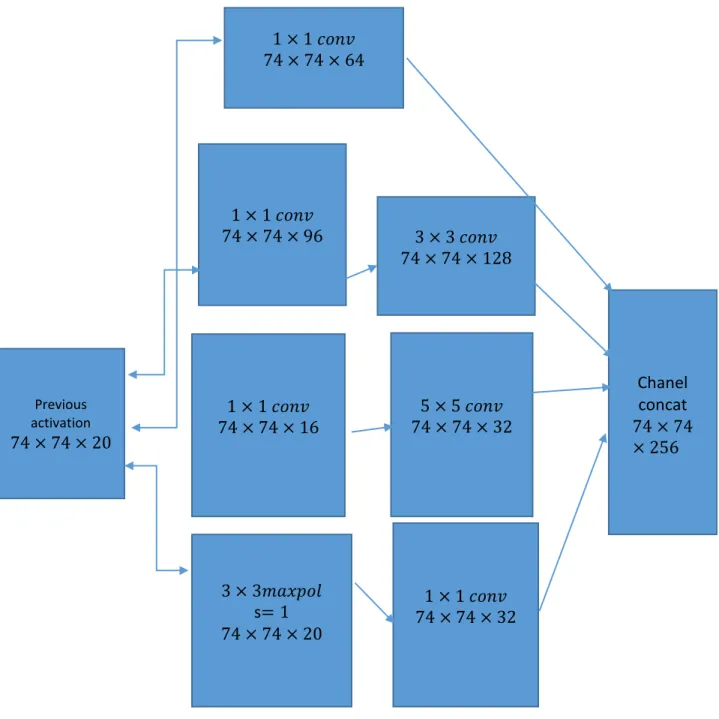
We will describe a small portion of inception v3.the module contain a different type of convolution layer: 1×1,3×3,5×5 and 3×3 max pooling.each convolution working in parallel and concatenating the resulting feature maps before going to the next layer.
©Daffodil International University 19
Fig 3.10: inception-v3 module
1×1 convolution is key because it will be used to reduce the dimensionality of its feature map.out previous activations are 74×74×20.here width: 74, height:74 and number of channel is 20.apply 1×1 convolution with a number of channels 64 and padding p=0 and stride s=1.the output is 74×74×64.
Previous activation
74 × 74 × 20
1 × 1𝑐𝑜𝑛𝑣 74 × 74 × 96
1 × 1𝑐𝑜𝑛𝑣 74 × 74 × 16
3 × 3𝑚𝑎𝑥𝑝𝑜𝑙 s= 1 74 × 74 × 20
1 × 1𝑐𝑜𝑛𝑣 74 × 74 × 64
3 × 3𝑐𝑜𝑛𝑣 74 × 74 × 128
5 × 5𝑐𝑜𝑛𝑣 74 × 74 × 32
1 × 1𝑐𝑜𝑛𝑣 74 × 74 × 32
Chanel concat 74 × 74
× 256
©Daffodil International University 20
Applying another 1×1 convolution followed by 5×5 convolution with padding p=2 and stride s=1 and number of channels 32.the output is 74×74×32.
Applying another 1×1 convolution followed by 3×3 convolution with padding p=1 and stride s=1 and number of channels 128.the output is 74×74×128.
Apply 3×3 max pooling with stride s = 1 followed by the 1×1 convolution with padding p=0 and stride s=1 and the output is 74×74×32. The channel concatenation is the summation of all the convolution layer and max pool layer is 53×54×256.
Applying inception v3 in our proposed method to increase the accuracy. The accuracy of our proposed method is 91.48%
©Daffodil International University 21
CHAPTER 4
Experimental results and discussion
4.1 EXPERIMENTAL RESULTS
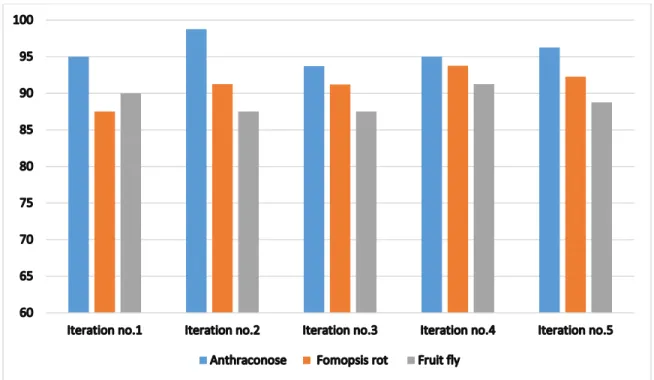
We use three hundred image as a test data set in five different datasets to get the accuracy value to measure the performance of the proposed system. We use twelve hundreds image dataset , Where we used nine hundred sixty hundreds use as train dataset and rest of is test dataset in five iteration .we get the average accuracy is 91.48% which is good result because we get this result . These five iteration we drew the graph between iteration vs accuracy. By using the binary confusion matrix, we calculated the result of precision, recall, specificity, false positive rate, f- measure, and the accuracy.
Here we see the accuracy of the three diseases in five iterations by graph chart.
Fig 4.1: Comparison of accuracy between Anthracnose, Fomopsis rot and Fruit fly
©Daffodil International University 22
Confusion matrix is a table which is define the performance of a classification model on data set.
Confusion matrix contain four terms which is given below.
❖ True positive (TP)
❖ True negative (TN)
❖ False positive (FP)
❖ False negative (FP)
Precision: Positive predicted value of a confusion matrix is called precision. Where it is representing the fraction of relevant instances in retrieved instances. An algorithm gave more relevant or true result then the irrelevant or false result.
Precision = 𝑇𝑃 𝑇𝑃 + 𝐹𝑃⁄
Recall: Sensitivity is known as recall. Recall is representing the fraction of relevant instances which have retrieve over the total amount of relevant instances. To measure of relevance, we use recall.
Recall= 𝑇𝑃 𝑇𝑃 + 𝐹𝑁⁄
F-Measure: F-Measure is the weighted average value of precision and recall. So we can see that this F-measure is fully depends on the result of precision and recall.
F-Measure= 2 ∗ 𝑅𝑒𝑐𝑎𝑙𝑙 ∗ 𝑃𝑟𝑒𝑐𝑖𝑠𝑖𝑜𝑛 𝑅𝑒𝑐𝑎𝑙𝑙 + 𝑃𝑟𝑒𝑐𝑖𝑠𝑖𝑜𝑛⁄
Accuracy: Accuracy is the degree of matching of the prediction and the actual data set. Here is the rule of accuracy,
Accuracy= 𝑇𝑃 + 𝑇𝑁 𝑇𝑃 + 𝑇𝑁 + 𝐹𝑃 + 𝐹𝑁⁄
False positive rate: False positive rate is representing that, Our propose method predict the disease anthracnose when it is actually not anthracnose.
©Daffodil International University 23
False positive rate= 𝐹𝑃 𝐹𝑃 + 𝑇𝑁⁄
Specificity: Specificity is that which is describe that proposed method predict the disease name anthracnose when it is actually anthracnose.
Specificity= 𝑇𝑁 𝑇𝑁 + 𝐹𝑃⁄
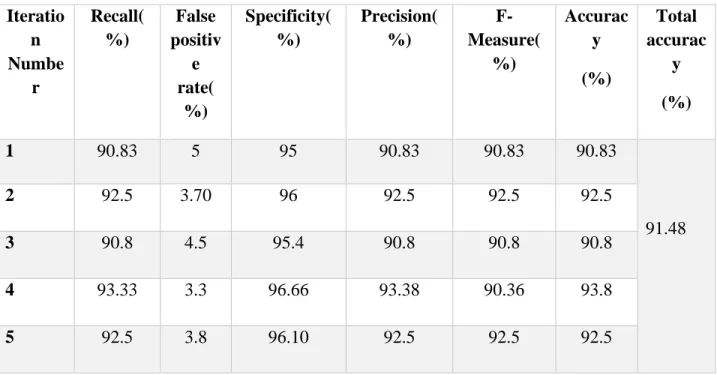
Table 4.1: Accuracy measure using confusion matrix Iteratio
n Numbe
r
Recall(
%)
False positiv
e rate(
%)
Specificity(
%)
Precision(
%)
F- Measure(
%)
Accurac y (%)
Total accurac
y (%)
1 90.83 5 95 90.83 90.83 90.83
91.48
2 92.5 3.70 96 92.5 92.5 92.5
3 90.8 4.5 95.4 90.8 90.8 90.8
4 93.33 3.3 96.66 93.38 90.36 93.8
5 92.5 3.8 96.10 92.5 92.5 92.5
Anthracnose:
Here we use four hundred image of anthracnose of guava for experiment. Seventeen image are misclassified or give the wrong result and other three hundred and eighty-three image are correctly classified or give the correct result.
Example:
©Daffodil International University 24
Correctly classified:
Fig 4.2: Correctly classified 4 anthracnose image
Incorrectly classified:
Fig 4.3: Incorrectly classified 4 anthracnose image
Fomopsis rot: Here we use four hundred image of fomopsis rot of guava for experiment. Ninety image are misclassified or give the wrong result and other four hundred and ten image are correctly classified or give the correct result.
Example:
©Daffodil International University 25
Correctly classified:
Fig 4.4: Correctly classified 4 fomopsis rot of guava image
Incorrectly classified:
Fig 4.5: Incorrectly classified 4 fomopsis rot of guava image
Fruit fly: Here we use four hundred image of fruit fly of guava for experiment. One hundred and 20 image are misclassified or give the wrong result and other three hundred and eighty image are correctly classified or give the correct result.
Example:
©Daffodil International University 26
Correctly classified:
Fig 4.6: Correctly classified 4 fruit fly of guava image
Incorrectly classified:
Fig 4.7: Incorrectly classified 4 fruit fly of guava image
©Daffodil International University 27
Fig 4.8: Iteration vs Accuracy
Fig 4.9: Comparison of specificity, Recall and false positive rate and precision
90.5 92.5 90.8 90.8 92.83
0 10 20 30 40 50 60 70 80 90 100
Iteration no.1 Iteration no.2 Iteration no.3 Iteration no.4 Iteration no.
0 10 20 30 40 50 60 70 80 90 100
Iteration no.1 Iteration no.2 Iteration no.3 Iteration no.4 Iteration no.5 Specificty(%) Recall(%) False positive rate(%) Precision(%) )
©Daffodil International University 28
CHAPTER 5 Summary and Conclusion 5.1 Summary of the study
Classify three guava disease and they are anthracnose , fomopsis , fruit fly of guava. All of the guava disease sample will be passing through tenser flow after trending it declare the matching percentage of anthracnose , fomopsis and fruit fly of guava. Highest percentage of matching value will be the result. By applying the artificial neural network and tenser flow techniques the guava disease are avowed about 91 percent accuracy rate. This will be a great effective to be further become better in the future.
In our paper for diagnosis the guava disease we use inception v-three model. The techniques is taken from image processing to improve and upgrade the image for better quality. The artificial neural network and trending on tenser flow system is used to
5.2Limitation
For our proposed strategy there are not so many impediments. Accuracy percentage is one of them. Our accuracy is around 91 which is almost good enough and also there will be little bit bug to fix. We are trying to cheek almost all the subset of the features. We also checked random features. Firstly our percentage was around 83 percentage then we preprocessing images of guava diseases then we found the accuracy 91 percentage.
5.3 Future Scope of Work
Here we tried our best to find the best accuracy percentage and get the desired output. We think 91 percentage is good enough. We have used inception v-three model and testing the image by through tenser flow analysis. After all complexities aside , our long term motive is to detect the disease of guava for production and also cultivation .
©Daffodil International University 29
REFERENCE
[1] A.K. Misra, Guava Diseases – their Symptoms, causes and Management, Central Institute for Subtropical Horticulture, Lucknow-227 107, India, January 2003.
[2] M.Thilagavathi, S.Abirami, Application of Image Processing in Diagnosing Guava Leaf Diseases, International journal of Research in Engineering and Technology, Vol. 5, No. 7, 2017.
[3] M.Thilagavathi, S.Abirami, Application of Image Processing in Diagnosing Guava Leaf Diseases, International journal of Research in Engineering and Technology, Vol. 5, No. 7, 2017.
[4] Md. Tarek Habib , Anup Majumder , A.Z.M. Jakaria , Morium Akter, Mohammad Shorif Uddin, Farruk Ahmed, Journal of King Saud University - Computer and Information Sciences,2018
[5] Sukhvir Kaur Shreelekha Pandey Shivani Goel, Plants Disease Identification and Classification Through Leaf Images, Archives of Computational Methods in Engineering, Volume 26, Issue 2, pp 507–530,2019.
[6] Jagadeesh Devdas Pujari,Rajesh Yakkundimath, Abdulmunaf Syedhusain Byadg, Grading and Classification of Anthracnose Fungal Disease of Fruits based on Statistical Texture Features, International Journal of Advanced Science and Technology , Vol. 52 ,2013.
[7] Diptesh Majumdar , Dipak Kumar Kole ,Aruna Chakraborty ,Dwijesh Dutta Majumder, detection & diagnosis of plant leaf disease using integrated image processing approach, vol. 6, June 2014.
[8] AmandaRamcharan,Kelsee Baranowski, Peter McCloskey,Babuali Ahmed, James Legg and David P. Hughes, Deep Learning for Image-Based Cassava Disease Detection, Frontires in plant science, Vol 8,2017.
©Daffodil International University 30
APPENDIX
The purpose of this appendix is about research reflection. From Spring 2018 we started our journey to make this application. The main feature of our application is detecting guava disease.
Also using our application people can easily identify guava disease. In the very first days we studied a lot of papers about guava disease and others. We have studied a lot to detect the disease. However, we worked hard and tried our best to learn and research some image processing and machine learning technique so that the application was implemented which achieved the goals in the specification. On the other hand, with few requirements and contains the goal is clear and the system design is flexible.
Firstly, we built a model for our project. Then we implemented our project step by step. After a lot of hard work and spending a lot of time finally we were able to reach our goal. The project Guava Disease Detecting Using Image Processing will be helpful for every normal people and farmers. People will be satisfied very easily. So we believe that our Guava Disease Detecting Using Image Processing application will be very positive and effective for users