Changes in hematological components are important indicators of the animal's physiological or pathological state (Ahmed et al., 2003). There is little difference in biochemical parameters between lactating and non-lactating cows (Jones et al., 1982). In practice, red blood cells, packed cell volume, hemoglobin concentration are useful in the assessment of anemia (Schalm et al., 1975; Davidson et al., 1975).
Anemia is characterized by a reduction in total erythrocyte content, erythrocyte count, or hemoglobin concentration (Bichard et al., 2006). The values of Hb, ESR, MCHC are significantly lower (p‹0.05) in non-cyclic cows compared to cyclic or endometrial cows (Ahmed et al., 2009). In addition, lack of food manifested in hunger or anorexia is a cause of neutropenia (Spivak et al., 1984).
Lymphopenia is caused by stress, glucocorticoid therapy acute phase of viral infection, septicemia or endotoxemia (Candyce et al., 2003). And neutrophilia is caused by physiological changes (fear, tension and exercise) stress/corticosteroid induced (Bichard, 2006) and acute inflammatory response (bacterial infection, necrosis, neoplasia) (Davidson et al., 1998; Spivak et al., 1984) . In Jersey cows, total protein increased with age over a range of one to six years (Roussel et al., 1982).
These results are consistent with the findings of Roussel et al., 1982, for Jersey cows ranging in age from one to six years.
Serum Sample Preservation
Sample examination
Hematological Examination
Biochemical Examination
3.2.4.2.1 Photometric Colorimetric Test for Total Proteins (Biuret Method)
1000 μl reagent was taken into previously labeled three Eppendorf tubes for reagent blank, sample and standard separately by micropipette. Sample and standard for total protein were mixed separately in each eppendorf tube and incubated for 10 minutes at 250C. Absorbance of the sample and standard was measured against the reagent blank within 30 min (ΔA) λmax in 546 nm by spectrophotometer of the Humalyzer 3000®.
3.2.4.2.2 Photometric Colorimetric Test for Albumin (BCG Method)
Sample and total protein standard were mixed separately in each eppendorf tube and incubated for 5 minutes at 25°C. The absorbance of the sample and the standard was measured against the reagent blank within 30 min (ΔA) λmax in 578 nm with spectrophotometer of Humalyzer 3000®.
3.2.4.2.3 Determination of Glucose by Randox method
Then read the absorbance (a) of each tube at 425 to 475 nm against the blank within 30 minutes.
3.2.4.2.4 Determination of Calcium by Colorimetric method
When washing, the mat of calcium phosphate at the bottom of the tube should be thoroughly broken up with a glass stirring rod, and the process of centrifugation, decanting and draining the tube should be carried out as described above.
3.2.4.2.5 Principle and Procedure of estimation of Phosphorus
- Data entry and Analysis
- Base line survey
- Cross sectional study
- Hematology
- Serum Biochemistry
- Value
Finally, read the absorbance (A) of the samples and standard at 340 nm against the reagent blank. The housing pattern was both inward and outward, each shed was designed for the different status of the animal, for example a dairy cow shed, a heifer shed, a dry cow shed, a pregnant cow shed and a calf shed with standard space allocation for individuals. Most of the time heat was detected during morning milking and AI was usually done within 10-14 hours by an AI technician.
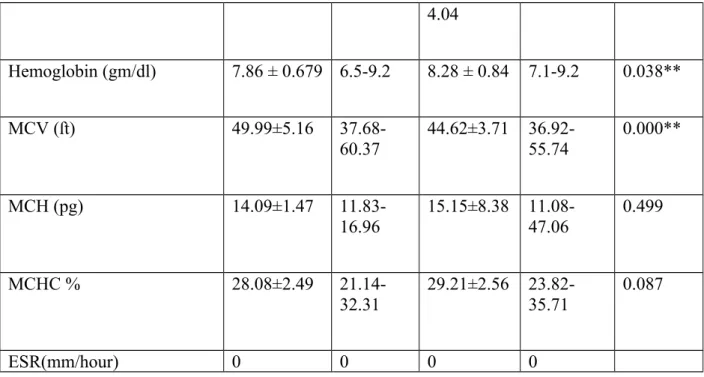
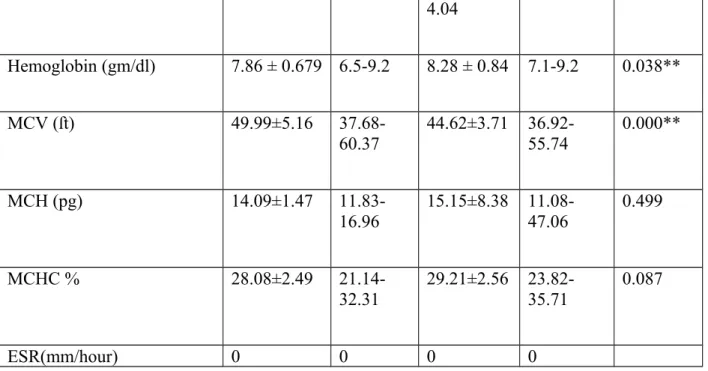
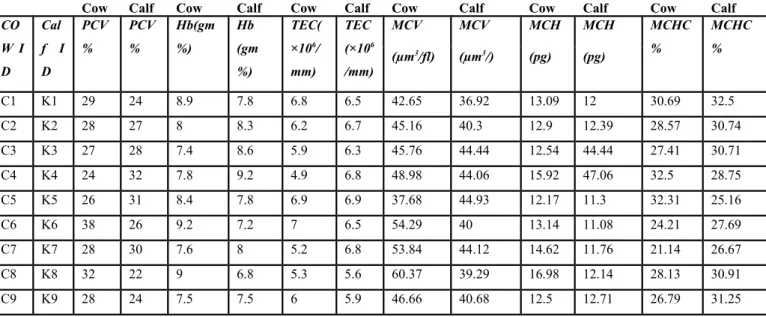
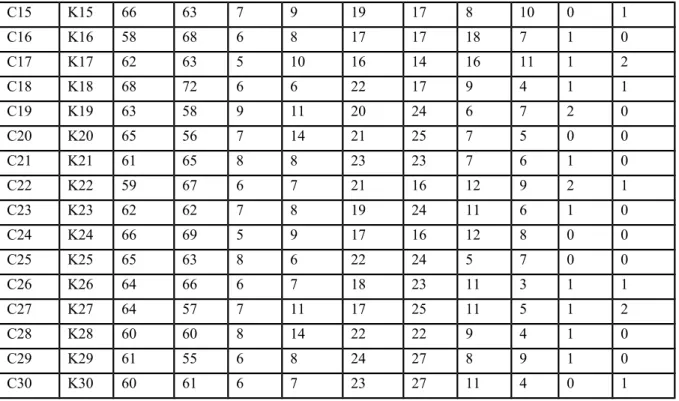
AI was usually performed 2 times per conception for each cow to obtain the best result. Name of vaccine Frequency of use Animal groups administered FMD vaccine three times/year Cows, calves, heifers. Among various hematological parameters Total erythrocyte count (TEC), hemoglobin (Hb) and packed cell volume (PCV) differed significantly between cows and calves.
Hemoglobin was significantly higher in the calf (8.28 gm/dl) than the cow (7.86 gm/dl). Higher Hb level in calf due to increased rate of hemopoiesis (Al-Busadah 2007 and Alsaad 2009). Table 02 describes the proportion of different leukocytes (lymphocytes, monocytes, neutrophils, eosinophils and basophils) in cows and calves at Paharika Commercial Dairy Farm. Table 03 showed the various biochemical parameters of cow and calf serum at Paharika Commercial Dairy Farm.
The total protein, globulin, cholesterol and glucose levels in serum were significantly varied in cow and calf (p<0.000).
Total protein
Albumin and Globulin
Blood Glucose
Cholesterol
Calcium
CHAPTER-5 DISCUSSION
Farm management practices
Hematology
- MCV, MCH, and MCHC
- Differential Count
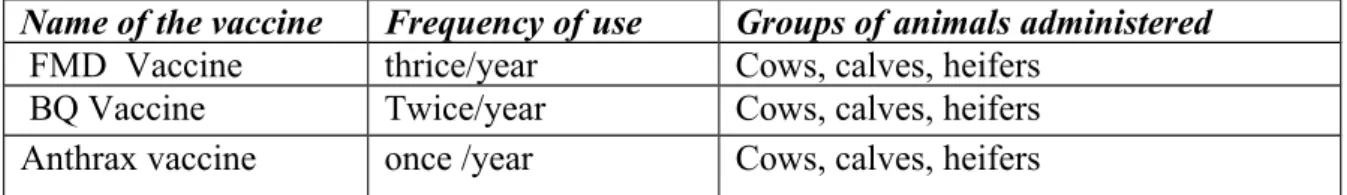
HFxSahiwal crossbred seed is mostly used in accordance with the country's breeding policy (DLS, 1998). The animals are given three different types of vaccines (FMD, BQ and anthrax) and anthelmintic treatment (piperazine citrate, levamisole hydrochloride + triclabendazole). every three months to control parasitic infestation. There are some common diseases recorded in dairy animals such as mastitis, milk fever, spotting, abortion, arthritis, diarrhea in calves, others which are supported by findings (Dunkins, et al 1988). MCHC is a measure of the amount of Hb in each erythrocyte and also refers to the weight of Hb and cell volume; calves with higher Hb concentration showed higher MCH and MCHC values. A higher number of erythrocytes with a lower Hb concentration may be due to an increase in the number of erythrocytes with a decrease in their size (Benjamin, 1978).
Although it was insignificant, it may be due to nutritional deficiency occurring in starvation or anorexia causing neutropenia (Spivak et al., 1984). Possible causes of eosinophilia in cows were parasitic infection (Davidson et al., 1998; Candyce et al., 2003).
Serum biochemistry
- Total protein
- Albumin
- Cholesterol
- Glucose
- Calcium
- Phosphorus
In Shorthorn calves the glucose level was highest at birth and then gradually decreased until one year of age (Doornenbal et al., 1988). These higher percentages in milk-fed beef may be due to their monogastric nature and their regular intake of milk (Doornenbal et al., 1988). In Shorthorn cattle, calcium and inorganic phosphorus were higher in calves fed milk, and calcium and inorganic phosphorus generally decreased with age over one year (Doornenbal et al., 1988).
In young animals there is involvement of skeletal growth, but in older animals there was a reduced need for calcium (Ca) and Pi for this purpose and this was why there were lower calcium levels in blood levels of cows than calves (Doornenbal et al., 1988) . . This indicates that lactating calf has slightly higher phosphorus levels than postpartum cow due to higher phosphorus content in milk as calcium. In Shorthorn cattle, calcium and Inorganic Phosphorus were higher in milk-fed calves and calcium and Inorganic Phosphorus both generally decreased with increasing age above one year of age (Doornenbal et al., 1988).
CHAPTER-6
CONCLUSION AND RECOMENDATION
Finally, hematological and biochemical values were an effective tool for the assessment of physiological status, metabolic disorders, farm management problems, which are strongly related to animal health status. Hematological and biochemical tests should be performed regularly to detect infectious and nutritional diseases. Adequate feeding should be maintained according to their nutritional requirements at different stages of cattle production.
CHAPTER-7 REFERENCES
Studies on the performance, development and carcass composition of growing pigs: influence of sex, feeding regime and age on blood serum parameters. Seasonal differences in hematological values of high and average yielding Holstein cattle in a semi-arid environment. Effect of dietary protein and stage of lactation on hematology and erythrocyte enzyme activity of high-yielding dairy cattle.
Clinical chemistry reference values of normal pets in different age groups as defined in ABA-100. Effect of high environmental temperatures and evaporative cooling on some physiological, hematological and biochemical parameters in high yielding dairy cows. Haematological profiling of crossbred dairy cattle to monitor herd health status at mid-altitude in the central Himalayas.
Haematological and blood biochemical profile in lactating buffaloes in and around Parbhani city Journal of animal science. Measurement of serum leptin concentrations in undergraduate university students by competitive ELISA shows correlations with body mass index and gender. Rawland, G.J, et al. (1975): Relationship between stage of lactation & pregnancy & blood composition in a herd of dairy cows & the influences of seasonal changes in the management of these relationships.
Appendix