ISOLATION AND IDENTIFICATION OF PATHOGENIC BACTERIA PRESENT IN COMMERCIALLY IMPORTANT FISH, SHELLFISH, WATER AND SOIL SAMPLES OF
KAPTAI LAKE
Susmita Chakma
Roll No. 0120/05 Registration No. 878
Session: 2020-2021
A thesis submitted in the partial fulfillment of the requirements for the degree of Master of Science in technology
Department of Fishing and Post-Harvest Technology Faculty of Fisheries
Chattogram Veterinary and Animal Sciences University Chattogram-4225, Bangladesh
December 2022
Authorization
I hereby declare that I am the sole author of the thesis. I also authorize the Chattogram Veterinary and Animal Sciences University (CVASU) to lend this thesis to other institutions or individuals for the purpose of scholarly research. I further authorize the CVASU to reproduce the thesis by photocopying or by other means, in total or in part, at the request of other institutions or individuals for the purpose of scholarly research.
I, the undersigned, and author of this work, declare that the electronic copy of this thesis provided to the CVASU Library, is an accurate copy of the print thesis submitted, within the limits of the technology available.
Susmita Chakma
ISOLATION AND IDENTIFICATION OF PATHOGENIC BACTERIA PRESENT IN
COMMERCIALLY IMPORTANT FISH, SHELLFISH, WATER AND SOIL SAMPLES OF KAPTAI LAKE
Susmita Chakma
Roll No. 0120/05 Registration No. 878
Session: 2020-2021
This is to certify that we have examined the above Master’s thesis and have found that is complete and satisfactory in all respects, and that all revisions required by
the thesis examination committee have been made.
---
Chairman of the Examination Committee Department of Fishing and Post-Harvest Technology Faculty of Fisheries
Chattogram Veterinary and Animal Sciences University Chattogram-4225, Bangladesh
ACKNOWLEDGEMENTS
First and foremost, all praises to Almighty God for giving me the health, ability and strength to accomplish this MS research work as well as the thesis on due time. Without His help, I would not be to finish this thesis work.
--- Dr. Md. Faisal
Supervisor
--- Prof. Dr. M Nurul Absar Khan
Co-Supervisor
I would like to convey my earnest gratitude to my beloved parents and siblings for their ultimate understanding, inspirations, moral support, kindness and blessings, forbearance and endless love to complete this study.
I sincerely express my deepest sense of gratitude, sincere appreciation, profound regards and immense indebtedness to my honorable teacher and research supervisor Dr. Md. Faisal, Assistant Professor & Head, Department of Fishing and Post-Harvest Technology, Chattogram Veterinary and Animal Sciences University for his valuable suggestions, intellectual guidance, constructive and constant inspiration throughout the entire period of the study and in preparations of this manuscript.
I feel proud in expressing my immense gratitude to my respected teachers of Department of Fishing and Post-Harvest Technology, Chattogram Veterinary and Animal Sciences University, for their kind co-operation, intellectual guidance, valuable suggestions and constructive criticism throughout the research period and for the thesis work.
I wish to express my heartfelt gratitude to our honorable respective Dean Prof. Dr. M Nurul Absar Khan for their supportive administrative coordination to fulfill my MS research work.
I would like to express appreciation to the lab technician and lab attendant of Processing and Nutrition Laboratory, Faculty of Fisheries, Chattogram Veterinary and Animal Sciences University for providing laboratory facilities for this study.
At the end, I would like to expresses cordial thanks to my loving friends and well-wishers for their co-operation, cheerfulness and inspiration during the course of this study. Last but not least, to everyone who has supported me directly or indirectly in completing this thesis.
The Author
Table of Contents
Contents Page No
Title page i
Authorization ii
Signature page iii
Acknowledgement iv–v
Table of content vi–viii
List of figures ix–x
List of tables ix
List of abbreviations xii
Abstract 01
Chapter-1: Introduction 02–03
Chapter-2: Review of Literature
2.1 Kaptai Lake 04
2.2 Present status of fish biodiversity in Kaptai Lake 2.3 Fish microbiology
2.4 Microbiological relation with fish nutrition 2.5 Fish market and marketing channels
2.6 Water Microbiology 2.7 Bacteriological Characteristics of Kaptai Lake Water 2.8 Soil microbiology Chapter-3: Materials and Methods
3.1 Sampling Area 14–15
3.2 Collection of water and soil samples 15 3.3 Microbiological analysis
3.3.1. Sterilization of materials 15
3.3.2. Sample preparation 15
3.3.3. Preparation Serial dilution 15 3.3.4. Procedure of Plate Count Agar (APC) 16 3.3.5. Inoculation of sample in agar plates 17 3.3.6. Counting of bacterial load 17 3.4. Identification of Pathogenic Bacteria
3.4.1. Identification of E. coli 18
3.4.2. Identification of V. cholera 19
3.4.3. Identification of V. vulnificus and V. parahaemolyticus 3.4.4. Identification of Salmonella and Shigella identification 20
Chapter-4: Results
4.1. Bacterial quantification, isolation and identification from fish samples
4.2. Bacterial quantification, isolation and identification from water and soil samples
21–24 25–32
Chapter-5: Discussion 33–35
Chapter-6: Conclusions 36
Chapter-7: Recommendations and Future Prospects 37
References 38–45
Appendices 46–48
List of Figures
Serial No.
Figur e No
Description of the Figures Page No
01 01 Sampling sites at Kaptai Lake 13
02 02 Collection of soil and water sample and sample
preparation 14
03 03 Procedure of Plate Count Agar (PCA) 16
04 04 Inoculation of Sample in agar plate 17
05 05 Procedure of of E. coli Identification 18
06 06 E. coli in EMB Agar 18
07 07 Procedure of Vibrio cholera Identification 19
08 08 Procedure of V. vulnificus and Vibrio parahaemolyticus Identification
20
09 09 Identification of Salmonella and Shigella 21
10 10 Colony of bacteria found in fish sample 22
11 11 Colony of bacteria found in water samples 26
12 12 Colony of bacteria found in soil samples 29
List of Tables
Serial No.
Table No
Description of the Tables Page No 01 01 The Species of fishes caught in different months in
Kaptai Lake
5-6 02 02 Pathogenic bacteria present in fish samples where
“R” represent the replication of fish sample
23-25 03 03 Pathogenic bacteria present in water samples
where “R” represent the replication of fish sample
27-29 04 04 Pathogenic bacteria present in fish samples where
“R” represent the replication of soil sample
30-32
List of Abbreviations
Words Abbreviation
KL sp.
Kaptai Lake Species
Mm Milimeter
µm Micrometer
Ml Mililiter
µg Microgram
Vol Volume
L Liter
Mg Miligram
Gm Gram
CFU Colony Forming Unit
ºC Degree Celcius
BPW Buffer Peptone Water
TSA Trypticase Soy Agar
Mac Macconkey Agar
XLD Xylose Lysine Deoxycholate
TCBS Thiosulfate-citrate-bile-salts-sucrose agar
EMB Eosin Methylene Blue Agar
TSI Triple Sugar Iron
GP Gram Positive
+ Positive
- Negative
Hr Hour
% Percentage
G Gram
Lbs Pound
Min Minute
Cm E.
R
Centimeter Escherichia Replication
Abstract
Organisms that cause human infections are transmitted from fish or the aquatic environment is quite common. To analyze the bacterial population (pathogenic) of fish, soil and water from Kaptai Lake, this study aims to isolate enteric pathogenic bacteria from fish, soil and water that might be transmitted to humans after handling and consumption of these. To determine the presence of E. coli, Salmonella, Shigella, V.
cholera, V. parahaemolyticus, V. vulnificus from fish, soil and water and to isolate those bacteria, different kinds’ agar like EMB agar, Xylose Lysine Deoxycholate (XLD) Agar and TSI agar were used in this study. To determine the bacterial load Total Plate Count method was used. Result showed that, among 20 fish species the highest and lowest amount of bacterial load was found in Puntius ticto (8.53±0.21×10⁶ CFU mL-1) and Microbrachium rosenbergii (2.45±0.25 ×10⁴ CFU mL-1). Moreover, in case of soil (6.13±0.66×10⁶ CFU mL-1) and water (3.90±0.20×10⁶ CFUmL-1) highest bacterial load was found in station-12. Due to the presence of E coli in most of the water and soil of most of the sampling sites, it can be concluded that, these sites may be contaminated by human manure. Besides this, as sampling sites at Baghaichhari area was highly contaminated with pathogenic enteric bacteria which suggest reducing human interference in this area.
Keywords: Pathogenic Bacteria, Isolation, Identification, Colony Count
Chapter-1: Introduction
One of the biggest man-made freshwater bodies in Southeast Asia, Kaptai Lake (KL), is situated in Bangladesh's Rangamati district. The people who live on the lake's islands use the lake water directly to drink and other domestic needs before even purifying it. It has a surface area of 68800 ha on average (DOF, 2019; Uddin et al., 2014). It is enhanced by a wide variety of fish species. A variety of 71 species of fish, including 5 foreign fish species and 2 prawn species, were estimated to yield 10152 MT annually (DOF, 2019 and 2018). As the fishing industry mimics one of Bangladesh's most innovative and forward- thinking industries. Fish makes nearly 60% of all animal protein consumed in Bangladesh, making it a crucial source for animal protein for the country's citizens (DoF, 2018). This industry is making a significant contribution to food security by offering safe and high-quality animal protein. The GDP contribution from the fishing industry is 3.61% and the agricultural GDP is 24.41%. (DoF, 2018). According to thorough ARG's (Aquatic Research Group) and Bangladesh Fisheries Development Corporation field studies, the landings of large carps actually fell in 1985 and represented the lowest level in the fishery's history at Kaptai Lake. It took place as a result of excessive carp harvesting. After the proportion of carps gradually decreased, the output of pelagic clupeids significantly rose. Two species—Chapila (Gudusia chapra) and Keski (Corica soborna), which currently account for more than 50% of the total catch—have taken the lead in this growth. A fish fauna inventory identified eight species as being of significant commercial importance: Gibelion catla, Cirrhinus mrigala, Lebeo rohita, L. calbasu, L.
goinus, Notopterus chitala, Wallago attu, and G. chapra.
Depending on the season, a person's interaction with fish and related surroundings, their dietary choices, and their immune system health, human diseases brought on by pathogens transferred via fish and other aquatic environments are relatively frequent.
They are frequently facultatively pathogenic bacteria that might be acquired from fish without showing any outward signs of illness. Fish kept for consumption or as a hobby could be the source of the infection (Acha and Szyfres, 2003). Numerous bacteria have been linked to human diseases and toxins; among them, Listeria monocytogenes, Vibrio cholera, Vibrio parahaemolyticus, Salmonella spp., Escherichia coli, and Clostridium
botulinum are the principal culprits (Weir et al., 2012). Additionally, the people residing in the lake's islands uses the lake water for drinking and other domestic needs without first undergoing any kind of purification treatment (Barua et al., 2016; Chakma, 2008).
Water tainted with pathogenic bacteria has the ability to spread a number of contagious diseases to people (Sadeghi et al., 2007). The most prevalent gastrointestinal illnesses spread through water contaminated with patient feces are cholera, salmonellosis, and shigellosis (Cabral, 2010).
One of Bangladesh's main animal protein sources is the fish of Kaptai Lake. The most crucial factors in ensuring good health are contamination- and pathogenic-bacteria-free seafood. The bacterial population found in fish, water, and sediments will be categorized in this study. Additionally, draw attention towards the pathogenic bacterial colony that can harm everyone's health if they consume fish. People who live along the shore of Kaptai Lake and utilize the dirty lake water for household purposes may frequently be seriously ill. The harmful bacteria in sediments can potentially contaminate fish that live at the bottom of the food chain. Thousands of people get sick every year by eating pathogenic fish and drinking dirty water, yet these illnesses are not properly recorded because of a lack of proper diagnosis. In addition, contaminated fish frequently infects not just customers but also anyone involved in the catch, handling, shipping, and processing of fish. Consequently, this study was created to fulfill the following goals:
i. To determine the total microbial load in fish, shellfish, water and soil samples of Kaptai Lake.
ii. To identify the pathogenic bacteria in fish, shellfish, water and soil samples
Chapter-2: Review of literature
It is crucial to look at the existing research activity on connected themes before starting new research under a specific experimental approach. Below is a survey of literature that is pertinent to the current research-
2.1. Kaptai Lake
The East Pakistani government started building the hydroelectric plant's reservoir in 1956. As a result, the lake was formed by the submergence of 54,000 acres (220 km2) of cropland in the Rangamati District. The United States provided funding for the hydroelectric project. In 1962, the project was completed. The contract for building the dam was given to Utah International Inc. and International Engineering Company. The dam measures 54.7 meters high and 670.8 meters long. The dam has 16 gates along its 745-foot (227-meter) long spillway. Water may flow through the spillway at a rate of 5,250,000 cu ft/s (149,000 m3/s). 40% of the region's total arable land was submerged as just a result of the construction of the dam. Additionally, 234 square miles (610 km2) of additional forested area and 29 square miles (75 km2) of government-owned forest property went under water. Also displaced were roughly 18,000 hagu households, totaling over 100,000 people. The Chakmas king's palace was likewise flooded and is currently submerged (Sadeghi et al., 2007).
A sum of 54,000 acres, or 40% of the indigenous people's arable land, have been taken by this lake. The population boom and shrinking amount of arable land have put considerable strain on the forest. Native Americans traditionally engage with in "slash and burn" method of farming, or jhum. A hill should have a recovery period of 15-20 years after slash and burn farming to restore the flora that was burned. In the past, the land to human ratio was optimal, and the projected jhum cycle interval was upheld.
However, due to overpopulation, this period has now only been 2-3 yrs, which is incredibly short to allow for the growth of flora and the restoration of the woods. The viperous cycle of jhum farming is one of the main causes of the destruction of native forests, which are necessary for the springs to form. Additionally, the disappearance of native forests is to blame for rising temperatures and, as a result, falling precipitation (Cabral, 2010).
2.2. Present status of fish biodiversity in Kaptai Lake
Inland fisheries account for 80.59 percent of Bangladesh's overall fish production. One of the significant inland water bodies, Kaptai Lake has 68,800 species and 9,000 MT of fish productivity. Although there is currently a 120 kg production per acre, the overall fish yield of commercially significant fishes is decreasing. Major carps from India made up 4% of all fish produced in 2007 compared to 81% in the early 1960s. 78 fish species, 2 shrimp species, 1 dolphin species, and 2 turtle species have all been identified as existing in the lake thus far (Table 2.1). Six species had vanished by 2007 (Claucas and Ward, 1996). The majority of the fishing equipment utilized throughout the Kaptai reservoir is conventional. Fishing enthusiasts at Kaptai Lake have grown accustomed to using the brush shelter, a fish aggregation technique, since the early 1990s. Locally, this is referred to as juk fishing. As per Ahmed and Hambrey's (1999) study, the average harvest per brush was 242 kg, with major carps making up 17% of the catch, followed by catfish (24%), clupeid (13%), featherback (9%), and tilapia (6%).
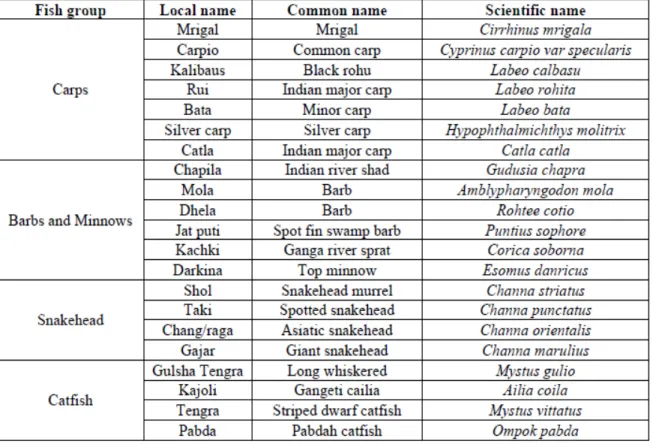
Table 01. The Species of fishes caught in different months in Kaptai Lake
2.3. Fish microbiology
Fish is an essential component of human nutrition and provides around 60% of the protein consumed worldwide. Fish provides 30% of the annual protein needs for almost 60% of the developing world (Abisoye et al., 2011). It is the primary source of excellent protein for humans, accounting for roughly 16% of a animal proteins consumed globally (FAO, 1997). Fish is one of the most lowest sources of proteins in Africa and provides 17% of the protein consumed there (Claucas and Ward, 1996). Because of its great nutritional value and simple digestion, fish is advantageous as food. As in small-holder farming sector, fish should be seen as a ready source of money as well as nourishment (Smith and Yoshida, 2000). The reclaimed fields can be brought back to life and made fruitful through the production of fish in large dams or ponds. Additionally, small-scale fish farming enhances communal residents' quality of life and decreases the amount of people who are perpetually reliant upon the government for financial support. However, a variety of bacterial pathogens can infect fish, and the majority of these pathogens are thought by others to be opportunistic pathogens in origins (Lipp and Ross, 1997). Fresh fish muscle's microbial richness is influenced by the surrounding environment and fishing areas (Cahill, 1990). It has been proposed that a fish's habitat determines the type of microorganisms that are present in association with it (Claucas and Ward, 1996).
Indigenous and non-indigenous bacterial diseases linked to fish have been distinguished
(Kvenberg, 1991). The non-native species, that included Escherichia coli, Clostridium botulinum, Shigella dysenteriae, Staphylococcus aureus, Listeria monocytogens, and Salmonella contaminate the fish or the habitat in one way or another. The fish's habitat contains naturally occurring native bacterial diseases such Vibrio species and Aeromonas species (Rodricks, 1991). Only when fish are physiologically out of balance, nutritionally malnourished, or under other stressors like poor water quality and overcrowding that promote opportunistic bacterial infections do fish microorganisms turn into pathogens (Austin, 2011).
Salmonella spp., Mycobacteium spp., Streptococcus spp., Vibrio spp., Aeromonas spp., and other pathogenic and potentially harmful bacteria are linked to fish and shellfish (Lipp and Ross, 1997). Fish farming and livestock production are combined in integrated fish farming. A fish pond receives direct animal excrement discharge as fertilizer, which fosters the development of photosynthesis-dependent species. Supplemental feeding has a direct impact on fish growth, whereas fertilization stimulates growth by supplying planktonic natural food. In pond aquaculture, plankton serves as a fish meal as well as a gross provider of dissolved oxygen, which is necessary for fish growth, and the most significant sink of ammonia-nitrogen, which fish excrete (Green and Teichert- Coddington, 1993). The fishing industry using various types of livestock manure could result in a rise in dangerous microorganisms, endangering the health of the country town (Musaiger and D Souza, 2008). It has been noted that eating fish can be a significant way for people to become exposed to human pathogenic microbes and other food borne illnesses (Christopher et al., 2009). Fish-borne pathogens can transferred to people via both active and inactive contact and can result in food-borne illnesses such cholera, salmonellosis, typhoid, fever, and dysentery. In light of the potential health dangers, livestock-fish farming must be viewed in perspective (FAO, 2003). Possible disease transmission between animals and people is one of the concerns associated with livestock integrated fish aquaculture. Different types of livestock manure are contaminated with dangerous bacteria, including Salmonella, Shigella, Pseudomonas, Vibrio, Streptococcus, and E. coli species, according to prior study (Abdelhamid et al., 2006).
These diseases can spread to people through contaminated fish handling or badly cooked food. The immune-compromised, young children, and the elderly are particularly
vulnerable to food-borne illnesses including dysentery and diarrhea caused by the ingestion of contaminated seafood, which have been linked to significant economic losses. Fish's quality and safety for human consumption are compromised by microbial contamination; this is especially important when the microorganisms are opportunist or virulent in type (Mhango et al., 2010). The inhabitants of the nearby communities may run the danger of contracting food-borne illnesses if they ingest the fish as from earth dams.
2.4. Microbiological relation with fish nutrition
Fish must be free of chemicals, germs, and other possibly harmful substances as well as potentially hazardous substances. Microbes can contaminate fish through the soil, the air, the dust, medical devices (used in production or dispensing), people, or animal fluids (World Health Day, 2015). Because of the pathogens that can grow and become abundant inside of the storage untill they release a toxin, fishes may be poisonous (Eze et al., 2011). According to a National Standard created mostly by Indonesian National Agency of Drug and Food Control in 2007 with the code SNI 01-2332.52006, all fish products, as well as imported and exported seafood, must be free of pathogenic microorganisms.
Kvenberg (1991) and Rodeick separate fish pathogenic microorganisms among non- native and indigenous pathogens (1991). There are pathogens nearby or in the fish habitat that are not local to the area. These pathogens include Escherichia coli, Listeria monocytogenes, Clostridium botulinum, Salmonella species and Listeria species (Bensley et al, 2011; Eze et al., 2011; and Dwiyitno 2010). Fish typically include hazardous natural bacteria like Vibrio and Aeromonas species. Clucas and Ward (1996) found that some microorganisms, including S. aureus, Salmonella, and Vibrio parahaemolyticus, are more likely to infect specific seafood.
2.5. Fish market and marketing channels
The current state of fish market place in Rangamati has been the subject of several prior investigations (Kabir et al., 2020; add others). Fish spoils quickly if it is not dispose of in a timely manner due to its high perishability. This not only lowers prices but also creates health risks. Because of this, it needs to be handled carefully and packaged carefully before being sold to consumers. Rodeick (1991). Despite the fact that fish is regarded as
an industry in many nations throughout the world, fishers in our nation do not interact directly with consumers. Fish market chains are thus in action, running from either the suppliers to the final consumers. The local fish merchant, beparies, aratdar, entire sellers, and retailers are only a few of the middlemen in this system. The total number of fish landings in the landing facility were discovered to vary sometimes. The number of fish landed in the winter were greater compared to other seasons. More fish were landed in the months of January, February, and March than in the months of April, May, and June.
Rahman (2003) noted that a multitude of middlemen, including regional fish traders, agents, entire sellers, and retailers, were involved in the market chain in Gazipur from farmers to consumers. In the Mymensingh district, Quddus (1991) also discovered a comparable market chain. The observations mentioned above support our findings.
Rahman et al. identified three different kinds of supply chain operations for the sale of fish through supermarkets (2017).
2.6. Water Microbiology
Freshwater resources are a vital part of the biosphere and a necessity for ensuring the survival of living things, although only making up 3% of the world's total water supply (Wilson and Carpenter, 1999). (Jackson et al., 2001). The exponential increase in human population, widespread urbanization, fast industrialization, and intensive agricultural methods make it impossible for freshwater supplies to replenish themselves (Fischer and Heilig, 1997; Douglas et al., 2002; Dale et al., 2005; Grimm et al., 2008). The physical, chemical, and biological features of water, or its "quality," indicate whether or not the water is contaminated in regards of consuming, the suitability of human touch, as well as the stability of ecosystem (Schleiger, 2000). Around 80% of public health issues have been brought on by polluted water (Marshall et al., 2006; Jones et al., 2007; O'Reilly et al., 2007; Peace and Mazumder, 2007; Jayana et al., 2009). Water-borne illnesses are to blame for developing and recurring infectious diseases globally. The possible carrier for transmitting a number of infectious illnesses to humans is water contaminated with harmful microorganisms (Sadeghi et al., 2007).
The three gastrointestinal illnesses that are most frequently contracted by drinking water contaminated with patient feces are cholera, salmonellosis, and shigellosis (Cabral, 2010). Water used for drinking should be devoid of turbidity, color, odor, and any
organic or inorganic contaminants that might have a negative physiological impact (Bhatt et al., 1999). The population of Bangladesh depends on tubewells, ponds, lakes, etc. for access to safe drinking water, particularly in remote areas. Until a significant geogenic arsenic pollution is revealed, tube-wells that use subsurface water are marketed as more than just a better source of drinking water. However, the greatest barrier to using surface water for drinkable purposes is the potential for exposure to harmful germs (Rahman et al., 2003; 2011a; 2011b; 2013). The biggest man-made lake in Southeast Asia is Kaptai Lake (KL), which is situated in the Rangamati neighborhood and 68.5 kilometers from Chittagong Metropolitan City. The lake was made when a dam was built on the Karnaphuli River, which flows in the southeast of Bangladesh, to provide hydroelectric power (Fernando, 1980; Karmakar et al., 2011). A sizable hilly region was drowned as a result of the dam building and reservoir development, causing profound changes in the environment (Newman, 1974). The native people was also compelled to relocate to areas that were more mountainous or to the little islands that created inside the lake. All those who reside nearby the lake become reliant on the water for drinking, domestic use, and other uses, and they all consume it directly without any intermediary filtration (Ahmed et al., 2001; Chakma, 2008).
2.7. Bacteriological Characteristics of Kaptai Lake
Water is necessary for life, yet many people lack access to clean, safe drinking water, and many of them pass away from bacterial diseases contracted from water. In a prior study (Barua et al., 2016), samples of lake water were examined with HPC and MPN indexing to evaluate the microbial traits that are a key indication of water quality. The previous studies of the viable cells in drinkable water is 500 CFU mL-1, but the HPC count in all of the samples was within 250 CFU mL-1 (US EPA, 2003). The HPC represents both the overall number of bacteria and the microbial activity in freshwater (Aksu and Vural, 2004). In a research on Ghana's Ahor Lake, which is utilized for recreation, a decreased level of HPC in lake was also noted (Amfo-Out et al., 2011). Water pH, temperature, remaining chlorine, and incorporable organic matter levels are known to have an impact on the HPC count of drinking water, which can range from 1 to >104 CFU mL-1 (LeChevallier et al., 1980). A high HPC density in drinking water, however, does not always signify a serious health danger (Allen et al., 2004).
A water body's TCC is employed as a possible indication of bacterial, virus, or parasite infestation. Since all of the KL samples collected were positive for coliform, they may be unsafe for human consumption. Some of the nearby residents just use KL as a place to dump animal and human waste, contaminating the water. Naturally, each gram of fresh human and animal feces contains 102–104 times more hermos-tolerant coliform species (Gleeson and Gray, 1997). Children under the age of five, seniors, and other persons with weak immune systems may become ill from drinking water that has been polluted with these feces.
Several bacterial pathogens, including Enterococcus spp., Salmonella spp., Pseudomonas spp., and Vibrio spp., were found utilizing microscopic, cultural, and biochemical testing to validate the possible contamination by human diseases. All KL specimens were discovered to be tainted with the aforementioned diseases. These bacteria are the primary etiological agents of several waterborne outbreaks as well as the cause of gastrointestinal disorders with symptoms such as diarrhea, vomiting, nausea, fever, and abdominal discomfort (Craun et al., 2006). Probable sources of contamination for the identified pathogens include human waste, animal excrement, fishing operations, persons bathing with skin sores, etc. It has been established that these bacteria are also to blame for the lake water pollution caused by rainstorms and stream flow incidents (Jamieson et al., 2005). The nature and frequency of diseases among residents in the vicinity of KL, however, were not documented. The information showed that the water in KL is tainted with dangerous microorganisms, making it unfit for drinking and domestic usage.
2.8. Soil microbiology
According to Wang et al. (2012), sediments are unique basin ecosystem components with a far larger variety of organisms and microbes than river systems (Zinger et al., 2011).
Sediment, which makes up the majority of aquatic systems, is essential as a source, pool, and distributor of nutrients (Huang et al., 2015). There are several sorts of sediment in a typical river network region, including reservoirs, wetlands, and estuaries. Understanding the microbial communities in various basin regions is essential since sediment microorganisms from these places have an impact on overall freshwater environments (Shimeta & Cook, 2011; Shtarkman et al., 2013).
The primary elements of a simple river network are lakes, lake marshes, and estuaries, and deposits in these areas serve as the channels for matter change and movement. A lakeside wetlands is a landform in the lake region that serves as the lake outflow's filtering system. In lake wetlands, bacterial communities are common and play important roles in ecological processes, such as the cycling of biologically active substances (Newton et al., 2011; Van der Gucht et al., 2007; Woese et al., 1990). According to Ding et al. (2015) and Iasur-Kruh et al. (2010), wetland ecosystems near lake basins are the most ecologically diverse. They also provide habitat for biota (Wu et al., 2015). Estuaries are significant elements of lake basins and serve as buffer zones between rivers and lakes or seas. Runoff particles and suspended sediments are carried, stored, and altered in estuaries (Arzayus & Canuel, 2005; Sun et al., 2011). Microbial communities in sediments contribute significantly in narcotic exports, rejuvenation, and biochemical cycling in estuaries, where sediment typically stores inorganic and organic resources before releasing them back into the water column (Pinckney et al., 2001; Yokokawa &
Nagata, 2010).
In reality, a significant majority of such nanoparticles portion of humus is made up of live and dead microbial cells, or their decomposing byproducts, making the microbiota of a soil an integral component of soil organic matter. No examination of the function of soil organisms in plant life would be complete without taking into consideration the type of the bacteria and subsequent biochemical transformations since the amount and qualities of organic matter in any particular soil rely on these factors (Craun et al., 2006). Other than viruses, four types of organisms make up the soil's microflora population. These include fungus, algae, bacteria, and actinomycetes. Each of these categories has several genera and numerous species. Besides of viruses that reside in the tissues of other creatures, bacteria are the most prevalent type of microorganism in soil and the smallest living thing. Actinomycetes are second only to genuine bacteria in terms of abundance in soils, where they can be found in concentrations as high as 200 million per gram. A very diverse range of organisms make up the microbial population of soils. Several hundred to several million algae per gram can be found in almost all cultivated soils. Numbers are meaningless for fungi and actinomycetes because the morphology and growth rate of algae vary so widely (Zinger et al., 2011).
Chapter-3: Materials and Methods
3.1. Sampling Area of Fish
The study was carried out at Kaptai Lake, Rangamati. The Kaptai Lake is situated in the Southeastern part of Bangladesh, occupying an average surface area of 58300 hactor with a water reserve of 525×106 m3 (Uddin et al., 2014). It is under a humid tropical environment. Rainfall is bi-modally distributed with peaks around July and September of each year. Total twenty (20) species of fish and shrimp samples were collected in this study from the Fishery Ghat (Landing Centre). Maximum five (5) species with replications were collected in zip-locked bag for analysis in each sampling lot.
3.2. Sample collection
3.3.1. Collection of fish samples
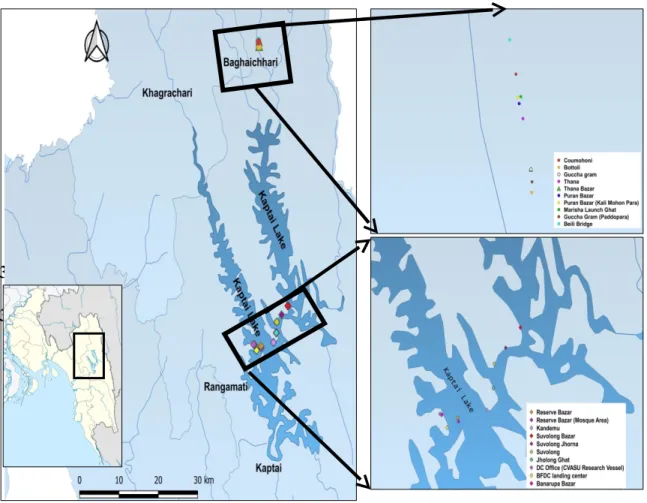
Figure 01: Sampling sites at Kaptai Lake
Samples were purchased from different sellers at Fishery Ghat during the early morning hours of the day (between 7:00 and 8:00 hour local time). Samples were placed in the ice
boxes to preserve the bacteriological properties and then transported to the Nutrition and Processing laboratory, CVASU for further analysis.
3.2. Collection of water and soil samples
The water and soil samples were collected in March 2021 at the end of winter season.
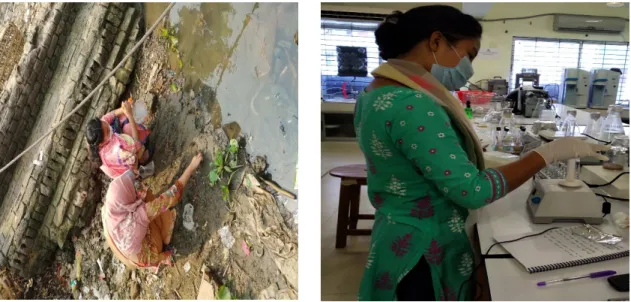
Soil samples were collected from five different spots [Fishery Ghat, Reserve Bazar, Samata Ghat-1, Samata Ghat-2 and DC office Ghat] with replications and the spots were selected based on the inhabitants of the lake (Figure 01). Soil samples were also collected from different sampling stations and packed in zip lock poly bags. From the same sampling stations, water samples were also collected for microbiological analysis in sterile falcon tubes (50ml), placed in sampling buckets. Then all the collected water and soil samples were transported to the Disease and Microbiology laboratory of Faculty of Fisheries, Chattogram Veterinary and Animal Sciences University, Chattogram. Analysis were performed immediately reaching the laboratory.
Figure 02: Collection of soil and water sample and sample preparation
3.3. Microbiological analysis 3.3.1. Sterilization of materials
All the glass-wares used were washed, dried and sterilized in hot air oven at a temperature of 150 °C for 1 h according to the method described by Adibe and Eze (2004) one day earlier before collection of samples. Culture media’s were freshly prepared and sterilized in an autoclave at a temperature of 121°C for 15 min. The wire loop was also sterilized using spirit lamp.
3.3.2. Sample preparation
Sample preparation was made using the method described by Obi and Krakowiaka (1983). About 10 g of the fish sample was cut from the head, middle and tail regions with a sterile knife. The cut samples were crushed into small pieces in a sterile mortar. Then the crushed 10 g sample were transferred in a sterile beaker containing 90 ml of peptone water giving a 1:10 dilution. This was done for the 5 fish samples. Similar procedure was followed to prepare soil and water samples.
3.3.3. Preparation of serial dilution
Nine milliliters of sterile peptone water was poured aseptically into six tubes each and 1 ml from the first dilution of the original crushed fish sample was added to the first test tube and mixed thoroughly. Another 1 ml was taken from the first tube and added to the second test tube and mixed very well. From the second test tube, another 1 ml was taken and introduced into the third test tube and mixed very well. This procedure continued until the sixth test tube. The crushed sample was therefore diluted from 10-1 to 10-6 for each fish sample. Serial dilution was done for each fish, soil and water sample.
3.3.4. Preparation of Plate Count Agar (APC)
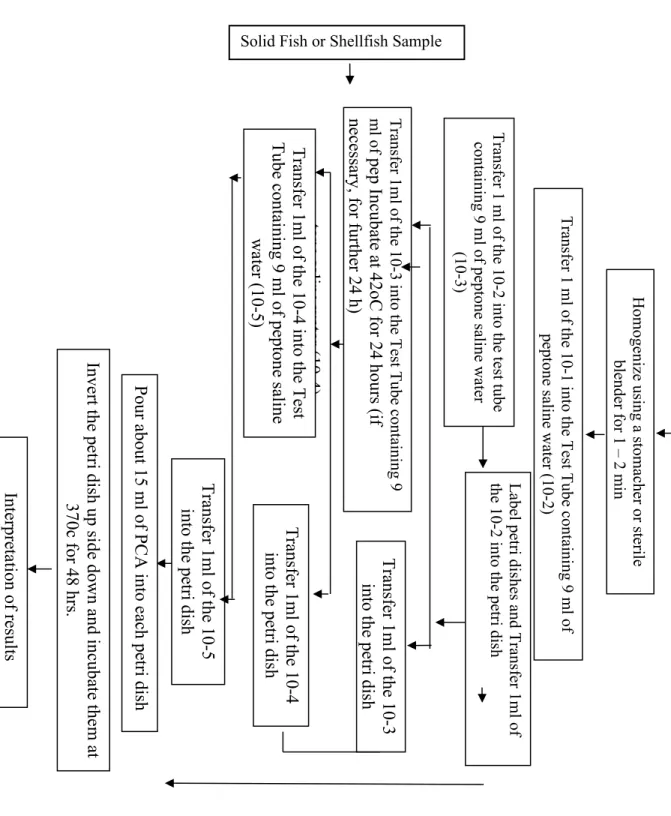
Figure 03: Procedure of Plate Count Agar (PCA)
Pour about 15 ml of PCA into each petri dish
Invert the petri dish up side down and incubate them at 370c for 48 hrs.
Interpretation of results Label petri dishes and Transfer 1ml of the 10-2 into the petri dish Weigh 25g of the sample in a sterile bag and add 225 ml sterile physiological saline water
Homogenize using a stomacher or sterile blender for 1 – 2 min
Transfer 1 ml of the 10-1 into the Test Tube containing 9 ml of peptone saline water (10-2)
Transfer 1 ml of the 10-2 into the test tubecontaining 9 ml of peptone saline water (10-3)
Transfer 1ml of the 10-4 into the petri dish
Transfer 1ml of the 10-5 into the petri dish Transfer 1ml of the 10-3 into the Test Tube containing 9ml of pep Incubate at 42oC for 24 hours (if necessary, for further 24 h) tone saline water (10-4) Transfer 1ml of the 10-3 into the petri dish Transfer 1ml of the 10-4 into the Test Tube containing 9 ml of peptone saline water (10-5)
Solid Fish or Shellfish Sample
3.3.5. Inoculation of sample in agar plate
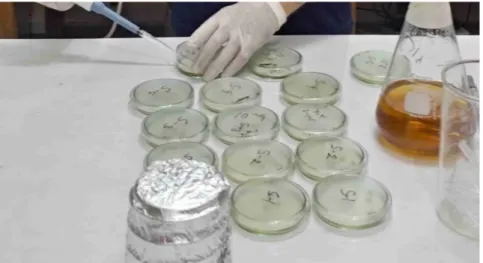
Duplicate plates of nutrient agar were inoculated with 0.1 ml of the diluted solution (10-2 to 10-6) using glass spreader technique. All plates were incubated at a temperature of 37°C for 24 h before colony enumeration and isolation. The temperature was chosen to differentiate the mesophiles which constitute most medically important pathogenic bacteria (Baker and Silverton, 1985).
Figure 04: Inoculation of Sample in agar plate 3.3.6. Counting of bacterial load
The method described by Collins et al. (1989) for estimating bacteria counts was used to enumerate the total viable counts of the isolates. Countable plates showing 1 to 32 colonies were selected and counted. The mean colony count on the nutrient agar plates of each given dilution was used to estimate the total viable count for the samples in colony forming units per gram (CFU mL-1).
3.4. Identification of Pathogenic Bacteria
This study confirmed several pathogenic bacteria such as Escherichia coli, Vibrio cholera, Salmonella, Shigella which create food borne illness in human body.
3.4.1. Identification of E. coli
Weigh 25g of the sample in a sterile stomacher bag and add 225 ml sterile peptone saline water
or peptone water [10-1]
Homogenize using a stomacher or sterile blender for 1 – 2 min
Streak on McConkey Agar plate Incubate at 37oC for 24 h
Streak on characteristic colonies on EMB Agar plate
Transfer characteristic colonies on TSI agar slant E. coli Colony
Characteristics:
McConkey Agar:
Pink coloured colony EMB agar: Greenish Characteristic colony with metallic shine TSI slant: Yellow but with Yellow slant, Gas positive but no H2S Production
Incubate at 37oC for 24 h
Incubate 37oC for 24 h to 48 h
Observe the characteristics colour of Butt, slant and observe gas production
Interpretation of results Figure 05: Procedure of of E. coli Identification
Figure 06: E. coli in EMB Agar 3.4.2. Identification of Vibrio cholera
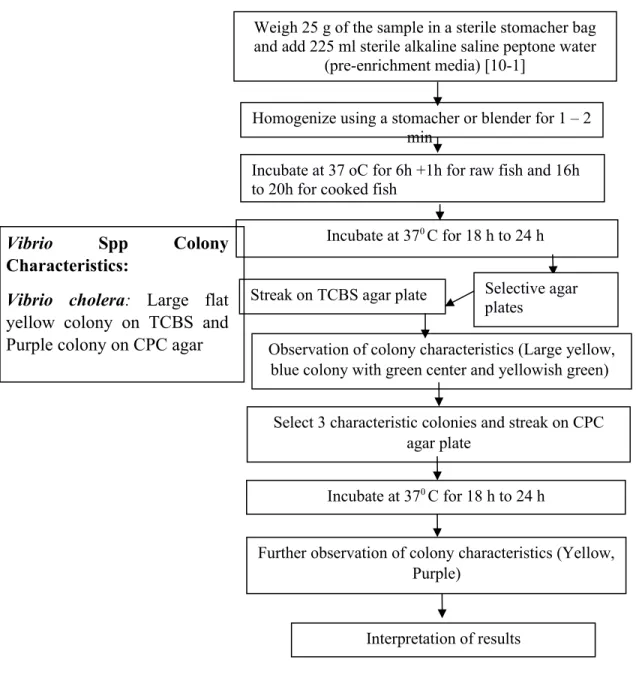
Figure 07: Procedure of Vibrio cholera Identification
Incubate at 37 oC for 6h +1h for raw fish and 16h to 20h for cooked fish
Weigh 25 g of the sample in a sterile stomacher bag and add 225 ml sterile alkaline saline peptone water
(pre-enrichment media) [10-1]
Homogenize using a stomacher or blender for 1 – 2 min
Streak on TCBS agar plate Selective agar plates
Incubate at 370 C for 18 h to 24 h
Vibrio Spp Colony
Characteristics:
Vibrio cholera: Large flat yellow colony on TCBS and
Purple colony on CPC agar Observation of colony characteristics (Large yellow, blue colony with green center and yellowish green)
Select 3 characteristic colonies and streak on CPC agar plate
Incubate at 370 C for 18 h to 24 h
Further observation of colony characteristics (Yellow, Purple)
Interpretation of results
3.4.3. Identification of V. vulnificus and V. parahaemolyticus
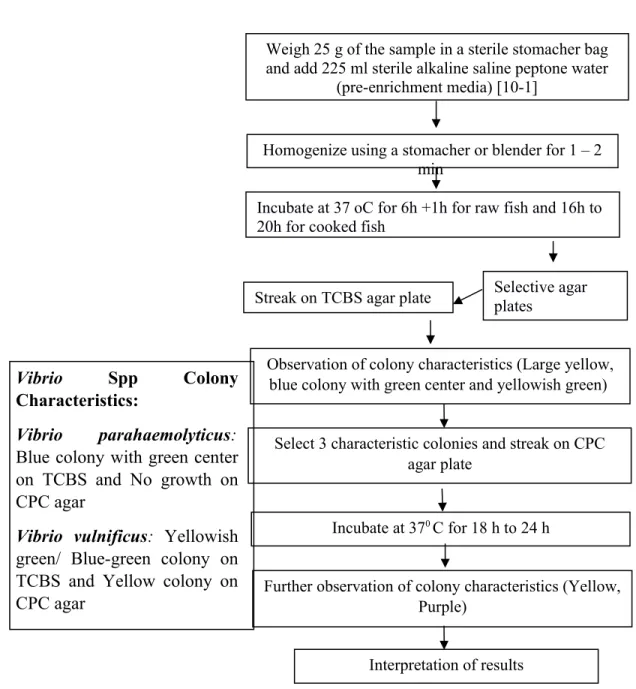
Figure 08: Procedure of V. vulnificus and Vibrio parahaemolyticus Identification Incubate at 37 oC for 6h +1h for raw fish and 16h to 20h for cooked fish
Weigh 25 g of the sample in a sterile stomacher bag and add 225 ml sterile alkaline saline peptone water
(pre-enrichment media) [10-1]
Homogenize using a stomacher or blender for 1 – 2 min
Streak on TCBS agar plate Selective agar plates
Observation of colony characteristics (Large yellow, blue colony with green center and yellowish green)
Vibrio Spp Colony
Characteristics:
Vibrio parahaemolyticus:
Blue colony with green center on TCBS and No growth on CPC agar
Vibrio vulnificus: Yellowish green/ Blue-green colony on TCBS and Yellow colony on CPC agar
Select 3 characteristic colonies and streak on CPC agar plate
Incubate at 370 C for 18 h to 24 h
Further observation of colony characteristics (Yellow, Purple)
Interpretation of results
3.4.4. Identification of Salmonella and Shigella
Transfer characteristic colonies on TSI slant, incubate for 18 h to 24 h at 37oC
Observe the Butt, slant and gas production Plating out on XLD agar plate
Plate out in selective media in petri dishes
Incubate at 35 or 37oC for 20 h to 24 h and a further 18 h to 24 h if necessary
Selective enrichment Incubate at 35 or 37oC for 16 to 20 hours
Weigh 25g of the sample in a sterile stomacher bag and add 225 ml sterile buffered peptone water (pre-enrichment media) [10-1]
Homogenize using a stomacher or blender for 1 – 2 min
Transfer 0.1 ml of culture into 10 ml of R.V. medium
Incubate at 42oC for 24 hours (if necessary, for further 24 h)
Interpretation of results Salmonella Spp characteristics:
Salmonella enterica: red slant, black-butt (H2S produced)
Salmonella Typhi: Red slant, yellow butt, H2S produced
Salmonella Paratyphi A: Red slant, yellow butt, gas production Shigella Spp characteristics:
Shigella sonnei: Red slant, yellow butt, no H2S produced
Shigella flexneri: Red slant, yellow butt, no H2S produced
Figure 09: Identification of Salmonella and Shigella
Chapter-4: Results
4.1. Bacteria Isolated and Identified from Fish
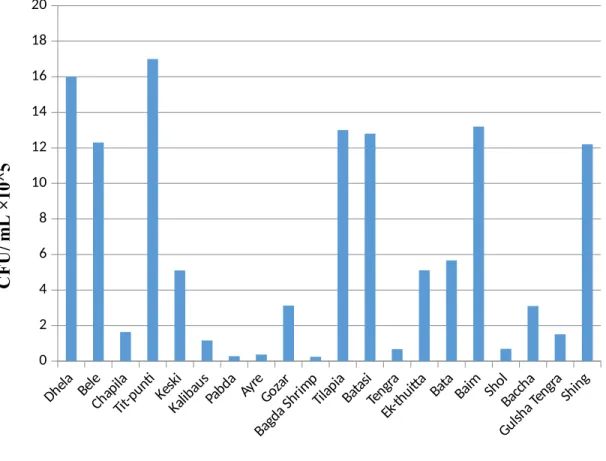
Twenty fish samples from previously selected sampling areas collected. Among the fish samples, highest bacterial colony was found in Fish-4 (10-2) and in Fish-3 (10-4). No bacterial colony was observed in 10-4 dilution plates.
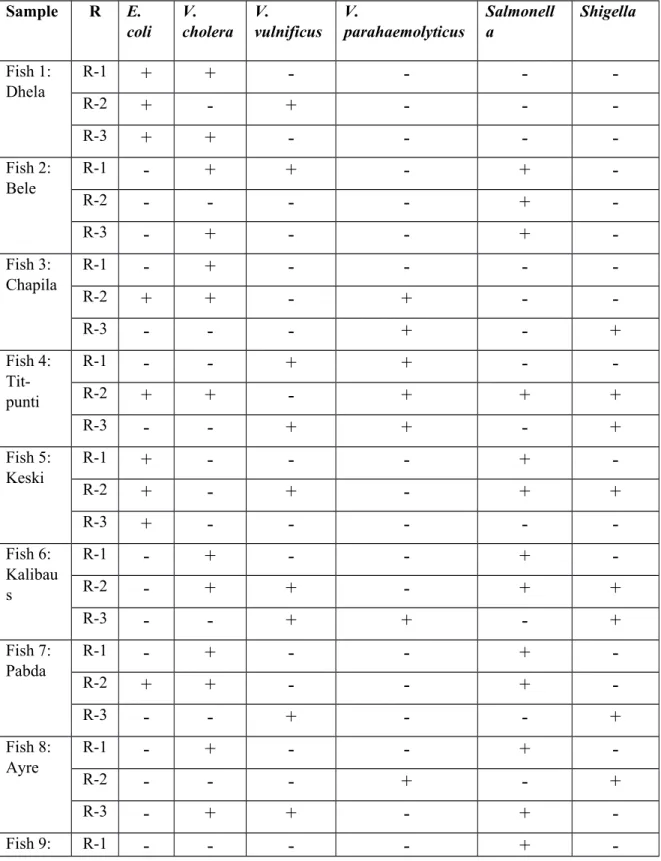
Vibrio vulnificus was found in all the fish samples whereas Vibrio cholera was only found in Fish-1, 2 and 5. Salmonella sp. was found in all the fish samples except Fish-5.
E. coli was present in Fish-4 and Fish-5 (minute). Vibrio vulnificus and Vibrio cholera both were present in all the water samples.
Dhela Bele Chapila
Tit-punti Keski
Kalibaus Pabda
Ayre Gozar Bagda Shrimp
Tilapia Batasi
Tengra Ek-thuitta
Bata
Baim Shol Baccha Gulsha Tengra
Shing 0
2 4 6 8 10 12 14 16 18 20
Fish Sample
CFU/ mL ×10^5
Figure 10: Colony of bacteria found in fish sample
Table 02: Pathogenic bacteria present in fish samples where “R” represent the replication of fish sample
Sample R E.
coli V.
cholera V.
vulnificus V.
parahaemolyticus
Salmonell a
Shigella
Fish 1:
Dhela
R-1 + + - - - -
R-2 + - + - - -
R-3 + + - - - -
Fish 2:
Bele
R-1 - + + - + -
R-2 - - - - + -
R-3 - + - - + -
Fish 3:
Chapila
R-1 - + - - - -
R-2 + + - + - -
R-3 - - - + - +
Fish 4:
Tit- punti
R-1 - - + + - -
R-2 + + - + + +
R-3 - - + + - +
Fish 5:
Keski
R-1 + - - - + -
R-2 + - + - + +
R-3 + - - - - -
Fish 6:
Kalibau s
R-1 - + - - + -
R-2 - + + - + +
R-3 - - + + - +
Fish 7:
Pabda
R-1 - + - - + -
R-2 + + - - + -
R-3 - - + - - +
Fish 8:
Ayre
R-1 - + - - + -
R-2 - - - + - +
R-3 - + + - + -
Fish 9: R-1 - - - - + -
Gozar
R-2 - - + - - -
R-3 - - + + + +
Fish 10:
Bagda Shrimp
R-1 + + - - - -
R-2 - - - -
R-3 + + - + - +
Fish 11:
Tilapia
R-1 + + + + + -
R-2 + + + - + -
R-3 + + - - - +
Fish 12:
Batasi
R-1 + + - - + +
R-2 - - + + + +
R-3 + + + - + -
Fish 13:
Tengra
R-1 - + + - + +
R-2 - - + + + -
R-3 + + + - + +
Fish 14:
Ek- thuitta
R-1 - + - - - -
R-2 - - - -
R-3 - + + - - +
Fish 15:
Bata
R-1 + + - - - -
R-2 + + - + + -
R-3 + - + + + -
Fish 16:
Baim
R-1 + + - - + -
R-2 + - + + + -
R-3 - - - +
Fish 17:
Shol
R-1 + + - - + -
R-2 - + - + + -
R-3 + - - + + -
Fish 18:
Baccha
R-1 - - + - - -
R-2 - - + - - +
R-3 - + - + - -
Fish 19:
Gulsha Tengra
R-1 - + - - - -
R-2 - + + - - -
R-3 - - + + - -
Fish 20:
Shing
R-1 + + - - - +
R-2 + - - - + -
R-3 + + - - + -
4.2. Bacterial quantification, isolation and identification from water and soil samples
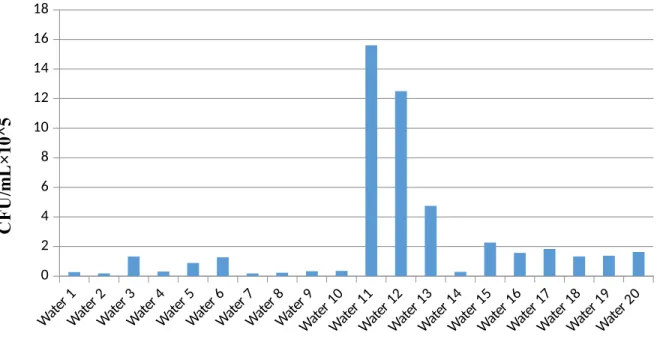
Water and soil samples were collected from previously selected 11 sampling areas (Figure 01). Number of bacterial colony found in water and soil samples are shown in Table 3 and Table 4 respectively. Highest bacterial load was found in water samples collected from Baghaichari (Water 11- 3.90×10⁶ CFU/g). Whereas, the lowest number of bacterial colony was found in samples collected from Kandemu (Water 7- 1.75×10⁴ CFU/g). After quantifying the number of bacterial colony in soil samples, it was found that both the highest and lowest number of colony was present in the samples collected from Baghaichari (Soil 11 and Soil 14).
Bacteria isolated and identified from different water samples are shown in Table 3. E.
coli and V. cholera was found in all the water samples. V. vulnificus was also present in most of the water samples except Sample Water- 4, 7 and 8 (Jalojan Ghat, Kandemu and Shuvolong jhorna). V. parahaemolyticus was found in most of the water samples except Water- 7, 16 and 18. Salmonella and Shigella both were absent in the water sample-5, 16 and 18. Salmonella sp. was also absent in the sample- 4, 6, 7, 17.
Bacteria isolated and identified from different soil samples are represented in Table 4.
After identifying the isolated bacterial colony, it was found that, E. coli was present in all the soil samples collected from different sampling areas. V. cholera, V. vulnificus, V.
parahaemolyticus, Salmonella and Shigella were not found in the sample 6 and 16 (collected from Jholong ghat and Baghaichari)
Water 1 Water 2
Water 3 Water 4
Water 5 Water 6
Water 7 Water 8
Water 9 Water 10
Water 11 Water 12
Water 13 Water 14
Water 15 Water 16
Water 17 Water 18
Water 19 Water 20 0
2 4 6 8 10 12 14 16 18
Water Sample
CFU/mL×10^5
Figure 11: Colony of bacteria found in water samples
Table 03: Pathogenic bacteria present in water samples where “R” represent the replication of water sample
Sample R E.
coli V.
cholera V.
vulnificus
V.
parahaemolyticus
Salmonella Shigella
Water 1 R-1 + + + + + -
R-2 + + - + + +
R-3 + + - + + -
Water 2 R-1 + + + + + +
R-2 + + + - + +
R-3 + + - - + -
Water 3 R-1 + + + + + +
R-2 + + + + + -
R-3 + - + - + +
Water 4 R-1 - + - - - -
R-2 - + - + - +
R-3 - - - + - -
Water 5 R-1 + + - - - -
R-2 + + + - - -
R-3 + + + + - -
Water 6 R-1 - - - -
R-2 - - - + - +
R-3 - - + - - +
Water 7 R-1 + - - - - -
R-2 + + - - - +
R-3 - - - -
Water 8 R-1 + - - - + +
R-2 + - - - + -
R-3 + + - - + +
Water 9 R-1 + + - + + -
R-2 + + + - + +
R-3 - + - + + -
Water 10 R-1 + - - - - -
R-2 - - - + - +
R-3 - - - -
Water 11 R-1 + + + + + +
R-2 + + - - + +
R-3 + + - - + -
Water 12 R-1 + + + + + +
R-2 + + + + - +
R-3 + - - - + -
Water 13 R-1 + + - - - -
R-2 + + + + - -
R-3 - - - -
Water 14 R-1 + + - - + -
R-2 + + - - + -
R-3 + + + - + +
Water 15 R-1 + + + + + +
R-2 + + - - + +
R-3 + + - - + +
Water 16 R-1 - + - - - -
R-2 + + + - - -
R-3 - + - - - -
Water 17 R-1 + + + - - -
R-2 + + + + - -
R-3 + + + + - +
Water 18 R-1 + + - - - -
R-2 + - + - - -
R-3 + + + - - -
Water 19 R-1 + + - + + -
R-2 + + + + + +
R-3 - - - - + -
Water 20 R-1 + + - - + -
R-2 + + + - + -
R-3 + + - + + +
Soil 1 Soil 2
Soil 3 Soil 4
Soil 5 Soil 6
Soil 7 Soil 8
Soil 9 Soil 10
Soil 11 Soil 12
Soil 13 Soil 14
Soil 15 Soil 16
Soil 17 Soil 18
Soil 19 Soil 20 0
2 4 6 8 10 12 14 16 18 20
Soil Sample
CFU/mL×10^5
Figure 12: Colony of bacteria found in soil samples
Table 05: Pathogenic bacteria present in soil samples where “R” represent the replication of soil sample
Sample R E.
coli V.
choler a
V.
vulnificus V.
parahaemolyticu s
Salmonella Shigella
Soil 1 R-1 + + + + + -
R-2 + + - + + +
R-3 + + + + + -
Soil 2 R-1 + + + + + +
R-2 - + - - + +
R-3 - + + - + -
Soil 3 R-1 + + + - + +
R-2 + + + - + +
R-3 + - + + + +
Soil 4 R-1 - + - - - -
R-2 - - + + - -
R-3 - - + + - -
Soil 5 R-1 + + - - - -
R-2 + + + - - -
R-3 + + + - - +
Soil 6 R-1 + - - - - -
R-2 - - - -
R-3 + - - - - -
Soil 7 R-1 - + - - + -
R-2 - + + - + +
R-3 + + - - + +
Soil 8 R-1 + - - - + -
R-2 + - - - - +
R-3 + + - + + +
Soil 9 R-1 + + - - - -
R-2 + + - + - +
R-3 - + - + - -
Soil 10 R-1 + - - - + -
R-2 + + - - + +
R-3 + - - - + -
Soil 11 R-1 + + + + + -
R-2 - - - + + -
R-3 - + + + + -
Soil 12 R-1 + + + + + +
R-2 + + + - + +
R-3 + + + - - +
Soil 13 R-1 + - - - - -
R-2 + + - + - -
R-3 + - - - - -
Soil 14 R-1 + - + + + -
R-2 + - + + + +
R-3 + - + + + -
Soil 15 R-1 + + + + + +
R-2 + + + - + +
R-3 + - - - + +
Soil 16 R-1 + - - - - -
R-2 + - - - - -
R-3 - - - -
Soil 17 R-1 + + - - - -
R-2 + + - - + +
R-3 + - - - + -
Soil 18 R-1 + - - - - -
R-2 - - - -
R-3 + + + + - -
Soil 19 R-1 + + + - + +
R-2 + + - + + +
R-3 - + - - + -
Soil 20 R-1 + + - + - -
R-2 + - + + - -
R-3 + + - + - -
“+”the result is positive “- the result is negative
Chapter-5: Discussion
Freshwater resources are a vital part of the biosphere and a necessity for ensuring the survival of living things, although only making up 3% of the world's total water supply (Wilson and Carpenter, 1999). (Jackson et al., 2001). Water tainted with harmful bacteria has the ability to spread a number of contagious illnesses to people (Sadeghi et al., 2007).
The most prevalent gastrointestinal illnesses spread by water contaminated with patient feces are cholera, salmonellosis, and shigellosis (Cabral, 2010).
The most frequent pathogenic bacteria discovered in connection with fish, soil, and water from several sites of Kaptai Lake were E. coli, Vibrio cholera, and Salmonella sp. Their prevalence was ascribed to the fish ponds being contaminated by animal feces (Abdelhamid et al., 2006). Salmonella and E. coli were isolated from fish, soil, and water samples, which suggests that animal manure added to fish reservoirs as feed and agricultural fields as organic fertilizer has contaminated the lake. The findings imply that perhaps the microbial quality of the fish under investigation is within acceptable ranges and doesn't now constitute a possible concern to the public health, as per published microbiological criteria mentioned by Gilbert et al. (1996). This could be explained by the little amounts of manure (around 50 kg/ha/week) used. Due to the typically high demand for animal dung to fertilize croplands in the remote areas under study, little is left over for fish feeding in earth dams. As little to no antibiotics are given to the rural animals under investigation, the topic of maximum residue limits in the utilized manure was not raised in order to elicit any reaction that would be worth looking into. However, the variety of possible infections found in the fish samples is concerning, especially at a time when so many people in our communities have impaired immune systems as a consequence of various diseases.
The majority of the time, Salmonella sp. was discovered in soil, water, and fish samples.
A significant health issue is the high prevalence of Salmonella in fish and water samples taken from earth dams. The presence of several enteric bacteria in fish, in particular of Salmonella, suggests contamination that might pose a risk to human health. It is strongly advised to implement strict rules and monitoring practices along with food safety education for suppliers (fishers and dealers) and, eventually, consumers on different GHP, GMP, and HACCP topics. Since coliforms are not part of the typical commensal bacteria in fish and water, their presence in fish as well as other samples shows the extent of environmental pollution E. coli is a non-indigenous pathogen that contaminates fish or aquatic environment in some way among the microorganisms which were separated and identified (Kvenberg, 1991). Environmental pollution and faecal contamination are