Electrocardiogram (ECG) is the graphical representation of the heart surface potential as a function of time. Finally, iris recognition techniques use pattern recognition based on high-resolution images of an individual's iris texture.
Morphology of Heart
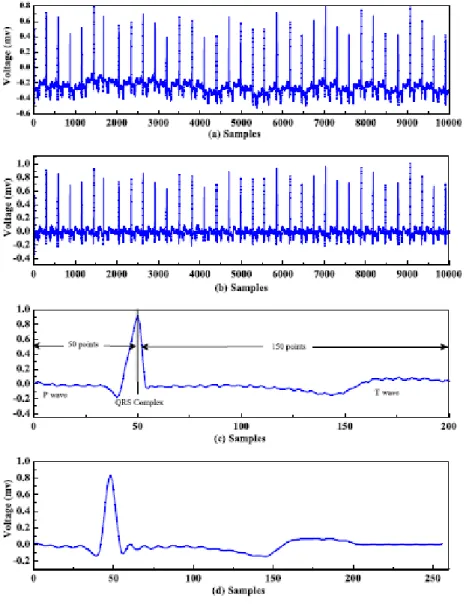
The P, QRS complex, and T waves reflect the rhythmic electrical depolarization and repolarization of the myocardium associated with the contractions of the atria and ventricles [5].
Motivation for ECG
The ECG is affected by physical and psychological activity, but although the specific local characteristics of the pulses may change, the overall direction waves and morphology are still observable. Bypass – ECG is collected from a live user which is difficult to use for any fraudulent activity.
Problem Definition
Especially since ECG acts as a liveness detection tool and it is almost impossible to falsify ECG signals, in this work we are motivated to show that this signal is a signature Biometric for any individual identification. Training under the stressed condition and testing under the non-stressed condition of the same subject may lead to false rejection due to differences in the subject's mental state.
Objective of the Thesis
Organization of the Thesis
Fiducial Points Based Approaches
Then the base positions are estimated from the location of the smallest radius of curvature. A threshold value is applied to the first derivative of the ECG signal by examining it within a preset window before the start of the Q curve.
Fiducial Points Independent Approaches
Then a synthetic ECG signal is formed on which DWT is applied to obtain the coecients used as the Biometric Identification Vector (BIV). ECG signal is used as a part of multimodal human identification m e t h o d [21], where Mel Frequency Cepstral Cecients (MFCC) are extracted from the ECG.
Other Approaches
In [24], the eigenvalue of the covariance matrix of the normalized heartbeats is used as the non-fiducial features along with the conventional fiducial features. The performance of the features extracted from covariance matrix is highly dependent on the successful segmentation of individual heartbeats and R-peak detection.
Conclusion
Due to the misclassification of the peak detector R, the quality of the feature vector may decrease, resulting in ineffective subject identification. Wavelet transform is a well-known multi-resolution analysis tool that can convey precise temporal and spatial information.
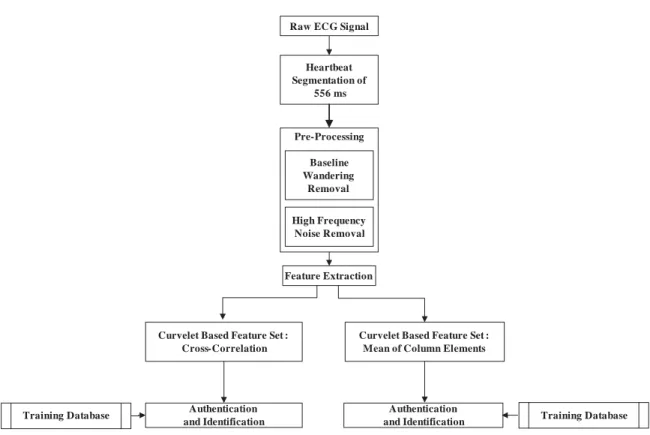
Brief Description of the Proposed Method
The distance between the features of test shots is compared with the features of all shots in the training database calculated using a simple Euclidean distance measure, and the minimum distance is found. If the person is allowed to access the system, the next step is to determine his/her identity.
Noise Reduction
Figure 3.2 (a) and (b) plots a noisy ECG signal and the ECG signal with the baseline stray noise removed, respectively. Most of the discriminative information of a person's ECG signal lies between 2 Hz and 40 Hz [8]. To remove the high-frequency noise, we transform the ECG signal in the frequency domain using Fast Fourier Transform (FFT).
The remaining FFT components are returned to the signal domain using inverse FFT, resulting in an ECG signal from which high-frequency noise has been removed.
Feature Extraction
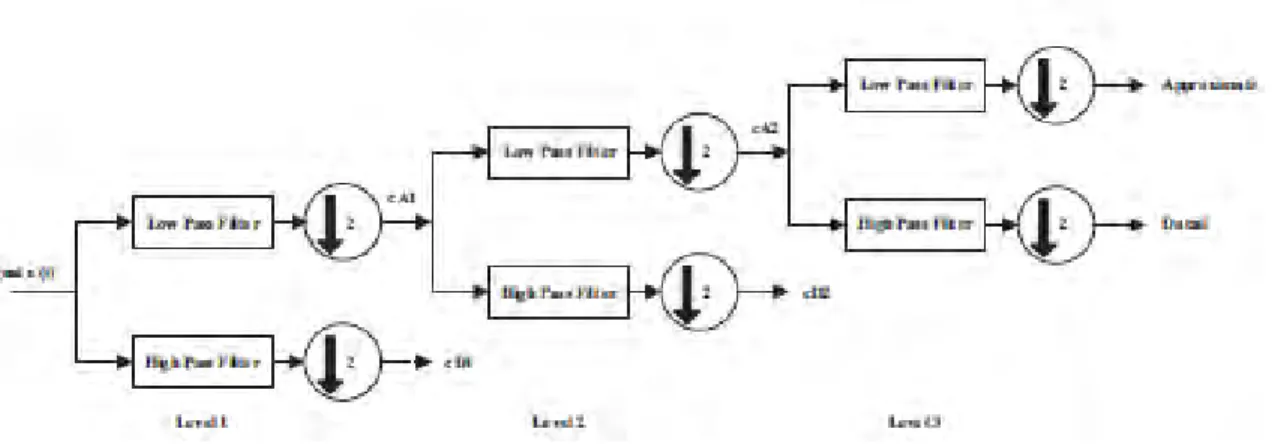
- Discrete Wavelet Transform
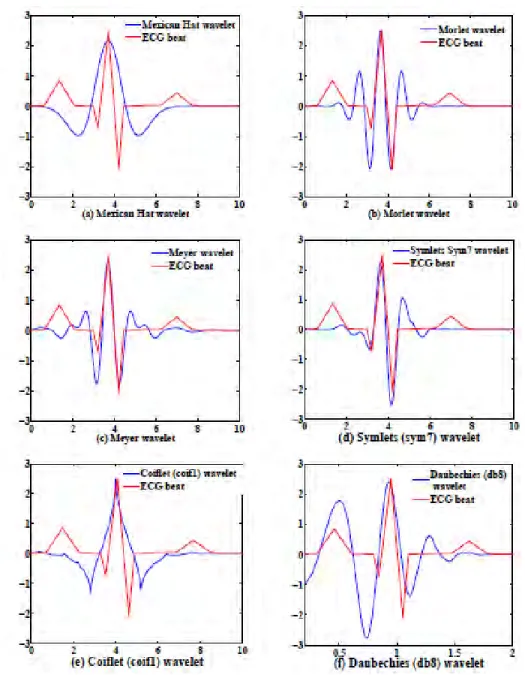
- Selection of Mother Wavelet
- Feature Based on DWT Coefficients of ECG
- Feature Based on DWT Coefficients of Autocorrelation Func-
The wavelet transform is based on a set of analysis wavelets that allow the decomposition of ECG signal into a set of coecients. Wavelet transform allows the decomposition of ECG signal into a set of coecients based on a set of analysis wavelets. Since ACF is symmetric function, it is found reasonable to apply DWT to the one-sided ACF of pre-processed ECG signal.
3.9: (a) ECG beats for person 1 and person 2(b) (c) Two-sided and one-sided autocorrelation functions of ECG beats in (a), (d) DWT approximate coefficients.
Authentication and Identification
Conclusion
Curvelet transform has gained significant popularity over wavelet-based techniques due to its improved direction and edge representation capabilities [30–32]. In this chapter, considering the advantages of curvelet transformation, a curvelet transformation-based framework for human identification using ECG is proposed. After providing a brief overview of curvelet transformation, the approach of displaying ECG in 2D is presented to realize the application of curvelet transformation to ECG.
A curvelet transform-based feature extraction scheme exploiting cross-correlation and column element averaging is described.
Curvelet Transform
The curve transformation is based on a certain anisotropic scaling principle, which is quite different from the isotropic scaling of waves. Since the introduction of curvelet transform researchers have developed numerous algorithmic strategies for its implementation based on the original architecture. The first generation curve transformation uses a complex series of steps involving the ripple analysis of radon transformation of 2D data.
The second-generation curve transform discards the use of the ridge transform, reduces the amount of redundancy in the transform, and significantly increases speed.
Feature Extraction
Two Dimensional Representation of ECG Signal
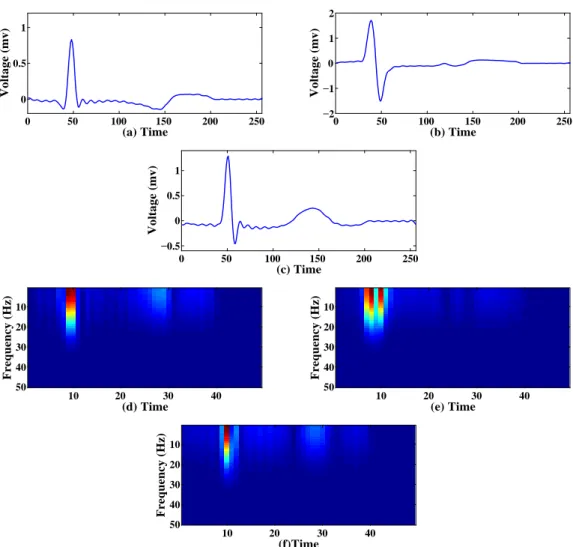
Since the ECG is 1D, its 2D time-frequency representation is obtained first before curve-based feature extraction. Such a time-frequency representation of 1D ECG data lends itself to the use of a curve, which then facilitates mathematical manipulation during feature extraction. It can be seen from these figures that the dominant patterns of each beat are less discriminative in the time domain.
But the illustrations by the spectrogram show different energy distribution in the time-frequency plane for the three beats.
Curvelet Transform Based Feature
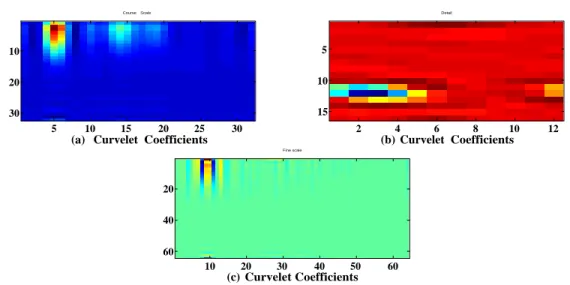
The zero-lag values of cross-correlation correspond to only coarse-layer curvature coefficients are demonstrated in Figs. Similar plots representing the zero-lag values of cross-correlation corresponding to detail layer for four curve coecients are shown in Figs. showed. For the proposed feature set based on zero lag of cross correlation corresponding to coarse, detail and fine layer curve coefficients as described by Fig.
4.9, which is obtained by applying PCA to the feature space based on zero lag of cross-correlation corresponding to coarse, detailed and fine layers of curvelet coefficients.
Conclusion
The next challenge is to correctly trace a person's identity among the entire trained subject using a matching mechanism. Therefore, performance evaluation of the proposed methods for identifying people using ECG is an important task. This chapter evaluates the results when a subject is tested with a single heartbeat and then tested with multiple heartbeats.
False rejection or misdetection can occur as no two readings of the same feature from the same person are identical.

Database and Simulation Details
The feature size is reduced by two methods: the first feature reduction method is based on the dominant energy bands, resulting in a feature vector of size twenty-three. We selected sixteen principal components as the feature vector after making a trade-off between feature size and accuracy. Another characteristic of the curvelet domain is the mean of column elements (MC), which is also reduced in a similar way as mentioned above.
The length of the MC elements reduced using dominant energy bands is twenty-seven.
Performance Evaluation Parameter
Authentication Accuracy
A subject's test model with its feature template already trained on the database can be truly accepted. A subject's test model with its feature template already trained in the database can be falsely rejected. A subject's test pattern without a training feature template in the database may be falsely accepted.
The test template for a subject without training function template in the database can really be rejected.
Identification Accuracy
TNi true negative for any person i means the number of test cases that are correctly classified as other than person i. Accuracy relates the number of positive testing cases that are correctly classified to the number of cases identified for that particular person. Sensitivity relates the number of positive test cases that are correctly identified to the number of test cases for that particular person.
Identification Accuracy of an individual relates the number of test cases that are correctly identified to the number of total test cases.
Performance Analysis using Feature Based on DWT Coefficients of
Goodness of feature
Single Heartbeat Analysis
By increasing the threshold, both FRR and FAR should be optimized for better system validation accuracy. The point at which FRR and FAR intersect is called the Equal Error Rate (EER), where the validation accuracy turns out to be optimal. This figure shows that as the threshold increases, the number of false positives increases and these beats incorrectly match the trained person.
Thus, the number of false positives increases, which lowers the values of both the authentication and identification accuracy gradually.
Multiple Heartbeat Analysis
This figure shows that at a lower threshold value no intruder gains access to the system, but at the same time the percentage of rejections of real users is very high. Table 5.2 shows FRR, GAR, FAR, authentication accuracy, identification accuracy, precision, sensitivity and specificity obtained using the proposed method of DWT coefficients of ECG beats using multiple heartbeats. Comparing Tables 5.1 and 5.2, it is clear that both authentication accuracy and identification accuracy improve with values of 90.13% and 97.94%, respectively, when the decision is made based on multiple heartbeats.
After applying majority voting, the FAR and FRR are reduced significantly, such as 10.26% and 9.47%, respectively.

Performance Analysis using Feature Based on DWT Coefficients of
Goodness of feature
Single Heartbeat Analysis
Multiple Heartbeat Analysis
The performance of the proposed method using the reduced cross-correlation feature based on the dominant energy bands is examined and the results are given in Table 5.5. In Table 5.7, the performance of the proposed method using the reduced cross-correlation feature based on PCA for the single heart beat analysis is shown. However, for the single heartbeat analysis it can be concluded that the proposed method using reduced cross-correlation features based on sixteen PCA gives validation and identification accuracy of 96.7.
However, for multiple heartbeat analysis, it can be concluded that the proposed method uses a reduced cross-correlation based on sixteen. PCA yields higher authentication and identification accuracies than those obtained using reduced cross-correlation based on dominant energy bands listed in Table 5.6. Table 5.11 shows the performance of the proposed method using reduced average of column elements based on PCA for single heartbeat analysis.