However, it is noted that no such design tools are available for post-tensioned PC beams. Suggestions have been made to select the optimum beam depth for post-tensioned PC I beams for a given span. 𝐴 = area of section, non-prestressed tensile reinforcement (in.2) 𝐴′ = area of section, non-prestressed compression reinforcement (in.2) 𝐴 = area of section, prestressing tube (in.2).
𝑆 = section modulus, non-composite beam from top (in,3) 𝑆 = section modulus, composite beam from top (in,3). 𝑌 = center of gravity, non-composite beam from the bottom (in.) 𝑌 = center of gravity, composite beam from the bottom (in.) 𝑌 = center of gravity, non-composite beam from the top (in.) 𝑌 = center of gravity, composite beam from above (in.).
INTRODUCTION
- General
- Background and Present State of Problem
- Objectives with Specific Aims and Possible Outcomes
- Outline of Methodology / Experimental Design
- Organization of The Thesis
But the designs of simply supported post-tensioned PC beams are not readily available to the engineers. Thus, the development of design tools for simply supported post-tensioned prestressed concrete beams is very essential. It will also be useful for the designers to review the preliminary design or design guidelines for simply supported post-tensioned PC beams.
Develop a set of design tools and charts to facilitate the simplified design of post-tensioned, simply supported I-beams. A computer program in MS Excell Spread Sheet developed for the design of post-tensioned simply supported I-beams incorporating the relevant AASHTO specification. iii).
LITERATURE REVIEW
- General
- Prestressing Concept, Materials and Prestressing System
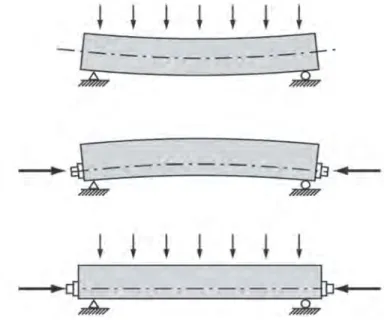
- Concept of Prestressing
- Principle of Prestressing
- Types of Prestressing and Sources of Prestressing Forces
- Properties of Prestressing Strand
- Advantages of Prestressing
- Limitations of Prestressing
- Pretensioning Systems and Devices
- Stages of Pretensioning
- Advantages and Dis-advantages of Pretensioning
- Post-tensioning Systems and Devices
- Stages of Post-tensioning
- Advantages and Disadvantages of Post-tensioning
- Prestress Losses
- Instantaneous Losses
- Long Term Losses
- Stress Limitations
- Stress Limits for Prestressing Steel
- Stress Limits for Prestressing Concrete
- Preliminary Member Selection
- Pretension Girder Section
- Pretension Girder Loads
- Pretension Girder Concrete Strength and Allowable Stresses
- Prestress Loss for Pretension Girder
- Pretension Girder Strands and Spacing
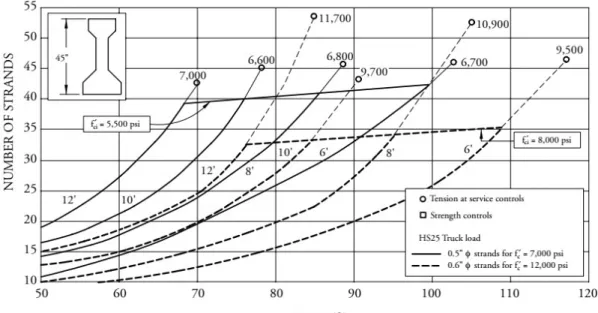
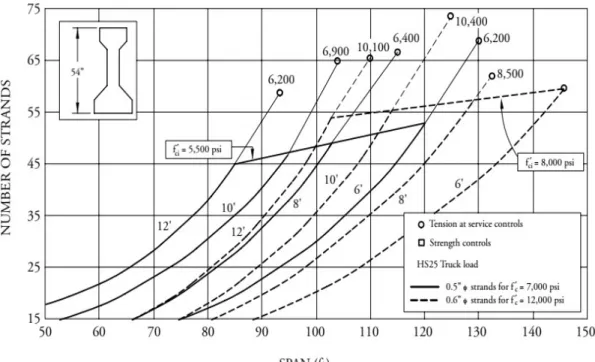
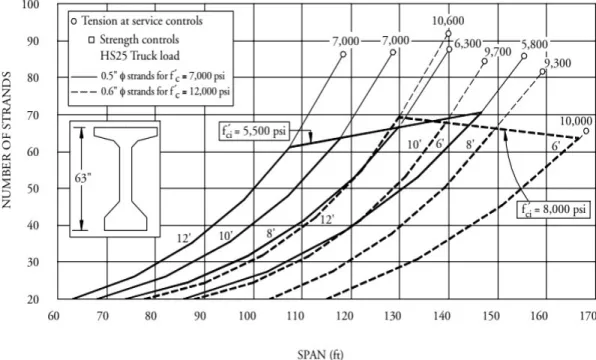
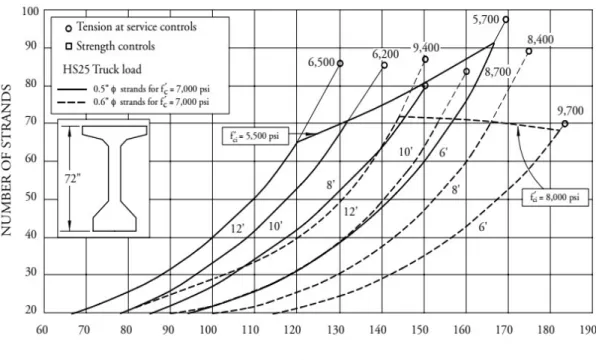
- Preliminary Design Charts of Pretensioned PC I-Girder
- Previous Relevant Studies
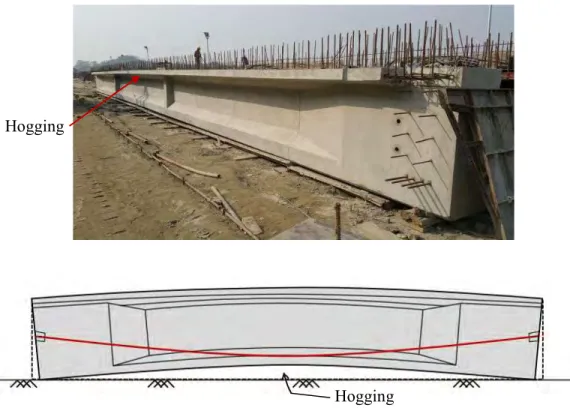
The tendons are pulled and stretched and then firmly anchored to the concrete at the end of the section. The various stages of the post-tensioning process are summarized as follows. a) Pouring concrete. When the prestressing force acts on the concrete profile, elastic shortening of the concrete occurs at the same time as the prestressing force acts on the prestressing steel.
This is because the compressive force from the tendons pulls both anchors off the concrete towards the center of the frame. The code establishes a portion of the concrete strength to resist both gravity loads and compression from the prestressing tendons.
PRELIMINARY DESIGN OF POST-TENSIONED PC GIRDER
Scopes
Preliminary Plan
General Design Principles of Bridge Superstructure Design
- General
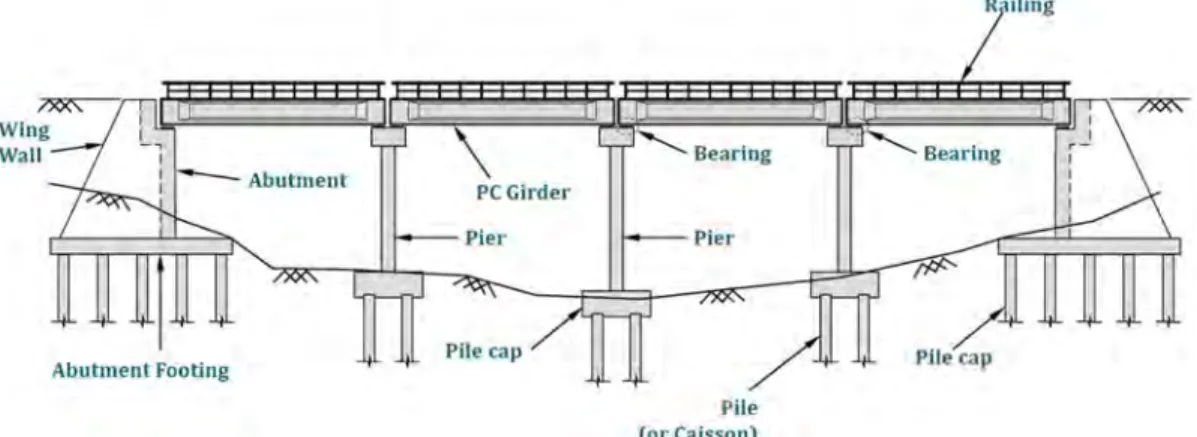
- Girder Layout and Structural Section
- Girder Sections Property
- Unit Weight of Materials
- Loads and Load Distribution
- Load types
- Dead loads
- Superimposed dead loads
- Highway live loading
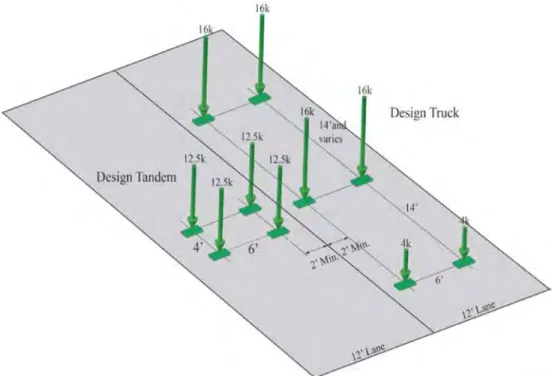
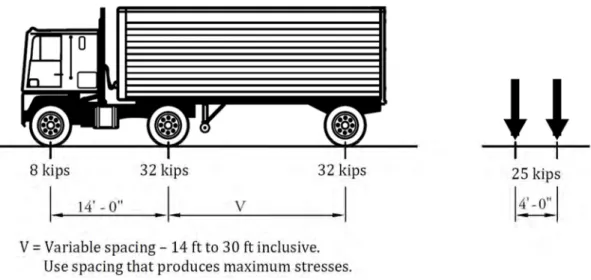
These non-composite dead loads include girders, deck slab weight, clamps, stay forms and diaphragms. Given the impossibility of a random maximum load on all lanes, the following percentages of live loads are allowed in STD Section 3.12 when refined analysis methods are used: Both the design lanes and the 10.0 ft load width position at each lane must be positioned to produce extreme force effects.
The design truck or tandem shall be positioned transversely so that the center of any wheel load is not closer than 2.0 feet from the edge of the design track when beams are designed. Components and connections of a bridge structure must comply with the appropriate combinations of factored ultimate force effects as specified at each of the boundary conditions.
Superstructure Consideration
Post-tensioned Girder
- Girder Sections
- Dead loads
- Concrete Strength and Allowable Stresses
- Prestress Loss
- Strands and Spacing
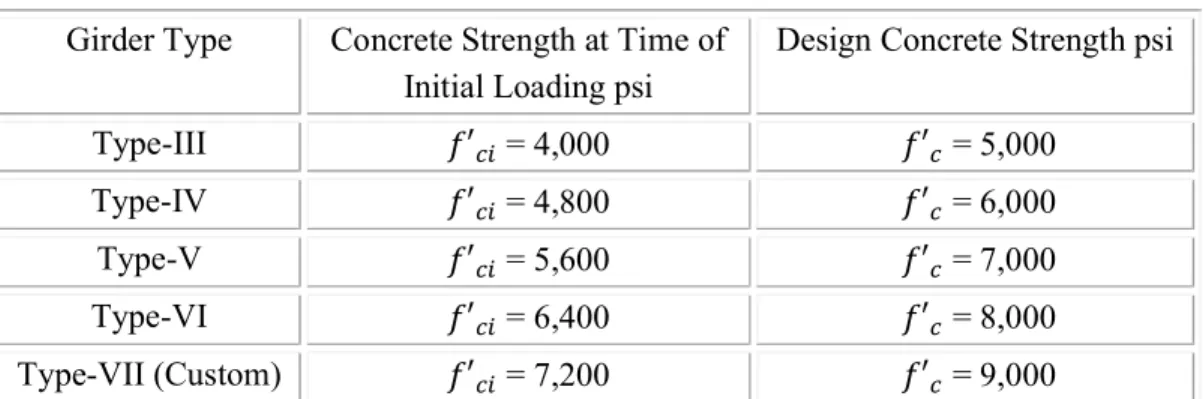
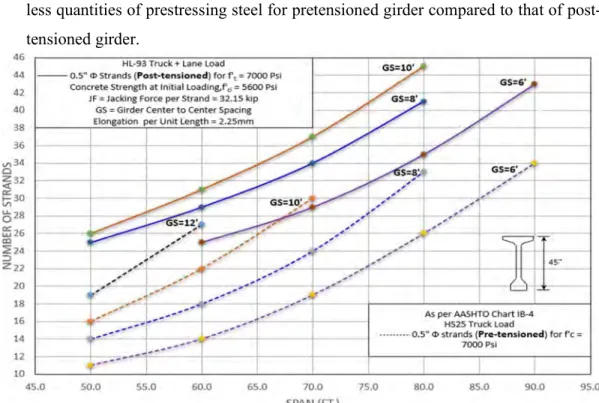
The live load considered for the charts is HL-93 which consists of a combination of Design truck or Design tandem and Design Lane load as specified in Article 3.6.1.2, AASHTO, 2017. Detailed calculation with imperial formula of the distribution factor is shown in Appendix A, "Typical post-tensioned I-beam design". The precast concrete products are assumed as follows, but the cast-in-place topping is assumed to have 𝑓′ = 4,400 psi.
In this case, sometimes 12 strands with a diameter of 13 mm form a braid, i.e. 12C13, or 19 strands with a diameter of 15 mm form a braid, i.e. 19C15 after Freyssinet bias.
Design Procedure of PC I-Girder
- Scope
- Span Length and Bridge Width
- Material Properties
- Superstructure concrete
- Prestressing steel
- Mild steel
- Selection of Typical Section
- Overhanging width of deck slab
- Web thickness of prestressed concrete I-girder
- Traditional minimum depths for constant depth superstructures
- Girder spacing and deck slab thickness
- Section Properties of PC I-Girder
- Loads on PC I-Girder
- Dead load
- Live load
- Live Load Distribution Factors
- Longitudinal stiffness parameter
- Distribution factor for moment, 𝑔𝑚
- Distribution factor for shear, 𝑔𝑣
- Shear and Moment
- live load shear and moment
- Factored combined shear and moment
- Jacking Force
- Prestress Losses
- Instantaneous losses
- Time dependent losses
- Flexural Design
- Stress limit for concrete before losses
- Girder top and bottom stress before losses
- Stress limit of concrete after losses
- Effective prestressing force after losses
- Stress after losses
- Minimum reinforcement
- Shear Design
- Behavior of concrete beam in shear
- Shear resistance
- Shear depth
- Determination of parameter β and θ
- Regions requiring shear reinforcement
- Minimum transverse reinforcement
- Shear stress on concrete
- Maximum spacing of transverse reinforcement
- Minimum longitudinal reinforcement
Minimum depth including deck for simply supported prestressed concrete I-beam may be taken as 0.045 of effective span length. a) The joist center-to-center spacing must be within 3.5 ft. e) Section modulus from top of non-composite beam, 𝑆 (in.3) f) Section modulus from bottom of non-composite beam, 𝑆 (in.3) g) Section modulus from top of composite beam, 𝑆 (in.3) . h) Section modulus from bottom of composite beam, 𝑆 (in.3) i) Section modulus from top of deck slab, 𝑆 (in.3) .. a) Dead load for structural component and non-structural attachment, DC (Section 3.3.2 , AASHTO, 2017). 𝐿 = effective span length of beam (ft.) 𝑘 = longitudinal stiffness parameter (in.4) 𝑡 = thickness of deck sheet (in.). Elastic shortening:- The loss due to elastic shortening in post-tensioned members, other than leaf systems, can be taken as 𝛥𝑓.
Compressive Stress: For temporary stresses, the compressive stress limit for post-tensioned concrete components shall be taken as 0.65𝑓′ (ksi). 𝑆 = section modulus from base of non-composite girder (in.3) 𝑀 = beam moment at specified section (kip – ft.). Due to the sum of effective prestress and permanent loads, compressive stress limits in prestressed concrete at Service Limit State (SLS) can be taken as 0.45𝑓′ (ksi).
Due to the sum of effective prestress, permanent loads and transient loads as well as shipping and handling compressive stress limits in prestressed concrete at service limit state can be taken as 0.6𝛷 𝑓′ (ksi). 𝑆 , 𝑆 = section modulus from top and bottom of non-composite beam (in.3) 𝑆 , 𝑆 = section modulus from top and bottom of composite beam (in.3) 𝑆 = section modulus from top of deck slab (in. 3). Shear resistance by prestressing force, 𝑉 = Component of prestressing force in the direction of the shearing force.
Effective shear depth taken as the distance measured perpendicular to the neutral axis between the resultants of the tensile and compressive forces due to bending. 𝑀 = Factored moment as Strength-1 (kip-ft.) 𝐴 = Area of non-prestressed longitudinal steel (in.2) 𝐴 = Area of prestressed steel (in.2). Net longitudinal tensile strain in the section at the center of gravity of the timber reinforcement can be taken as 𝜀.
Design Calculation and Flow Chart
Where consideration of torsion is required, the tensile capacity of longitudinal reinforcement on the bending stress side of the member shall be proportioned to satisfy 𝐴 𝑓 + 𝐴 𝑓 > 𝑉 − 0.5𝑉 𝑐𝑜𝑡 quation 20AA, 𝛷 = resistance factor for moment, shear and axial resistance 𝑉 = shear resistance provided by transverse reinforcement (kip). Stress at top and bottom of girders after all losses under all loads Compressive stress limit for beam at top under all loads, 0.6𝜙 𝑓′ (ksi) (AASHTO Table 5.9.2.3.2a-1).
Compressive strength of concrete (𝑓′ ) Specified number or area of threads (𝑁/𝐴 ) Area of extra mild steel (𝐴.
DEVELOPMENT OF DESIGN CHARTS
General
Parametric Considerations of Post-tensioned PC I-Girder
Development of Design Charts for Post-tensioned PC I-Girder
Comparison of Design Charts for Pre and Post-tensioned I-Girder
The adopted design procedure for evaluating the prestressed steel of a prestressed and poststressed beam indicates that the prestressing losses consist of instantaneous and time-dependent losses. It is observed that the time-dependent losses consisting of shrinkage losses, creep losses, and relaxation losses are almost similar for the prestressed and poststressed beam. However, the moment losses of a prestressed beam are less than that of a post-tensioned beam because the moment loss of a pre-stressed beam consists only of elastic shortening of the beam, while the moment loss of a post-tensioned beam consists of elastic shortening of the beam, chord friction loss, and anchor slip loss.
The less instantaneous loss of prestressed beam results in the lesser amounts of prestressing steel for prestressed beam compared to that of post-tensioned beam. It is also noted that design vehicle load adopted for prestressed beam design is HS25 truck load only, while the post-tensioned beams are designed for HL-93 truck load plus 0.64 kip/ft. This also results in the lesser amounts of prestressing steel for prestressed beam compared to that of poststressed beam.
Effective Span Range for Standard Girders
The author performed the simplified cost analysis of Type III and IV beams as shown in Appendix B for the 50 ft joint span range. However, it is noted that type III and IV beam will be cost effective for spans ranging from 50 ft to 100 ft. Based on the results of the cost-effectiveness analysis performed for the range of joint space of different types of beams a.
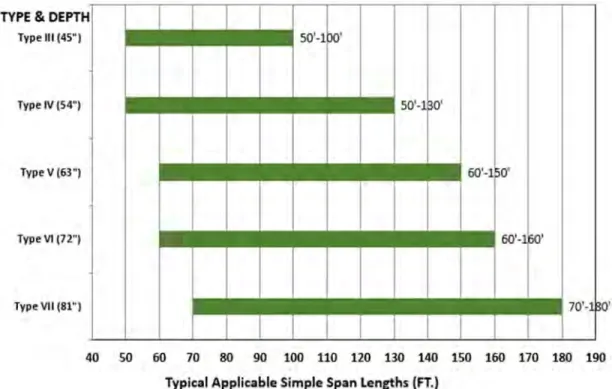
As previously mentioned in Section 4.4, it should be noted that no post-tensioned PC I-beam design charts are available in the literature, nor are there effective span ranges for AASHTO standard beam types. Therefore, it was difficult to compare the effective span range of different types of post-tensioned I-beams as suggested above in Figure 4.51. However, the effective span range of standard prestressed PC beams was found in FHWA-NHI-15-047 highway bridge superstructure, which can be used for comparison with the proposed span range of post-tensioned beams.
Consequently, efforts were made in this study to compare the proposed effective span range of post-tensioned I-girders with the available effective span range of pre-stressed I-beams. The comparison of effective span for pre-stressed and post-stressed I-girders is indicated in bar graph form and presented below in Figure 4.52.
CONCLUSIONS
Findings from This Study
Recommendations for Future Study
Effective flange width of composite girder is 1/2 distance to adjacent girder on each side = 48.0 in. Cross-sectional area of non-composite girder at end, Ag-end = 2107 in.2 Cross-sectional area of non-composite girder at center , Ag-mid = 1295 in.2 X-sectional area of non-composite girder at transformed section, Ag-trns. Total area of strand, Aps = Nstrand(total)×aps = 10.9 in.2 Loss due to elastic shortening after transfer, ΔfpES.
For rectangular section behavior, the distance between the neutral axis and the pressure plane is c c = Apsfpu/(α1f'csβ1bf + kAps×fpu/dp) = 9.9 in. Concrete strength at initial load/at transfer, f'ci/f' ct = 5.6 ksi Section modulus from top of non-composite beam, St = 22291in.3 Section modulus from bottom of non-composite beam, Sb = 21281in.3 Section modulus from top of composite beam, Stc = 7E+04 in.3 Section modulus from bottom of composite beam, Sbc = 29707in.3 Section modulus from top plate of composite beam, Stsc = 53415in.3 Cross-sectional area of non-composite beam, Ag = 1295 in.2. 'Y' ordinate at the end from the bottom of the beam (in.) 'Y' ordinate at the middle from the bottom of the beam (in.).
Integrating the tensile stress over the corresponding area of the beam, the tensile force, T = fci tip*btop*X/2 = 24.0 kip Allowable stress in reinforcement, fs = 0.5fy < 30 ksi = 30.0 ksi Area required of longitudinal steel at top of beam, As, longitudinal = T/fs = 0.8 in.2 Consider applied dia. Concrete stress at initial loading/transfer, f'ci/f'ct = 5.6 ksi Concrete modulus of elasticity for beam in transfer, Eci = 4401 ksi Concrete modulus of elasticity for beam, EG = 4921 ksi Moment of inertia for non-composite beams, Ig = 783884 in.4 Moment of inertia for composite beams, Igc = 1527199in.4. The unit area of concrete to be included in the interface shear transfer, Acv = bvi×lvi = 42.0 in.2/in.
IV