This thesis entitled "Analysis of Student Performance using Data Mining", submitted by the group as mentioned below, has been accepted as satisfactory in partial fulfillment of the requirements for the degree B.Sc. This is to certify that the work presented in this thesis, entitled "Analysis of Student Performance using Data Mining", is the outcome of the investigation and research carried out by the following students under the guidance of Dr. Syed Akhter Hossain, Professor and Head of the Department, Department of Computer Science and Engineering, Daffodil International University (DIU), Dhaka, Bangladesh.
Syed Akhter Hossain, Professor and Head of the Department, Department of Computer Science and Engineering, Daffodil International University (DIU), Dhaka, Bangladesh, for his constant supervision, loving guidance and great encouragement and motivation. The experimental analysis of the data through the results of the survey was satisfactory which led to further study. To proceed further through data mining, based on the understanding of the survey, data was collected from the central database of MIST where the main objective was to relate CGPA and student performance.
We investigated various properties of the data; collected and developed a classification hypothesis to apply the data mining algorithms.
Objective
Motivation
Layout of the report
Chapter 3 discusses the data mining work related to student performance that has been done so far. It is the computer-assisted process of mining and analyzing large sets of data and then extracting meaning from the data. The most basic forms of data for mining come from: database data, data warehouse and transactional data.
Data mining is a powerful new technology with great potential to help companies focus on the most important information in their data warehouses and sites. With the help of data mining by analyzing their learning environment and other behavioral factors, teachers will be able to provide the necessary guidance to improve their abilities or learning abilities.
Machine Learning
In today's fiercely competitive business environment, companies must quickly turn their gigabytes of raw data into meaningful insights about their customers and markets that will guide their marketing, investment and management strategies. Many institutions and other university systems around the world have tried to overcome the difficulties of identifying the actual needs of students with learning analytics. Machine learning algorithms can be organized into a taxonomy based on the desired output of the algorithm or the type of input available during training the machine.
Some popular machine learning algorithms are supervised learning, unsupervised learning, semi-supervised learning and reinforcement learning [2]. Machine learning and data mining, these two terms are sometimes confused as they often use the same methods and have significant overlap. Machine learning is the task of building knowledge and storing it in some form in a computer based on known features obtained from training data.
Data mining focuses on the discovery of (previously) unknown properties in the data and helps us build models to detect the patterns that allow us to classify or predict situations based on a set of facts or factors.
Basic Representation
Most data mining methods are based on proven techniques from machine learning, pattern recognition and statistics: classification, clustering, regression and so on. Extract, transform and load transaction data into the data warehouse system ⇒ Store and manage the data in a multi-dimensional database system ⇒ Provide data access to business analysts and IT professionals ⇒ Analyze the data with application software ⇒ Present the data in a convenient format.
![Figure 2.1: an overview of data mining process [1]](https://thumb-ap.123doks.com/thumbv2/filepdfnet/10776346.0/16.892.204.706.721.918/figure-2-1-overview-data-mining-process-1.webp)
Classification
Clustering
Related Algorithms
K-means Algorithm
K-nearest Neighbour Classification
In particular, a well-known result by Cover and Hart[9] shows that the error of the nearest neighbor rule above is bounded by twice the Bayes error under certain reasonable assumptions. The error of the general kNN method also asymptotically approximates that of the Bayes error and can be used to approximate it.
Bayes Classification
That is, the NB classifier predicts that instanceX belongs to the classCi if and only if P(Ci|X) > p(Cj|X)for1≤j ≤m, j 6=i. If the prior probabilities of the class are not known, it is generally assumed that the classes are equally likely, that is, P(C1) =P(C2) = · · ·=P(Cm), and therefore maximize P(Ci) . The class priorities are calculated by P(Ci) =|Ci, D|/|D|, where |Ci, D is the number of training instances belonging to the classCi inD.
The attributes are conditionally independent of each other, given the instance's class label.
Introduction
Student performance and data mining
Related works
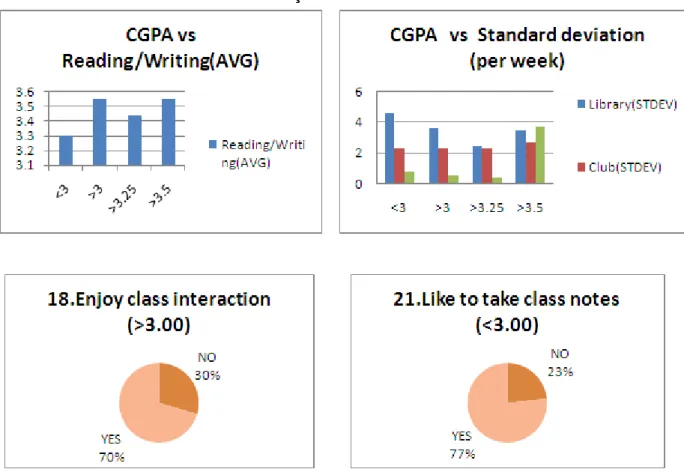
In order to understand the competence of students, the triggering factors that motivate or demotivate a student to do well, a survey was initially conducted among more than 500 students in MIST. After re-modification, a two-column questionnaire containing 36 multiple-choice questions was designed to conduct the survey. Various pie charts, bar charts and line curves were created based on the survey data for data analysis and decision making.
To continue we decided to get data from the student database. We then collected data from the MIST student database.
Data preparation and preprocessing
Identification of parameters for data mining
Using data mining tool Weka
Weka file format
The ARFF Data section of the file contains the data declaration line and the actual instance lines. The @data declaration is a single line that indicates the beginning of the data segment in the file. Each instance is represented on a single line, with carriage returns indicating the end of the instance.
They must appear in the order in which they are declared in the header section (ie the data corresponding to the nth .. attribute declaration is always the nth field of the attribute).
Convert data to ARFF format
After conduct survey processing data
In a decision tree algorithm, one of the main complications is the optimal size of the final tree. All theorists and specialists are still now looking for techniques to make this algorithm more efficient, cost-effective and accurate. The goal of pruning is to reduce the complexity of the final classifier and better predictive accuracy by reducing overfitting and removing sections of a classifier that may be based on noisy or erroneous data. Post-pruning requires more computation than pre-pruning, but generally leads to a more reliable tree.
Subtree replacement can be used as an alternative method after pruning by disabling subtree increment with -S, and the pruning confidence can be adjusted with -C. Reduced error pruning (-R) is a post-pruning method that uses a hold-out set for error estimates. The portion of data left behind for pruning is determined by setting the number of folds (an unfortunately overloaded term if you're also doing k-fold cross-validation).
All pruning can be turned off with -U, which will either throw an exception if any of the above pruning switches are set. Now, if coin is not fair, there is uncertainty and it offers a lower entropy rate. Entropy for any P can be calculated as:-. This case is further divided into two different groups or cases based on their calculated entropy and information gain.
Entropy and information gain can be measured just by putting the values in the formula as follows: -. Entropyaf t= 7/14∗Entropylef t+7/14*Entropyright InformationGain=Entropybef-Entropyaf t. K-fold cross validation k-fold cross validation is a common technique for evaluating the performance of a classifier. To obtain an accurate estimate of the accuracy of a classifier, k-fold cross-validation is performed several times, each with a different randomization in Step 1.
Results from WEKA analysis
Performance analysis of data set
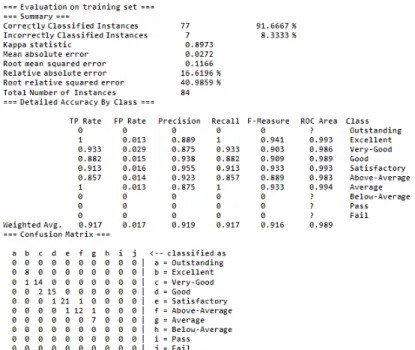
The decision tree ranked 8 excellent items as excellent and 1 as very good, leading to 1 misclassification. The decision tree classified 14 very good objects as very good and 2 as good, resulting in 2 misclassifications. The decision tree ranked 15 good facilities as good and 1 as satisfactory, resulting in 1 misclassification.
Validation of experimental results
Constraints and assumptions
This article is an overview of performance analysis related to EDM and provides an overview of the most relevant work in this area to date. Each study is classified not only by the type of data and DM techniques used, but also, and more importantly, by the type of educational task they solve. In this paper, the J48 data mining algorithm was applied to the preoperative assessment data to predict course success, and the performance of the learning methods was evaluated based on their predictive accuracy, ease of learning, and user-friendly features.
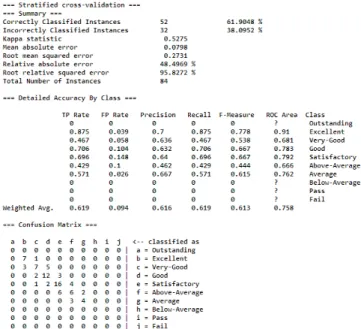
We learned that some algorithms improve their classification performance when we apply such preprocessing tasks as discretization and rebalancing of data, but others do not. We found the highest accuracy of 61% when we applied J48 algorithm and therefore we choose it for our data. We also knew that a good classifier model must be accurate and understandable for the students and instructors of a University.
Future Expansion
Odeniyi, "Performance evaluation of naive bays and decision stub algorithms in mining students' educational data.," International Journal of Computer Science Issues (IJCSI), vol. Nievola, "Discovering fuzzy classification rules with genetic programming and co-evolution," in Principles of Data Mining and Knowledge Discovery, pp. Li, “A Lagrangian formulation of zador's entropy-constrained quantization theorem,” Information Theory, IEEE Transactions on, vol.
Vijayalakshmi, “Efficiency of decision trees in predicting students' academic performance,” in First International Conference on Computer Science, Engineering,. Fujinaga, “jsymbolic: A feature extractor for midi files,” inProceedings of the International Computer Music Conference, pp. Abd-Alhafez, “Performance evaluation of a genetic algorithm-based approach to network intrusion detection systems,” in 13th International Conference on Aerospace Sciences and Aviation Technology, Military Technical College, Kobry Elkobbah, Cairo, Egypt, 2009.
Method: 1: T=0; 2: Determine the best splitting attribute; 3: T=Create a root node and mark it with the split attribute;. 6 D=dataset created using partition predicate on D; 7: if a breakpoint is reached for this path, then 8: T’=Create a leaf node and label it with the appropriate class; 9: otherwise 10:.
Data classification in WEKA
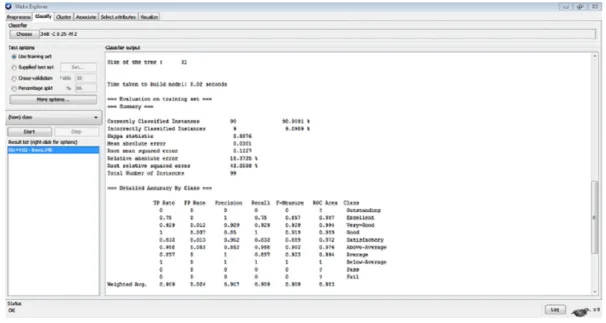
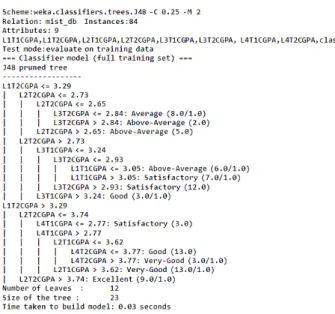
Output from weka’s classification model (A)
Output from weka’s classification model (B)
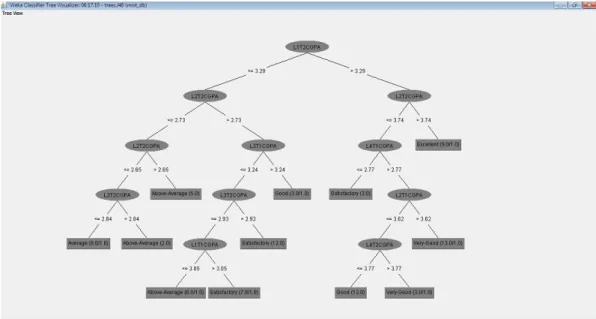
Classification tree visualization
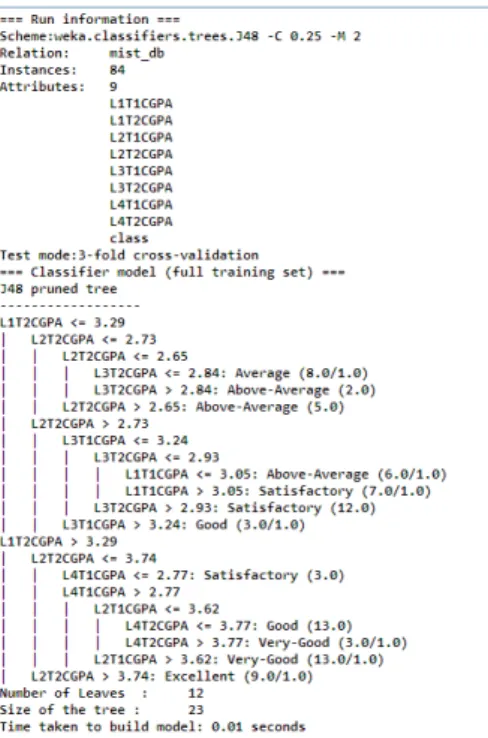
Output form WEKA’S classification model of Test Data (A)
Output form WEKA’S classification model of Test Data (B)
Question